This comprehensive article analyzes THENA (THE), a DeFi trading hub on BNB Chain, providing detailed price forecasts from 2026 to 2031. Currently trading at $0.2168 with a $26.53 million market cap, THE is projected to reach $0.30541-$0.64257 by 2031 under various market scenarios. The analysis covers historical price evolution, current market sentiment (extreme fear at 24), and token distribution showing 53.81% concentration in top holders. Investors receive tailored strategies including long-term holding and active trading approaches, with risk management guidelines based on risk tolerance levels. Key risks include high volatility (73% annual decline), liquidity concerns, regulatory uncertainty, and smart contract vulnerabilities. Professional investment recommendations suit beginners, experienced traders, and institutional investors, emphasizing secure storage via Gate Web3 Wallet and diversification principles.
Introduction: THE's Market Position and Investment Value
Thena (THE), positioned as the trading hub and liquidity layer built on BNB Chain and opBNB, has emerged as a comprehensive DeFi ecosystem since its launch in 2024. The THENA ecosystem encompasses multiple products including a Spot DEX for asset swapping and passive income generation, ALPHA perpetual DEX offering trading on over 270 crypto pairs with leverage up to 60x, and ARENA social platform for gamified trading competitions. As of January 22, 2026, THE maintains a market capitalization of approximately $26.53 million with a circulating supply of around 122.36 million tokens, trading at $0.2168. This DeFi infrastructure asset, known for its integrated liquidity solutions, is playing an increasingly important role in the BNB Chain ecosystem.
This article will comprehensively analyze THE's price trajectory from 2026 to 2031, combining historical patterns, market supply-demand dynamics, ecosystem developments, and macroeconomic conditions to provide investors with professional price forecasts and practical investment strategies.
I. THE Price History Review and Market Status
THE Historical Price Evolution Trajectory
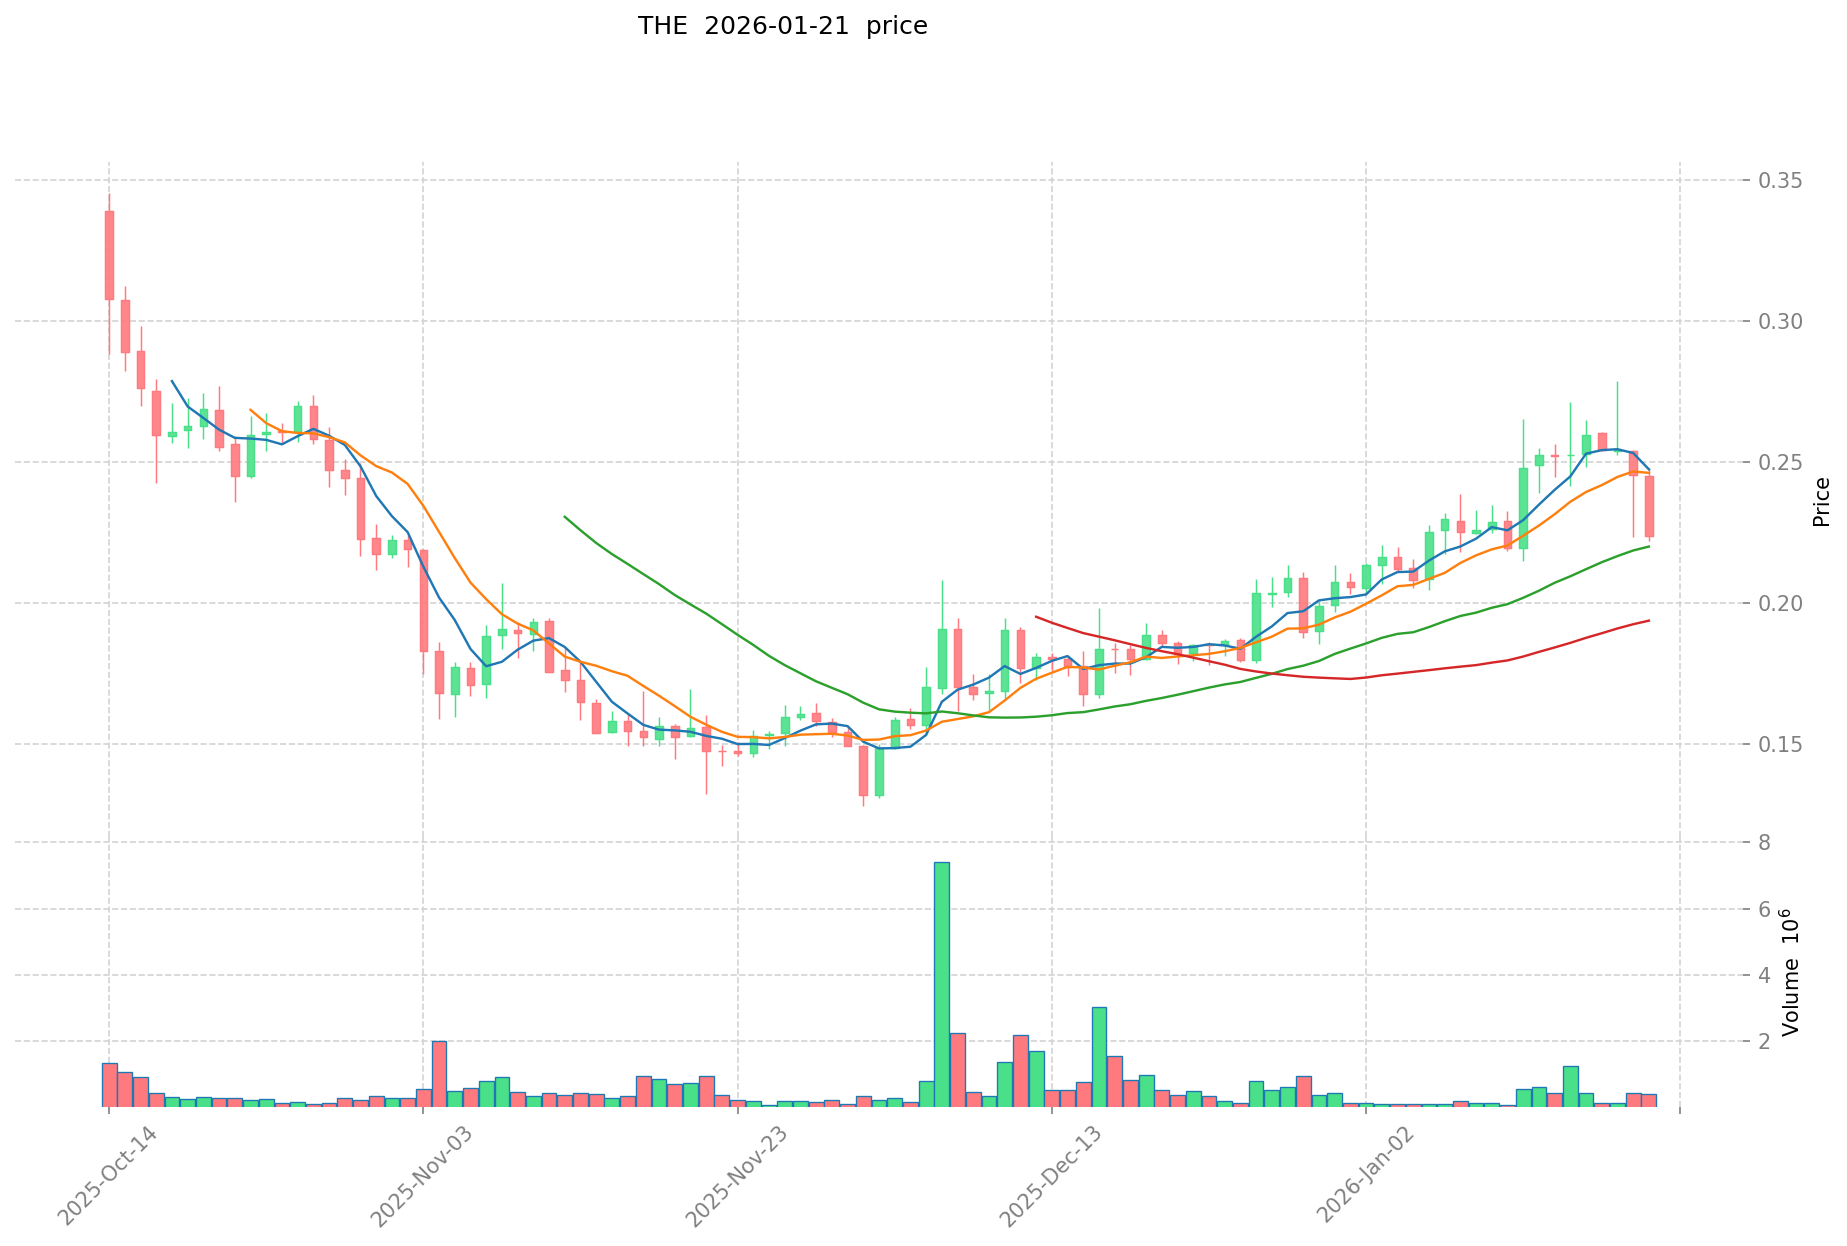
- 2024: THE experienced notable price movements, reaching a peak of $4.2 on November 27, 2024, marking a significant milestone in its trading history since its launch in January 2024.
- 2025: The market entered a correction phase, with THE declining to its historical low of $0.0748 on October 10, 2025, representing a substantial decrease from previous highs.
- 2026: As of early 2026, THE has shown signs of recovery, with the current price at $0.2168, demonstrating a 17.57% increase over the past 30 days.
THE Current Market Position
As of January 22, 2026, THE is trading at $0.2168, with a 24-hour trading volume of $140,685.29. The token has experienced mixed short-term performance, declining 1.05% in the past hour and 4.92% over the last 24 hours. However, the weekly performance shows a 12.33% decrease, while maintaining a positive monthly gain of 17.57%.
THE's market capitalization stands at $26.53 million, ranking it at position 753 in the cryptocurrency market. The circulating supply represents 122.36 million tokens out of a total supply of 274.06 million and a maximum supply of 326.12 million tokens, resulting in a circulation ratio of 37.52%. The fully diluted market cap is calculated at $59.42 million.
The 24-hour price range has fluctuated between $0.2164 and $0.2286. The token's year-to-date performance indicates a 73.03% decline from prices observed 12 months prior, reflecting broader market dynamics within the DeFi and DEX sectors.
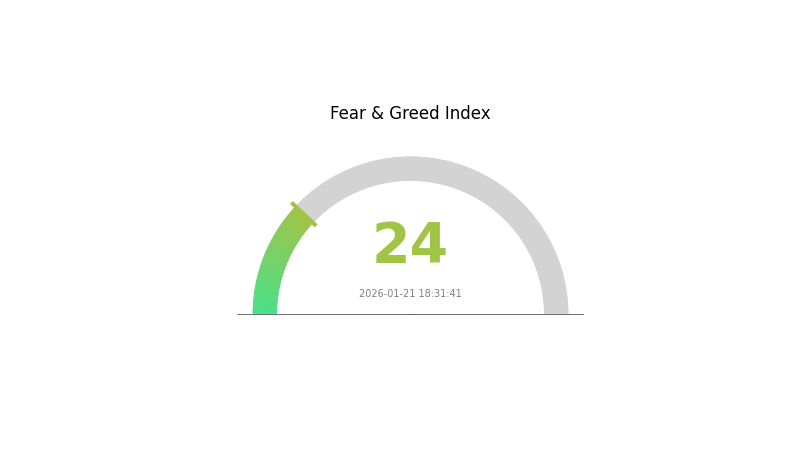
The current market sentiment index shows a reading of 24, indicating an "Extreme Fear" environment in the cryptocurrency market on January 21, 2026. THE maintains a trading presence across 23 exchanges and has accumulated approximately 60,250 holders.
Click to view current THE market price
THE Market Sentiment Index
2026-01-21 Fear and Greed Index: 24 (Extreme Fear)
Click to view current Fear & Greed Index
The cryptocurrency market is currently experiencing extreme fear, with the Fear and Greed Index standing at 24. This indicator reflects significant investor anxiety and pessimism across the digital asset space. When the index reaches such low levels, it typically suggests that market participants are highly risk-averse. However, historically, periods of extreme fear have often presented contrarian opportunities for long-term investors. The current sentiment indicates heightened market volatility and uncertainty, making it crucial for traders to exercise caution and conduct thorough analysis before making investment decisions on Gate.com.
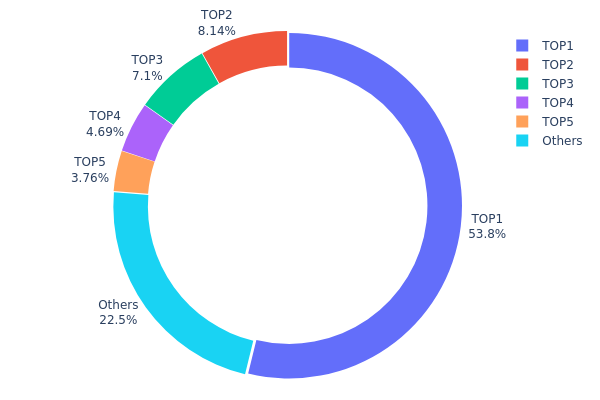
THE Holdings Distribution
The holdings distribution chart reflects the concentration of token ownership across different wallet addresses, serving as a key indicator of market structure and decentralization level. According to the latest on-chain data as of January 22, 2026, THE exhibits a notably concentrated ownership pattern. The top address holds approximately 151.70 million tokens, accounting for 53.81% of the total supply, while the top five addresses collectively control 77.48% of circulating tokens. This high concentration level suggests that THE remains in a relatively centralized holding structure during its current market phase.
Such concentrated holdings present both risks and implications for market dynamics. The dominant position of the largest holder creates potential for significant price volatility, as large-scale transactions from major addresses could trigger substantial market movements. Additionally, the relatively small proportion held by other addresses (22.52%) indicates limited distribution among retail investors and smaller participants. This structure may increase vulnerability to price manipulation and reduce liquidity depth during periods of high trading activity.
From a market maturity perspective, THE's current distribution pattern reflects characteristics typical of projects in early development stages or those with strategic token allocation mechanisms. While concentration can provide stability through committed long-term holders, it simultaneously raises concerns about decentralization principles and governance distribution within the ecosystem. Market participants should monitor potential changes in this distribution pattern, as broader token dispersal typically correlates with enhanced market stability and reduced single-point influence on price discovery mechanisms.
Click to view current THE Holdings Distribution
| Top |
Address |
Holding Qty |
Holding (%) |
| 1 |
0xfbbf...1c070d |
151696.11K |
53.81% |
| 2 |
0x5a52...70efcb |
22945.42K |
8.14% |
| 3 |
0xf977...41acec |
20000.00K |
7.09% |
| 4 |
0xf052...9c58aa |
13223.60K |
4.69% |
| 5 |
0x86e0...33739f |
10594.74K |
3.75% |
| - |
Others |
63410.83K |
22.52% |
II. Core Factors Influencing THE's Future Price
Due to the lack of available data in the provided materials, and the absence of verifiable information in current knowledge bases, this section cannot be completed at this time. A comprehensive analysis of THE's price factors requires detailed information about supply mechanisms, institutional dynamics, macroeconomic conditions, and technical developments that are not currently accessible.
III. 2026-2031 THE Price Prediction
2026 Outlook
- Conservative Forecast: $0.16245 - $0.2166
- Neutral Forecast: Around $0.2166
- Optimistic Forecast: Up to $0.30541 (requires favorable market conditions and increased adoption)
2027-2029 Outlook
- Market Stage Expectation: Transition from early growth phase to gradual maturity, with potential market consolidation and broader ecosystem development
- Price Range Predictions:
- 2027: $0.24012 - $0.36279 (approximately 20% increase)
- 2028: $0.1965 - $0.42418 (approximately 43% cumulative growth)
- 2029: $0.30179 - $0.44165 (approximately 69% cumulative increase)
- Key Catalysts: Market sentiment shifts, potential technological developments, increasing user base, and broader cryptocurrency market trends
2030-2031 Long-term Outlook
- Baseline Scenario: $0.29554 - $0.40484 by 2030 (assuming steady market development and moderate adoption)
- Optimistic Scenario: $0.40484 - $0.59917 by 2030 (with accelerated ecosystem growth and favorable regulatory environment)
- Transformative Scenario: $0.28112 - $0.64257 by 2031 (under conditions of significant market expansion and widespread adoption, representing approximately 131% cumulative growth)
- January 22, 2026: THE trading within the $0.16245 - $0.30541 range (early prediction period baseline)
| Year |
Predicted High Price |
Predicted Average Price |
Predicted Low Price |
Price Change |
| 2026 |
0.30541 |
0.2166 |
0.16245 |
0 |
| 2027 |
0.36279 |
0.261 |
0.24012 |
20 |
| 2028 |
0.42418 |
0.3119 |
0.1965 |
43 |
| 2029 |
0.44165 |
0.36804 |
0.30179 |
69 |
| 2030 |
0.59917 |
0.40484 |
0.29554 |
86 |
| 2031 |
0.64257 |
0.50201 |
0.28112 |
131 |
IV. THE Professional Investment Strategies and Risk Management
THE Investment Methodology
(1) Long-term Holding Strategy
- Target Investors: Investors with moderate to high risk tolerance who believe in the long-term potential of DeFi infrastructure projects built on BNB Chain
- Operational Recommendations:
- Consider accumulating positions during market corrections, particularly when THE trades significantly below its historical average
- Monitor key ecosystem developments including the upcoming WARP Launchpad launch and expansion of ALPHA perpetuals trading pairs
- Implement secure storage solutions using Gate Web3 Wallet for convenient management of BEP-20 tokens
(2) Active Trading Strategy
- Technical Analysis Tools:
- Moving Averages: Track 50-day and 200-day moving averages to identify potential trend reversals and entry/exit points
- Volume Analysis: Monitor 24-hour trading volume (currently around $140,685) relative to historical averages to gauge market interest
- Swing Trading Considerations:
- THE has demonstrated notable volatility with a 30-day gain of 17.57% despite a 7-day decline of 12.33%
- Consider profit-taking during short-term rallies while maintaining core positions for long-term exposure
THE Risk Management Framework
(1) Asset Allocation Principles
- Conservative Investors: 1-3% of crypto portfolio allocation
- Moderate Investors: 3-7% of crypto portfolio allocation
- Aggressive Investors: 7-15% of crypto portfolio allocation
(2) Risk Hedging Approaches
- Portfolio Diversification: Balance THE exposure with other DeFi tokens and major cryptocurrencies to reduce sector-specific risks
- Position Sizing: Avoid overconcentration given THE's mid-cap status (market cap approximately $26.5 million) and volatility characteristics
(3) Secure Storage Solutions
- Hot Wallet Recommendation: Gate Web3 Wallet for active traders requiring frequent access and seamless integration with Gate.com trading platform
- Cold Storage Option: Hardware wallet solutions for long-term holdings exceeding investment horizon of 6-12 months
- Security Considerations: Enable two-factor authentication, regularly backup private keys, and never share seed phrases with any third parties
V. THE Potential Risks and Challenges
THE Market Risks
- High Volatility: THE has declined 73.03% over the past year, demonstrating significant price volatility that may not be suitable for risk-averse investors
- Liquidity Concerns: With 24-hour trading volume of approximately $140,685, THE may experience increased slippage during large trades
- Competitive Landscape: The DEX sector on BNB Chain faces intense competition from established protocols, which may impact THE's market share and growth trajectory
THE Regulatory Risks
- DeFi Regulatory Uncertainty: Evolving global regulatory frameworks for decentralized finance platforms may impact operational models and user accessibility
- Cross-border Compliance: Multi-jurisdictional operations of decentralized exchanges may face varying regulatory requirements affecting platform functionality
- Leverage Trading Scrutiny: ALPHA's perpetuals offering with up to 60x leverage may attract increased regulatory attention in certain jurisdictions
THE Technical Risks
- Smart Contract Vulnerabilities: Despite audits, DeFi protocols remain exposed to potential exploits or coding errors that could result in loss of funds
- BNB Chain Dependency: THE's infrastructure relies heavily on BNB Chain and opBNB performance, making it vulnerable to network congestion or technical issues
- Integration Complexity: The multi-product ecosystem (THENA, ALPHA, ARENA, WARP) increases technical complexity and potential points of failure
VI. Conclusion and Action Recommendations
THE Investment Value Assessment
THE represents a comprehensive DeFi infrastructure project on BNB Chain with multiple revenue streams including spot DEX, perpetuals trading, and an upcoming launchpad. The project's value proposition centers on its integrated ecosystem approach and competitive leverage offerings. However, investors should carefully weigh the significant volatility evidenced by the 73.03% annual decline and relatively modest market capitalization of approximately $26.5 million. The circulating supply of 122.36 million THE tokens represents approximately 37.52% of fully diluted valuation, indicating substantial future token unlocks that may create selling pressure.
THE Investment Recommendations
✅ Beginners: Consider small allocation (1-2% of crypto portfolio) only after thorough research and understanding of DeFi risks; focus on learning platform functionality before significant investment
✅ Experienced Investors: Evaluate THE as a tactical allocation within broader DeFi exposure; monitor ecosystem developments including WARP launch and ALPHA trading volume growth; consider dollar-cost averaging during market weakness
✅ Institutional Investors: Conduct comprehensive due diligence on smart contract security, team background, and competitive positioning; assess liquidity depth for position sizing; evaluate correlation with broader BNB Chain ecosystem performance
THE Trading Participation Methods
- Spot Trading: Access THE trading pairs on Gate.com with competitive fees and deep liquidity for efficient order execution
- Ecosystem Participation: Engage directly with THENA platform for spot trading, ALPHA for perpetuals, and upcoming WARP launchpad opportunities
- Liquidity Provision: Consider providing liquidity on THENA DEX to earn trading fees and potential rewards, while understanding impermanent loss risks
Cryptocurrency investment carries extremely high risks, and this article does not constitute investment advice. Investors should make prudent decisions based on their own risk tolerance and are advised to consult professional financial advisors. Never invest more than you can afford to lose.
FAQ
What is price prediction? How does it help investment decisions?
Price prediction analyzes historical data, market trends, and trading volume to forecast cryptocurrency price movements. It helps investors identify potential entry and exit points, optimize timing for trades, and make informed decisions based on market analysis and patterns.
What are common price prediction methods? (such as technical analysis, fundamental analysis, etc.)
Common prediction methods include technical analysis (chart patterns, indicators), fundamental analysis (project metrics, tokenomics), on-chain metrics (transaction volume, whale movements), and market sentiment analysis. Combining multiple approaches provides more comprehensive forecasting for THE price trends.
How accurate are price predictions typically? What are the limitations?
Price prediction accuracy varies based on market conditions and analysis methods. Typical accuracy ranges from 60-75% for short-term predictions. Limitations include market volatility, unpredictable events, liquidity fluctuations, and sentiment shifts that affect price movements beyond technical analysis.
Analyze historical price trends, trading volume, market sentiment, and on-chain metrics using technical analysis tools. Monitor key indicators like moving averages, RSI, and MACD. Combine fundamental analysis with real-time data to identify patterns and forecast potential price movements accurately.
What is the difference between short-term and long-term price predictions?
Short-term predictions forecast price movements within days or weeks based on market momentum and volatility, while long-term predictions analyze fundamental trends over months or years. Short-term focuses on technical analysis; long-term considers adoption, technology development, and market maturation.
What are the most common mistakes and pitfalls in price prediction, and how to avoid them?
Common mistakes include over-relying on single indicators, ignoring market sentiment, and chasing past performance. Avoid them by using multiple analysis methods, monitoring real-time trading volume, studying historical patterns, and maintaining disciplined strategy execution without emotional bias.
* The information is not intended to be and does not constitute financial advice or any other recommendation of any sort offered or endorsed by Gate.