This comprehensive analysis examines Tokemak (TOKE) price dynamics from 2026 to 2031, providing investors with data-driven forecasts and strategic guidance. Currently trading at $0.088 with a $7.38M market cap, TOKE faces headwinds from a 79.52% annual decline yet shows infrastructure potential in DeFi liquidity management. The article analyzes supply mechanisms, market adoption drivers, and macroeconomic factors influencing price trajectories, projecting potential growth exceeding 100% by 2031. Professional investment strategies covering long-term holding and active trading on Gate platform are outlined alongside comprehensive risk management frameworks. Suitable for beginners through institutional investors seeking DeFi infrastructure exposure, this guide addresses TOKE's competitive positioning, technical developments, and regulatory considerations for informed decision-making.
Introduction: TOKE's Market Position and Investment Value
Tokemak (TOKE), as a decentralized liquidity protocol designed to generate sustainable liquidity for DeFi and tokenized applications, has been serving the Web3 ecosystem since its launch in 2021. As of 2026, TOKE maintains a market capitalization of approximately $7.38 million, with a circulating supply of about 83.78 million tokens, and a price hovering around $0.088. This asset, recognized as a "tokenized liquidity" solution, is playing an increasingly important role in democratizing liquidity provision and enabling transparent market-making mechanisms across decentralized exchanges.
This article will comprehensively analyze TOKE's price trajectory from 2026 to 2031, combining historical patterns, market supply and demand dynamics, ecosystem developments, and macroeconomic conditions to provide investors with professional price forecasts and practical investment strategies.
I. TOKE Price History Review and Current Market Status
TOKE Historical Price Evolution Trajectory
- 2021: Tokemak launched in August 2021 with an initial price of $2.89, reaching a notable peak of $79.02 in November 2021 during the broader crypto market rally
- 2022-2025: The token experienced significant price corrections alongside the wider DeFi market downturn, declining from its historical high
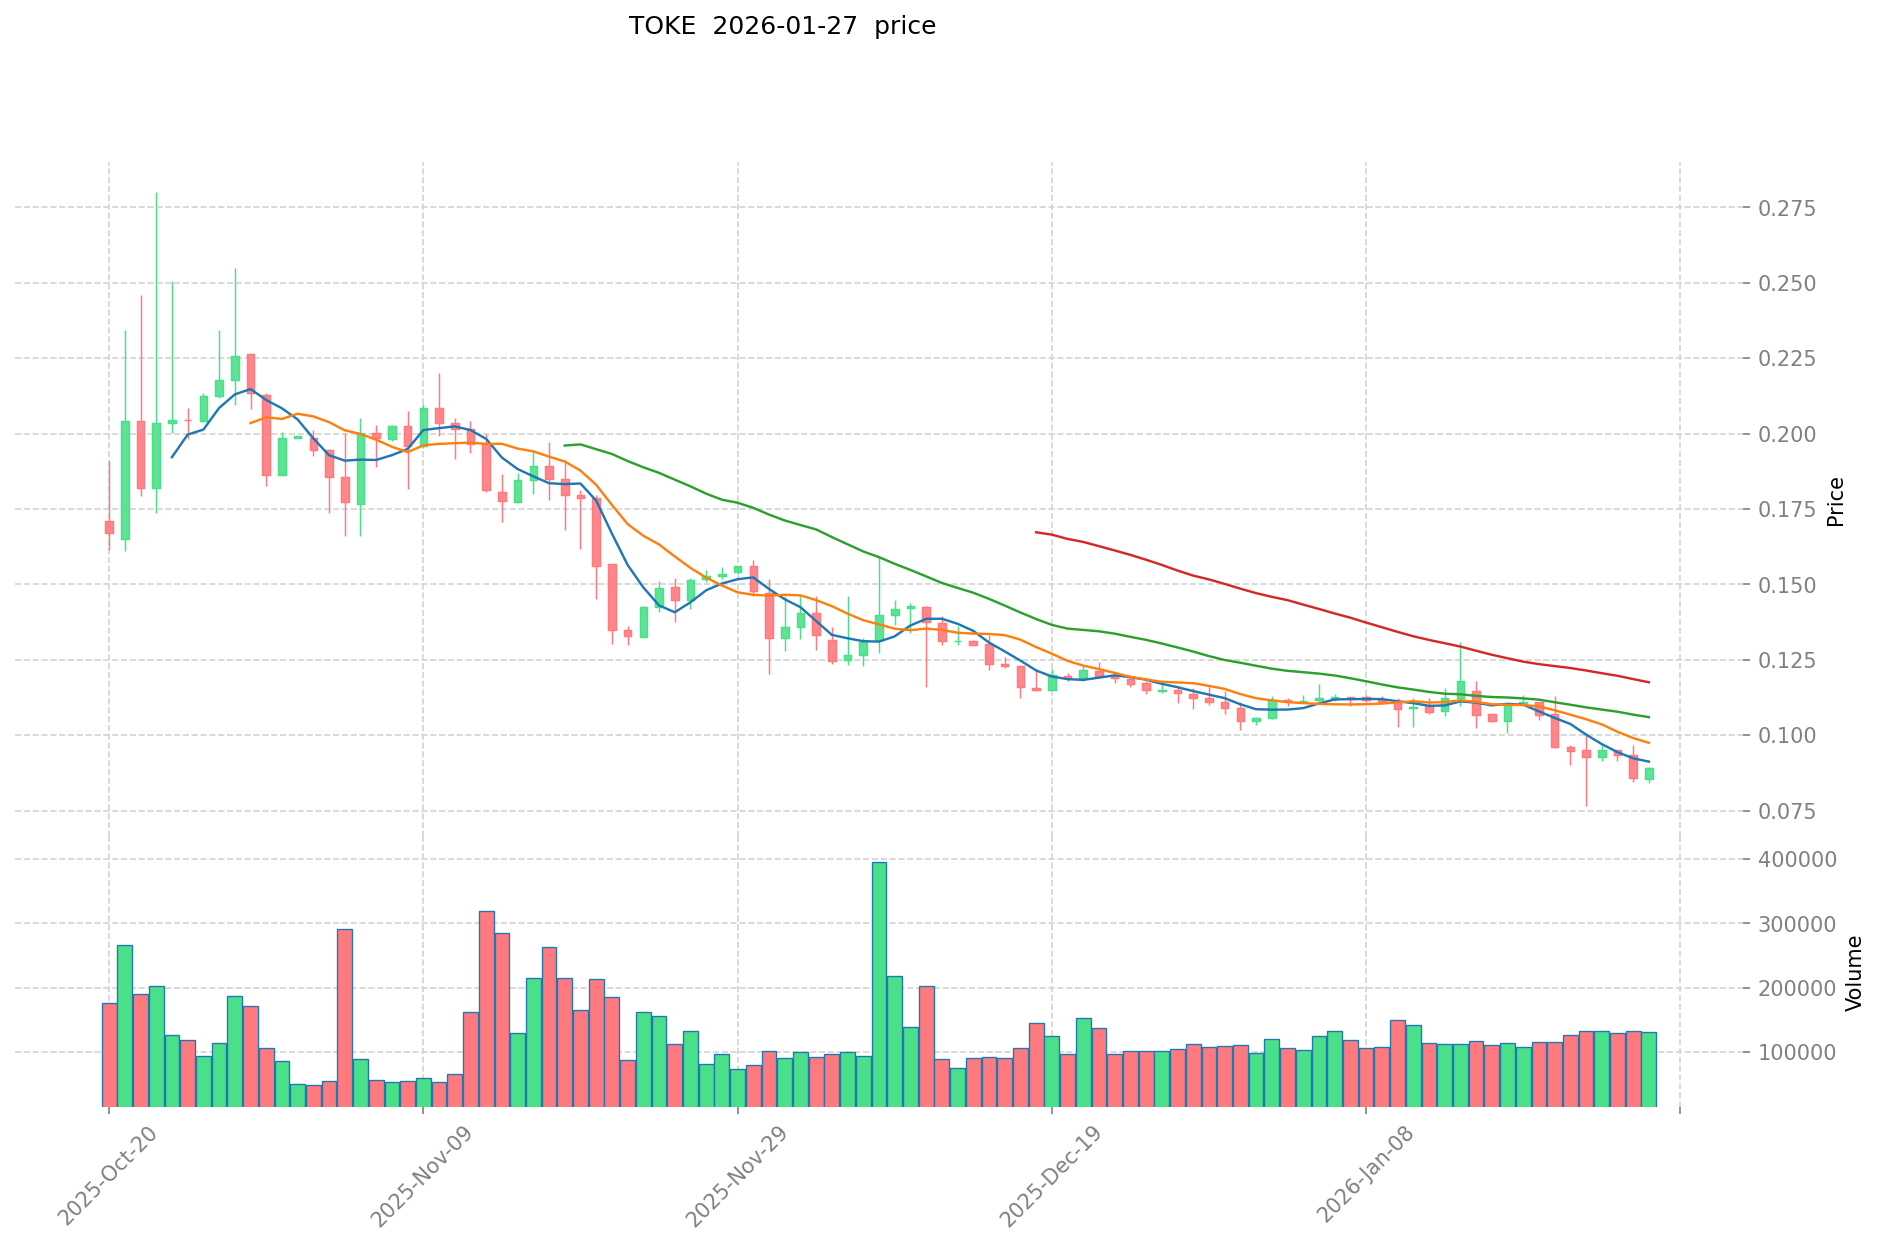
- 2026: As of January 2026, TOKE recorded a new low at $0.0860, reflecting continued downward pressure in the liquidity management sector
TOKE Current Market Situation
As of January 27, 2026, TOKE is trading at $0.08807, representing a 24-hour decline of 0.74%. The token's short-term momentum shows a modest 1-hour increase of 0.44%, with the 24-hour trading range between $0.08692 and $0.08946.
Looking at broader timeframes, TOKE has experienced substantial declines, with a 7-day decrease of 19.86% and a 30-day drop of 20.61%. The annual performance shows a significant decline of 79.52%, indicating sustained selling pressure throughout the past year.
The token maintains a market capitalization of approximately $7.38 million, with a circulating supply of 83.78 million TOKE out of a maximum supply of 100 million tokens. Daily trading volume stands at $11,208, suggesting relatively modest liquidity in current market conditions. With a market dominance of 0.00028%, TOKE occupies the 1347th position in the cryptocurrency market rankings.
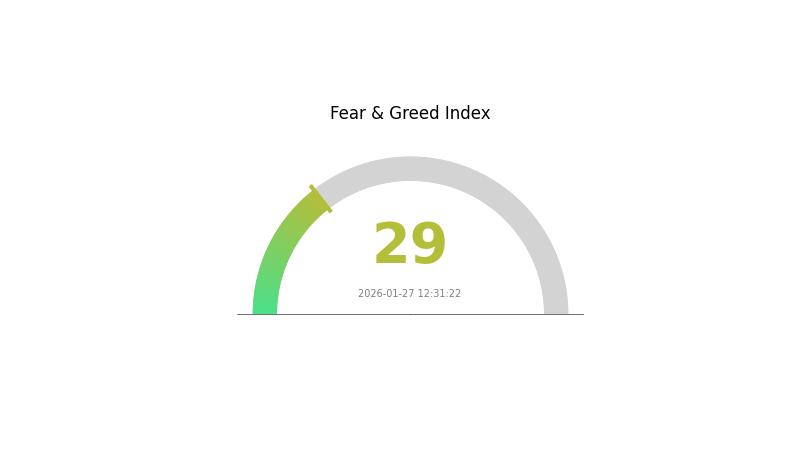
The market capitalization to fully diluted valuation ratio of 83.78% indicates that the majority of TOKE's total supply is already in circulation. The token is currently held by 6,619 addresses and is available for trading on 4 exchanges. Current market sentiment reflects a fear index reading of 29, suggesting cautious investor positioning across the crypto market.
Click to view current TOKE market price
TOKE Market Sentiment Index
2026-01-27 Fear and Greed Index: 29 (Fear)
Click to view current Fear & Greed Index
The cryptocurrency market is currently experiencing significant fear sentiment with an index reading of 29, indicating heightened anxiety among investors. This low reading suggests market participants are cautious and risk-averse. Such fearful conditions often present contrarian opportunities for experienced traders, as extreme fear can precede market reversals. However, investors should exercise caution and conduct thorough research before making trading decisions. Monitor market developments closely and consider dollar-cost averaging strategies during periods of elevated fear to potentially benefit from future recovery phases.
TOKE Token Holding Distribution
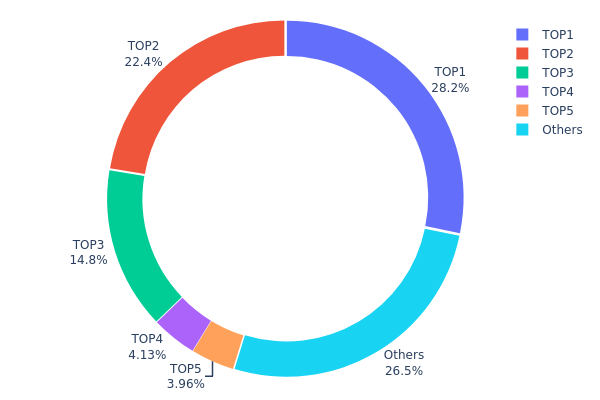
The token holding distribution chart reveals the concentration of TOKE tokens across different wallet addresses, providing crucial insights into the project's decentralization level and potential market manipulation risks. This metric serves as a key indicator for assessing the health of token circulation and the balance of power among holders.
Based on the current data, TOKE exhibits a moderately concentrated holding pattern. The top holder controls 28.24% of the total supply (28,245,550 tokens), while the second-largest address holds 22.38% (22,387,590 tokens). Combined, the top two addresses control over 50% of the circulating supply, which presents a significant centralization concern. The third-ranked address holds 14.78%, bringing the top three holders to approximately 65.4% of total tokens. This concentration level suggests that a relatively small number of entities possess substantial influence over the token's market dynamics.
From a market structure perspective, this distribution pattern introduces elevated volatility risks and potential liquidity challenges. Large holders, commonly referred to as "whales," possess the capability to significantly impact price movements through substantial sell orders or coordinated actions. The remaining 26.52% distributed among other addresses indicates limited retail participation, which could result in reduced trading activity and wider bid-ask spreads during periods of market stress. However, it's worth noting that some of these major addresses may represent legitimate protocol treasuries, liquidity pools, or vesting contracts rather than individual speculators, which would mitigate certain centralization concerns.
Click to view the current TOKE Holding Distribution
| Top |
Address |
Holding Qty |
Holding (%) |
| 1 |
0x96f9...3417d3 |
28245.55K |
28.24% |
| 2 |
0xa374...7c0972 |
22387.59K |
22.38% |
| 3 |
0x8b43...4a969b |
14784.90K |
14.78% |
| 4 |
0xd4e7...647e38 |
4130.32K |
4.13% |
| 5 |
0x1aaf...e2e54c |
3959.90K |
3.95% |
| - |
Others |
26491.74K |
26.52% |
II. Core Factors Influencing TOKE's Future Price Trend
Supply Mechanism
-
Token Distribution and Burning: Token supply mechanisms play a fundamental role in price dynamics. Distribution strategies, including vesting schedules for team members and investors, alongside token burning practices that permanently remove tokens from circulation, directly impact scarcity. Historical patterns show that controlled supply releases and systematic burning can support price appreciation by maintaining supply-demand balance.
-
Historical Pattern: Supply reduction through burning mechanisms has historically contributed to price support across various blockchain projects. When circulating supply decreases while demand remains stable or grows, basic economic principles suggest upward price pressure.
-
Current Impact: The effectiveness of current supply mechanisms depends on transparent implementation and community confidence in the tokenomics design. Market participants closely monitor unlock schedules and burning rates to assess future price trajectories.
Market Demand and Adoption
-
Utility Value: The practical applications and use cases of TOKE within its ecosystem represent a primary value driver. Tokens that provide genuine functionality—such as network access rights, governance participation, or transaction fee discounts—tend to attract sustained demand from users seeking those specific capabilities.
-
Network Effects: Growing user adoption creates positive feedback loops. As more participants join the ecosystem, the token's utility and liquidity typically increase, potentially attracting additional users and investors.
-
Ecosystem Development: The breadth and depth of applications, protocols, and services built around TOKE influence its long-term value proposition. A thriving ecosystem with diverse use cases can support sustained demand.
Macroeconomic Environment
-
Monetary Policy Influence: Global monetary conditions, including interest rate policies by major central banks, affect risk appetite across financial markets. Accommodative monetary policies may increase investor willingness to allocate capital to digital assets, while tightening conditions could dampen speculative demand.
-
Market Sentiment: Broader cryptocurrency market trends and investor sentiment toward digital assets influence price movements. Correlation with major cryptocurrencies and overall market cycles remains a consideration.
-
Regulatory Developments: Evolving regulatory frameworks across jurisdictions impact market confidence and accessibility. Clear regulatory guidance can support institutional participation, while uncertainty may introduce volatility.
Technology Development and Innovation
-
Protocol Upgrades: Technical improvements that enhance scalability, security, or functionality can strengthen the value proposition. Successful implementation of roadmap milestones often correlates with positive market reception.
-
Competitive Positioning: The token's technological advantages or unique features relative to alternatives influence its market position. Innovation in areas such as transaction speed, cost efficiency, or novel applications can differentiate the project.
-
Community Governance: Effective governance mechanisms that enable stakeholder participation in protocol decisions can foster long-term sustainability and alignment between token holders and project development.
III. 2026-2031 TOKE Price Prediction
2026 Outlook
- Conservative Forecast: $0.04844 - $0.08807
- Neutral Forecast: Around $0.08807
- Optimistic Forecast: Up to $0.09512 (requires favorable market conditions and increased adoption)
2027-2029 Outlook
- Market Stage Expectation: The token may enter a gradual growth phase as the DeFi sector continues to evolve and liquidity mining mechanisms gain wider recognition
- Price Range Forecast:
- 2027: $0.05496 - $0.1035
- 2028: $0.08682 - $0.14534
- 2029: $0.08623 - $0.16638
- Key Catalysts: Platform ecosystem expansion, potential protocol upgrades, broader DeFi market recovery, and increased institutional participation in liquidity provision
2030-2031 Long-term Outlook
- Baseline Scenario: $0.1065 - $0.21011 (assuming steady protocol development and moderate market growth)
- Optimistic Scenario: $0.14391 - $0.24251 (contingent on significant ecosystem expansion and enhanced utility)
- Transformational Scenario: Potential to reach $0.24251 or higher (under extremely favorable conditions including mass DeFi adoption and strategic partnerships)
- 2026-01-27: TOKE shows potential for long-term appreciation with projected growth exceeding 100% by 2031 compared to 2026 baseline levels
| Year |
Predicted High Price |
Predicted Average Price |
Predicted Low Price |
Price Change |
| 2026 |
0.09512 |
0.08807 |
0.04844 |
0 |
| 2027 |
0.1035 |
0.09159 |
0.05496 |
4 |
| 2028 |
0.14534 |
0.09755 |
0.08682 |
10 |
| 2029 |
0.16638 |
0.12145 |
0.08623 |
37 |
| 2030 |
0.21011 |
0.14391 |
0.1065 |
63 |
| 2031 |
0.24251 |
0.17701 |
0.14869 |
100 |
IV. TOKE Professional Investment Strategy and Risk Management
TOKE Investment Methodology
(I) Long-term Holding Strategy
- Suitable for: Investors focused on DeFi infrastructure development and liquidity protocol evolution
- Operational Recommendations:
- Monitor Tokemak's protocol updates and liquidity reactor performance metrics
- Evaluate the protocol's ability to maintain competitive liquidity provisioning capabilities
- Storage Solution: Use Gate Web3 Wallet for secure asset custody with multi-signature protection
(II) Active Trading Strategy
- Technical Analysis Tools:
- Volume Analysis: Monitor 24-hour trading volume ($11,208.34) relative to market cap to assess liquidity depth
- Price Action Analysis: Track key support levels near recent lows and resistance at short-term highs
- Swing Trading Points:
- Consider market volatility with recent 7-day decline of 19.86%
- Evaluate entry points during periods of stabilization following significant price movements
TOKE Risk Management Framework
(I) Asset Allocation Principles
- Conservative Investors: 1-2% of crypto portfolio allocation
- Aggressive Investors: 3-5% of crypto portfolio allocation
- Professional Investors: 5-10% of crypto portfolio allocation based on risk tolerance and market conditions
(II) Risk Hedging Solutions
- Diversification: Balance TOKE holdings with other DeFi protocol tokens to reduce concentration risk
- Position Sizing: Implement gradual position building to mitigate entry timing risk
(III) Secure Storage Solutions
- Hot Wallet Recommendation: Gate Web3 Wallet for active trading and liquidity management
- Cold Storage Solution: Hardware wallet storage for long-term holdings exceeding short-term trading needs
- Security Considerations: Enable two-factor authentication, regularly verify contract addresses (0x2e9d63788249371f1DFC918a52f8d799F4a38C94), and avoid sharing private keys
V. TOKE Potential Risks and Challenges
TOKE Market Risks
- Price Volatility: Recent performance shows 79.52% decline over one year, indicating substantial market volatility
- Limited Liquidity: Trading volume of $11,208.34 may present challenges for larger position entries and exits
- Market Share: Currently represents 0.00028% of total cryptocurrency market capitalization
TOKE Regulatory Risks
- DeFi Protocol Oversight: Evolving regulatory frameworks for decentralized liquidity protocols may impact operations
- Liquidity Provision Regulations: Potential regulatory scrutiny of automated market-making mechanisms
- Compliance Requirements: Changes in jurisdictional requirements for liquidity protocols could affect protocol functionality
TOKE Technical Risks
- Smart Contract Vulnerabilities: Inherent risks associated with protocol smart contracts and token reactor mechanisms
- Protocol Dependency: Reliance on integration with multiple DEX platforms for liquidity distribution
- Network Congestion: Ethereum-based token may experience transaction delays or increased costs during network congestion
VI. Conclusion and Action Recommendations
TOKE Investment Value Assessment
Tokemak represents a specialized liquidity infrastructure protocol designed to democratize and optimize liquidity provision across DeFi. With a circulating supply of 83.78% of total supply and positioning as a liquidity management solution, the protocol addresses specific market needs in decentralized finance. However, current market performance reflects significant challenges, including substantial price decline over the past year and limited trading volume. The protocol's long-term value proposition depends on its ability to maintain relevance in an evolving DeFi landscape and demonstrate sustainable liquidity management capabilities.
TOKE Investment Recommendations
✅ Beginners: Consider observing protocol development and market stability before entering positions; start with minimal allocation (under 1%) if participating
✅ Experienced Investors: Evaluate protocol metrics, liquidity reactor performance, and competitive positioning; consider small-to-moderate positions (2-5%) as part of diversified DeFi portfolio
✅ Institutional Investors: Conduct comprehensive due diligence on protocol architecture, governance mechanisms, and liquidity sustainability; assess strategic fit within broader DeFi infrastructure investments
TOKE Trading Participation Methods
- Spot Trading: Direct purchase and holding through Gate.com for long-term investment positioning
- Liquidity Provision: Participate in Tokemak's token reactor system to earn protocol incentives while supporting liquidity management
- Portfolio Integration: Include TOKE as part of diversified DeFi infrastructure allocation alongside other liquidity and protocol governance tokens
Cryptocurrency investment carries extreme risk, and this article does not constitute investment advice. Investors should make prudent decisions based on their own risk tolerance and are advised to consult professional financial advisors. Never invest more than you can afford to lose.
FAQ
What is TOKE token and what is its purpose?
TOKE is the native token of Tokemak protocol, designed to provide sustainable liquidity solutions for DeFi. It incentivizes liquidity providers and enables decentralized liquidity management across Web3 platforms.
What are the main factors influencing TOKE price predictions?
TOKE price is primarily influenced by supply and demand dynamics, market sentiment driven by news and investor confidence, trading volume, technological developments, and regulatory changes such as policy updates and institutional adoption.
How to conduct technical analysis and price prediction for TOKE?
Analyze TOKE using technical indicators like moving averages, RSI, and MACD. Monitor trading volume and price trends. Study resistance and support levels. Combined with market sentiment analysis, these tools help forecast price movements and identify trading opportunities.
What are the risks to pay attention to when investing in TOKE?
TOKE investment carries regulatory and legal risks, platform and technology risks, as well as liquidity and price volatility risks. Investors should conduct thorough research before participating.
TOKE has declined approximately 15.90% over the past year. While the broader crypto market fell 6.30%, TOKE underperformed relative to comparable tokens, showing weaker market momentum.
What are professional analysts' price predictions for TOKE?
Professional analysts predict TOKE will experience significant growth driven by generative AI adoption. With token usage surging and network demand increasing substantially, TOKE is positioned for long-term appreciation as AI integration accelerates across the industry.
* The information is not intended to be and does not constitute financial advice or any other recommendation of any sort offered or endorsed by Gate.