This comprehensive guide examines TokenFi (TOKEN) market dynamics from 2026-2031, analyzing historical price movements and investment opportunities in the tokenization sector. TOKEN, currently trading at $0.003992, has experienced significant volatility while maintaining presence across 22 exchanges including Gate. The article covers detailed price forecasts, ranging from conservative to optimistic scenarios, while evaluating core market factors including token distribution, liquidity metrics, and adoption trends. Investors gain actionable strategies encompassing long-term holding and active trading approaches, alongside robust risk management frameworks. Essential sections address market risks, regulatory uncertainties, and technical challenges specific to the tokenization infrastructure space. The analysis combines on-chain data, market sentiment indicators, and professional investment methodologies to equip readers with informed decision-making tools for cryptocurrency portfolio allocation and risk mitigat
Introduction: TOKEN's Market Position and Investment Value
TokenFi (TOKEN), as a pioneering all-in-one tokenization platform, has been facilitating asset tokenization since its launch in 2023. As of 2026, TokenFi has achieved a market capitalization of approximately $13.47 million, with a circulating supply of around 3.375 billion tokens, and the price maintains at approximately $0.003992. This platform, targeting the tokenization industry projected to reach $16 trillion by 2030, is playing an increasingly important role in enabling users to launch tokens or tokenize assets without writing code through its simple WYSIWYG interface.
This article will comprehensively analyze TOKEN's price trends from 2026 to 2031, combining historical patterns, market supply and demand dynamics, ecosystem development, and macroeconomic environment factors to provide investors with professional price forecasts and practical investment strategies.
I. TOKEN Price History Review and Market Status
TOKEN Historical Price Evolution Trajectory
- 2024: Reached price peak in March, TOKEN hit $0.24646 on March 26, marking a significant milestone in its trading history
- 2025: Experienced substantial price correction throughout the year, TOKEN declined approximately 89.46% from its previous high, reflecting broader market adjustments
- Late 2025: Price reached its lowest point at $0.002316 on December 24, representing a critical support level during the market downturn
TOKEN Current Market Situation
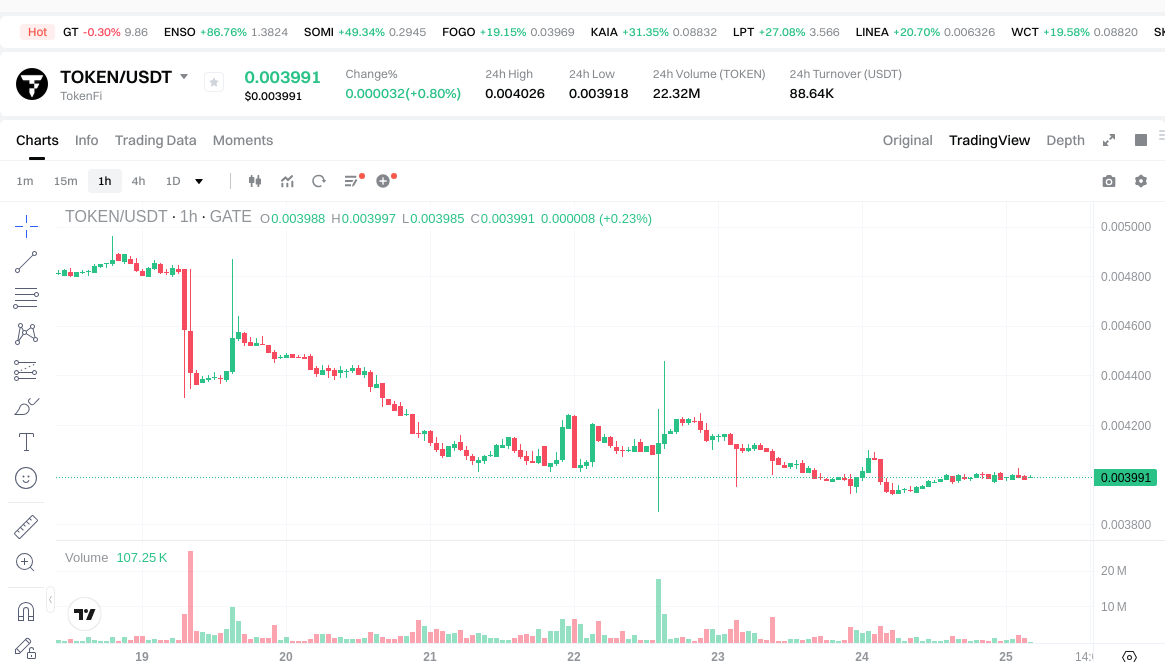
As of January 25, 2026, TOKEN is trading at $0.003992, showing a modest 24-hour price change of 0.4%. The current price represents a 72.4% increase from its recent low in December 2025, indicating some recovery momentum. However, TOKEN remains significantly below its all-time high, trading approximately 98.4% lower than the March 2024 peak.
The trading activity shows relatively modest volume with $89,618.76 recorded in the past 24 hours. TOKEN's market capitalization stands at approximately $13.47 million, with a fully diluted market cap of $39.92 million. The circulating supply represents 33.75% of the maximum supply of 10 billion tokens, with 3.375 billion TOKEN currently in circulation.
The token maintains a presence across 22 exchanges and has attracted approximately 31,040 holders. Recent price action shows TOKEN trading within a 24-hour range of $0.003918 to $0.004026. The 7-day performance indicates a decline of 19.08%, while the 30-day trend shows a positive movement of 67.32%, suggesting mixed short-term and medium-term momentum.
TokenFi's market share remains at 0.0012% of the total cryptocurrency market capitalization. The current market environment reflects cautious sentiment, with broader crypto market indicators showing extreme fear conditions.
Click to view current TOKEN market price
TOKEN Market Sentiment Indicator
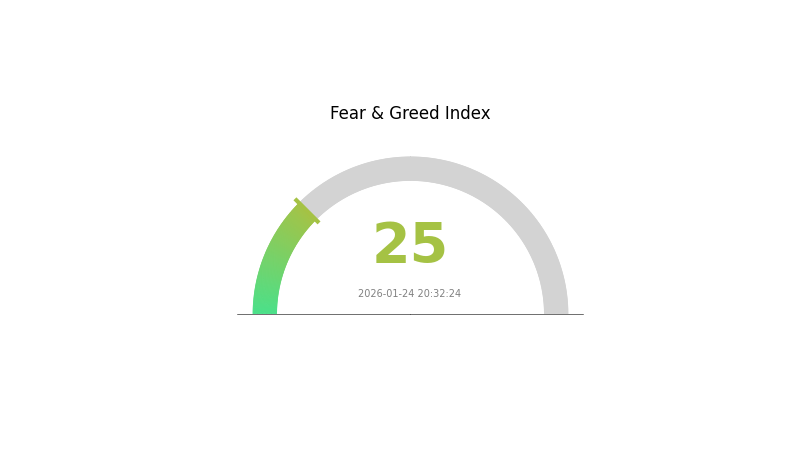
2026-01-24 Fear and Greed Index: 25 (Extreme Fear)
Click to view current Fear & Greed Index
The cryptocurrency market is currently experiencing extreme fear sentiment, with the index dropping to 25. This indicates significant market pessimism and heightened investor anxiety. During extreme fear conditions, market participants often become overly cautious, leading to potential selling pressure and price volatility. However, such extreme sentiment readings historically present contrarian opportunities for patient investors who believe in long-term market fundamentals. Monitoring this index can help traders make more informed decisions during periods of market stress.
TOKEN Holdings Distribution
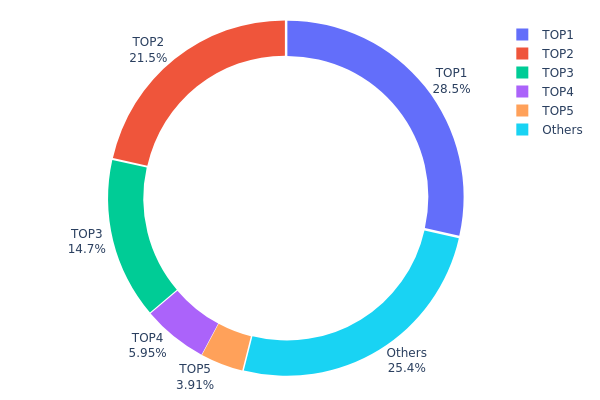
The holdings distribution chart reveals the allocation of TOKEN across different wallet addresses, serving as a critical indicator of token concentration and decentralization levels. According to the current on-chain data, the top 5 addresses collectively hold approximately 74.58% of the total supply, with the largest holder controlling 28.53% (1,426,760.98K tokens), followed by the second-largest at 21.49% (1,074,642.31K tokens). This concentration pattern suggests a relatively centralized distribution structure, where a small number of addresses maintain substantial control over the circulating supply.
Such high concentration levels present notable implications for market dynamics and price stability. The dominance of top holders increases the potential for significant price volatility, as large-scale transactions from these addresses could trigger substantial market movements. Additionally, this distribution pattern may expose the token to heightened manipulation risks, where coordinated actions by major holders could influence price discovery mechanisms. The "Others" category, representing addresses outside the top 5, accounts for only 25.42% of the supply, further emphasizing the weight carried by major stakeholders in the TOKEN ecosystem.
From a structural perspective, the current holdings distribution reflects a market architecture with limited decentralization, which may impact long-term governance participation and community-driven development. While concentration does not inherently indicate malicious intent, it does suggest that TOKEN's price action and protocol decisions remain susceptible to the preferences and strategies of a select group of large holders. Monitoring changes in this distribution pattern over time will be essential for assessing the project's evolution toward broader token dispersion and enhanced on-chain structural stability.
Click to view current TOKEN Holdings Distribution
| Top |
Address |
Holding Qty |
Holding (%) |
| 1 |
0xb8d2...f4ee43 |
1426760.98K |
28.53% |
| 2 |
0x2b9d...d60ab0 |
1074642.31K |
21.49% |
| 3 |
0x1e78...2f7ecd |
735760.56K |
14.71% |
| 4 |
0x6522...837e90 |
297448.60K |
5.94% |
| 5 |
0xc7e6...c691c6 |
195501.23K |
3.91% |
| - |
Others |
1269886.32K |
25.42% |
II. Core Factors Affecting TOKEN's Future Price
Based on the current available information, there is insufficient data to comprehensively analyze the core factors that may influence TOKEN's future price movements. The analysis requires detailed information across multiple dimensions including supply mechanisms, institutional dynamics, macroeconomic conditions, and technological developments.
For a thorough assessment of TOKEN's price outlook, the following information would be essential:
- Detailed supply mechanism data and historical patterns
- Institutional holding positions and corporate adoption trends
- Relevant policy frameworks and regulatory developments
- Technical upgrades and ecosystem expansion plans
- Macroeconomic correlations and market behavior patterns
Investors and analysts should conduct independent research and gather comprehensive data before making any investment decisions regarding TOKEN.
III. 2026-2031 TOKEN Price Forecast
2026 Outlook
- Conservative Forecast: $0.00227 - $0.00300
- Neutral Forecast: $0.00300 - $0.00399
- Optimistic Forecast: $0.00399 - $0.00415 (requires favorable market conditions and increased adoption)
2027-2029 Outlook
- Market Stage Expectation: The token is anticipated to enter a gradual growth phase, with price movements reflecting broader market sentiment and potential ecosystem developments.
- Price Range Forecast:
- 2027: $0.00240 - $0.00472
- 2028: $0.00286 - $0.00620
- 2029: $0.00413 - $0.00773
- Key Catalysts: Enhanced utility adoption, strategic partnerships, and overall cryptocurrency market recovery could serve as primary drivers for price appreciation during this period.
2030-2031 Long-term Outlook
- Baseline Scenario: $0.00456 - $0.00652 (assuming steady ecosystem growth and stable market conditions)
- Optimistic Scenario: $0.00652 - $0.00743 (contingent upon significant platform upgrades and expanded use cases)
- Transformative Scenario: $0.00743 - $0.00795 (requiring exceptional market conditions, mainstream adoption, and favorable regulatory developments)
- 2025-01-25: TOKEN shows relatively stable positioning with projected average prices indicating potential appreciation of up to 74% by 2031 compared to 2026 baseline levels
| Year |
Predicted High Price |
Predicted Average Price |
Predicted Low Price |
Price Change |
| 2026 |
0.00415 |
0.00399 |
0.00227 |
0 |
| 2027 |
0.00472 |
0.00407 |
0.0024 |
1 |
| 2028 |
0.0062 |
0.0044 |
0.00286 |
10 |
| 2029 |
0.00773 |
0.0053 |
0.00413 |
32 |
| 2030 |
0.00743 |
0.00652 |
0.00456 |
63 |
| 2031 |
0.00795 |
0.00697 |
0.00516 |
74 |
IV. TOKEN Professional Investment Strategies and Risk Management
TOKEN Investment Methodology
(1) Long-term Holding Strategy
- Suitable for: Investors seeking exposure to the tokenization industry with a multi-year investment horizon
- Operational Recommendations:
- Consider allocating a small portion of portfolio (typically 1-3%) to TOKEN given its high volatility and early-stage market position
- Monitor the development progress of TokenFi's platform and adoption metrics in the tokenization sector
- Store assets in secure wallets such as Gate Web3 Wallet with proper backup and recovery procedures
(2) Active Trading Strategy
- Technical Analysis Tools:
- Volume Analysis: TOKEN's 24-hour trading volume of approximately $89,618 indicates moderate liquidity; monitor volume spikes as potential trend indicators
- Moving Averages: Use 7-day and 30-day moving averages to identify trend reversals, noting the recent 19.08% decline over 7 days versus 67.32% gain over 30 days
- Swing Trading Considerations:
- Set stop-loss orders to manage downside risk given TOKEN's 89.46% decline over the past year
- Consider the 24-hour price range ($0.003918-$0.004026) when planning entry and exit points
TOKEN Risk Management Framework
(1) Asset Allocation Principles
- Conservative Investors: 0.5-1% of total portfolio
- Moderate Investors: 1-2% of total portfolio
- Aggressive Investors: 2-5% of total portfolio
(2) Risk Hedging Approaches
- Position Sizing: Limit TOKEN exposure to amounts you can afford to lose completely given the asset's volatility
- Portfolio Diversification: Balance TOKEN holdings with established cryptocurrencies and traditional assets
(3) Secure Storage Solutions
- Software Wallet Recommendation: Gate Web3 Wallet offers multi-chain support for both ETH and BSC networks where TOKEN operates
- Hardware Wallet Option: Consider cold storage solutions for long-term holdings exceeding personal risk thresholds
- Security Precautions: Never share private keys, verify contract addresses (0x4507cef57c46789ef8d1a19ea45f4216bae2b528), and be vigilant against phishing attempts
V. TOKEN Potential Risks and Challenges
TOKEN Market Risks
- Extreme Volatility: TOKEN experienced an 89.46% decline from its all-time high of $0.24646 (March 2024) to current levels, demonstrating substantial price instability
- Low Market Capitalization: With a market cap of approximately $13.47 million and ranking #1061, TOKEN has limited liquidity and higher susceptibility to price manipulation
- Limited Circulation: Only 33.75% of total supply is currently circulating, creating potential selling pressure if additional tokens enter the market
TOKEN Regulatory Risks
- Tokenization Industry Uncertainty: The regulatory framework for tokenizing real-world assets remains unclear in many jurisdictions, potentially affecting TokenFi's business model
- Securities Classification: Depending on how tokenized assets are structured, they may face varying regulatory treatments across different countries
- Compliance Requirements: Evolving regulations around token issuance and asset tokenization could impact TokenFi's platform operations and user adoption
TOKEN Technical Risks
- Smart Contract Vulnerabilities: TOKEN operates on multiple chains (ETH and BSC), requiring secure smart contract implementations to prevent exploits
- Platform Development Risk: TokenFi's success depends on successfully delivering its no-code tokenization platform and achieving user adoption
- Competitive Pressure: The tokenization space may attract numerous competitors, potentially diluting TOKEN's market position and value proposition
VI. Conclusion and Action Recommendations
TOKEN Investment Value Assessment
TOKEN presents a speculative opportunity in the emerging tokenization sector, which industry projections suggest could reach significant scale by 2030. However, the token's performance history shows considerable volatility, with substantial declines from peak values despite recent 30-day recovery. The project's positioning in the tokenization infrastructure space offers potential long-term upside if the platform achieves meaningful adoption, but the current low market capitalization and limited circulation present elevated risks typical of early-stage cryptocurrency projects.
TOKEN Investment Recommendations
✅ Beginners: Consider gaining experience with more established cryptocurrencies before allocating to TOKEN; if interested, limit exposure to less than 1% of investable capital and prioritize learning about tokenization technology
✅ Experienced Investors: TOKEN may serve as a small speculative allocation (1-3% of crypto portfolio) for those with specific interest in tokenization infrastructure; maintain strict stop-loss discipline and monitor platform development milestones
✅ Institutional Investors: Conduct thorough due diligence on TokenFi's platform development, team credentials, and competitive positioning within the tokenization ecosystem before considering allocation; evaluate TOKEN within broader digital asset infrastructure investment thesis
TOKEN Trading Participation Methods
- Spot Trading: Purchase TOKEN directly on Gate.com and other supporting exchanges with availability on 22 trading platforms
- Dollar-Cost Averaging: Consider periodic small purchases to build position over time, reducing timing risk given TOKEN's volatility patterns
- Portfolio Monitoring: Regularly review TOKEN's development updates, holder count (currently 31,040), and trading volume trends to inform position adjustments
Cryptocurrency investment carries extreme risk, and this article does not constitute investment advice. Investors should make cautious decisions based on their own risk tolerance and are advised to consult professional financial advisors. Never invest more than you can afford to lose.
FAQ
What are the main methods and tools for TOKEN price prediction?
Main methods include technical analysis(K-line patterns, moving averages, RSI), fundamental analysis(project metrics, transaction volume), on-chain data monitoring, sentiment analysis, and AI prediction models. Key tools: charting platforms, blockchain explorers, data analytics dashboards, and machine learning algorithms for trend forecasting.
How are technical analysis and fundamental analysis applied in TOKEN price prediction?
Technical analysis examines price charts, trading volume, and market trends to identify patterns. Fundamental analysis evaluates project tokenomics, adoption metrics, and ecosystem developments. Combined, they provide comprehensive price forecasting by analyzing both market sentiment and underlying value drivers.
What are the key factors affecting TOKEN price?
TOKEN price is primarily driven by market demand and supply dynamics, overall trading volume, Bitcoin market trends, project development progress, regulatory announcements, macroeconomic conditions, and community sentiment. Positive ecosystem updates and institutional adoption typically support price appreciation.
What is the typical accuracy rate of TOKEN price predictions? What risks exist?
Price prediction accuracy varies from 60-75% depending on market conditions and analysis methods. Risks include market volatility, unexpected news events, and trading volume fluctuations. Success requires combining technical analysis with market sentiment assessment.
How to assess the credibility and source of TOKEN price predictions?
Evaluate predictions by checking analyst track records, data sources, and methodology transparency. Prioritize predictions backed by on-chain metrics, trading volume analysis, and fundamental research. Cross-reference multiple reputable sources and assess historical prediction accuracy before considering any forecast.
What is the difference between short-term and long-term TOKEN price predictions?
Short-term predictions focus on price movements within days or weeks, analyzing market volatility and trading volume. Long-term predictions assess fundamental value over months or years, considering project development and adoption trends.
* The information is not intended to be and does not constitute financial advice or any other recommendation of any sort offered or endorsed by Gate.