This comprehensive analysis examines TokenFi (TOKEN), an all-in-one tokenization platform currently trading at $0.00396 with a $13.35 million market cap. The article provides professional TOKEN price analysis spanning 2026-2031, combining historical volatility patterns, current market metrics, and supply-demand dynamics. TOKEN holders access detailed price ranges across three scenarios, from conservative to optimistic outlooks, supported by on-chain data revealing 74.81% concentration among top five addresses. The guide offers practical investment methodologies including dollar-cost averaging and active trading strategies, with specific risk management frameworks for conservative, moderate, and aggressive investors. Readers gain insights into TOKEN's ecosystem development potential, regulatory considerations, and secure storage solutions via Gate Web3 Wallet. Essential for investors seeking tokenization sector exposure, this analysis covers market sentiment indicators, technical trading levels, and comprehens
Introduction: TOKEN's Market Position and Investment Value
TokenFi (TOKEN), positioned as an all-in-one tokenization platform targeting the rapidly expanding tokenization industry, has established its presence in the crypto ecosystem since its launch in 2023. As of 2026, TOKEN maintains a market capitalization of approximately $13.35 million, with a circulating supply of around 3.38 billion tokens, and the price holding at approximately $0.00396. This asset, designed to democratize token creation through its no-code WYSIWYG interface, is playing an increasingly important role in making blockchain tokenization accessible to non-technical users.
This article will comprehensively analyze TOKEN's price trajectory from 2026 to 2031, combining historical patterns, market supply-demand dynamics, ecosystem development, and macroeconomic conditions to provide investors with professional price forecasts and practical investment strategies.
I. TOKEN Price History Review and Market Status
TOKEN Historical Price Evolution Trajectory
- 2024: TOKEN experienced significant volatility, reaching a peak of $0.24646 on March 26, 2024, representing a period of market enthusiasm
- 2024-2025: The token entered a sustained downward trend, with price declining from its historical high
- 2025: TOKEN reached its historical low of $0.002316 on December 24, 2025, marking a significant market correction period
- Recent Period: The token has shown signs of recovery, with a 30-day price increase of 70.16%
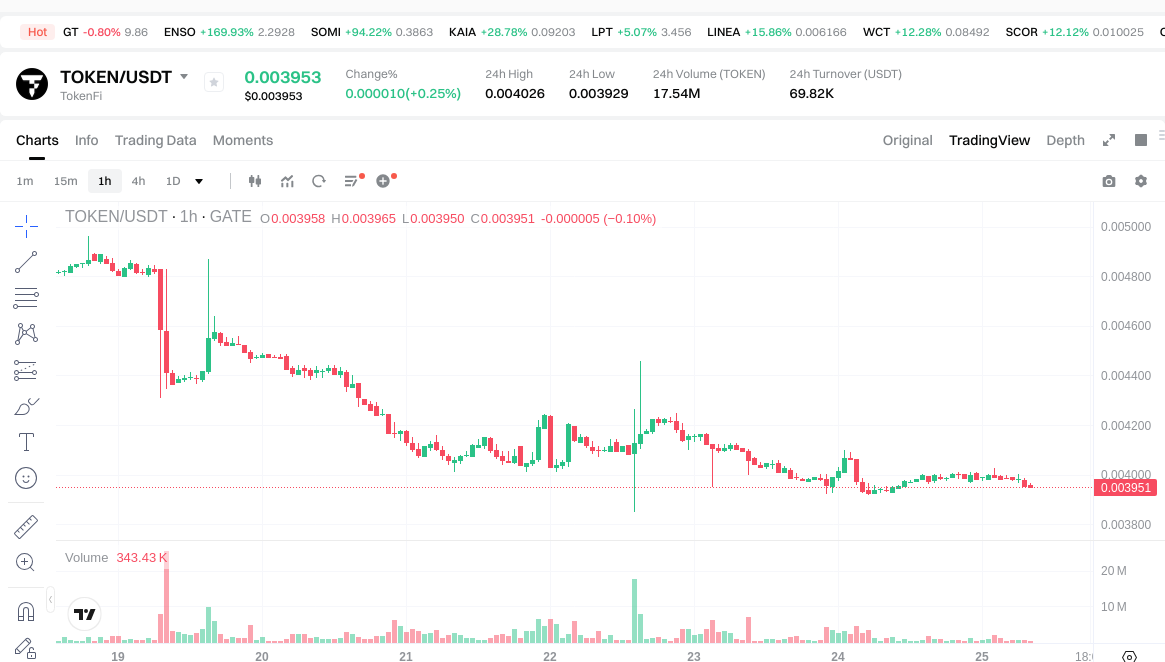
TOKEN Current Market Situation
As of January 25, 2026, TOKEN is trading at $0.003956, showing a 24-hour price change of 0.4%. The token's 24-hour trading volume stands at $69,828.07, with intraday price fluctuations ranging between $0.003929 and $0.004026.
The current market capitalization is approximately $13.35 million, with a circulating supply of 3.38 billion tokens, representing 33.75% of the total supply of 10 billion tokens. The fully diluted market cap is calculated at $39.56 million. TOKEN's market share accounts for 0.0012% of the total cryptocurrency market.
Recent price performance shows mixed signals across different timeframes. The token has experienced a 0.4% decline over the past hour and a 19.13% decrease over the past 7 days. However, the 30-day performance shows a notable recovery of 70.16%, though the 1-year performance remains down by 88.92% from previous levels.
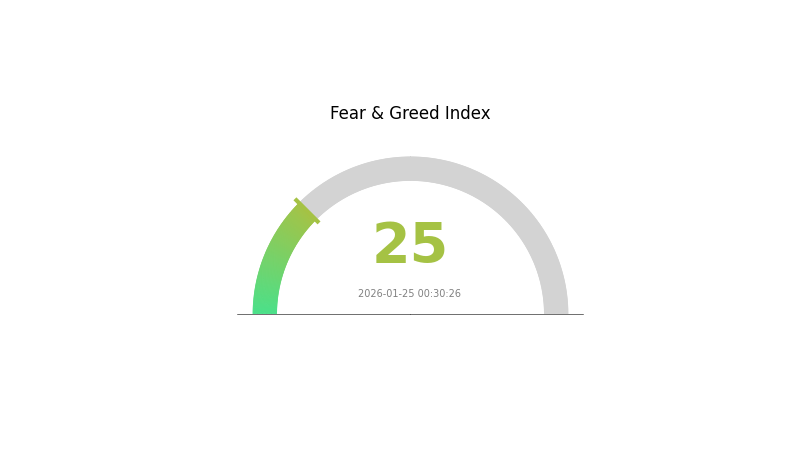
The current market emotion index stands at 25, indicating an "Extreme Fear" sentiment in the broader crypto market, which may be influencing TOKEN's trading dynamics. The token is actively traded on 21 exchanges and has a holder base of 31,040 addresses.
TOKEN operates on multiple blockchain networks, with contract addresses deployed on both BSC and ETH chains. The token was initially published on October 26, 2023, and is available for trading on Gate.com.
Click to view current TOKEN market price
TOKEN Market Sentiment Indicator
2026-01-25 Fear and Greed Index: 25 (Extreme Fear)
Click to view current Fear & Greed Index
The cryptocurrency market is currently experiencing extreme fear, with the Fear and Greed Index at 25. This indicates significant market pessimism and heightened investor anxiety. When sentiment reaches such extreme lows, it often presents opportunities for contrarian investors who believe in the market's long-term potential. However, extreme fear also suggests elevated volatility and risk. Investors should exercise caution, conduct thorough research, and consider dollar-cost averaging strategies during such periods. Market conditions can shift rapidly, so staying informed and maintaining a disciplined investment approach is crucial during times of extreme fear.
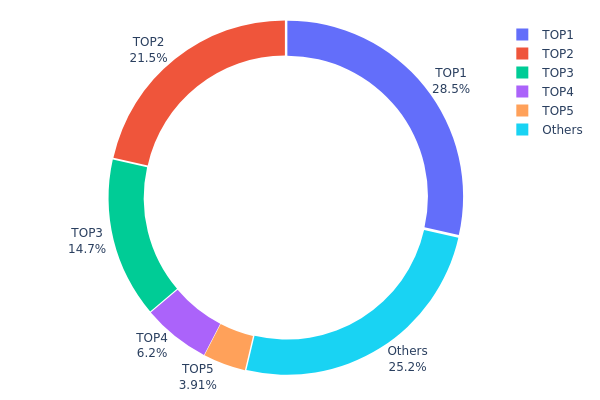
TOKEN Holdings Distribution
The holdings distribution chart illustrates the allocation of TOKEN tokens across different wallet addresses, revealing the degree of decentralization and concentration risk within the token ecosystem. Based on current on-chain data, the top five addresses collectively hold approximately 74.81% of the total token supply, indicating a notably high concentration level. Specifically, the largest holder controls 28.53% of tokens (1,426,700.51K), while the second and third largest addresses hold 21.49% and 14.69% respectively. This concentration pattern suggests that a relatively small number of entities maintain significant control over TOKEN's circulating supply.
Such pronounced concentration presents considerable implications for market stability and price dynamics. When a substantial portion of tokens is concentrated among few addresses, the market becomes susceptible to increased volatility and potential manipulation risks. Large holders possess the capacity to influence price movements through substantial buy or sell orders, potentially creating liquidity challenges during periods of heightened trading activity. The "Others" category, representing only 25.19% of total supply distributed among remaining addresses, indicates limited token distribution breadth across the broader community.
From a market structure perspective, this distribution pattern reflects relatively weak decentralization characteristics. The high concentration ratio suggests TOKEN's on-chain governance and price discovery mechanisms may be vulnerable to decisions by major holders. While concentrated holdings are not inherently negative and may indicate strong conviction from early investors or project treasury allocations, they warrant careful monitoring by market participants. Investors should remain aware that significant token movements by top addresses could trigger substantial price fluctuations and impact overall market sentiment.
Click to view current TOKEN Holdings Distribution
| Top |
Address |
Holding Qty |
Holding (%) |
| 1 |
0xb8d2...f4ee43 |
1426700.51K |
28.53% |
| 2 |
0x2b9d...d60ab0 |
1074642.31K |
21.49% |
| 3 |
0x1e78...2f7ecd |
734636.93K |
14.69% |
| 4 |
0x6522...837e90 |
310098.16K |
6.20% |
| 5 |
0xc7e6...c691c6 |
195483.26K |
3.90% |
| - |
Others |
1258438.83K |
25.19% |
II. Core Factors Influencing TOKEN's Future Price
Based on the currently available information, we are unable to provide a comprehensive analysis of the supply mechanism, institutional dynamics, macroeconomic environment, or technical developments that may influence TOKEN's future price. A thorough evaluation would require access to specific data regarding tokenomics, institutional holdings, adoption metrics, and ongoing technical upgrades.
Investors should conduct independent research and consult multiple sources before making investment decisions regarding TOKEN.
III. 2026-2031 TOKEN Price Prediction
2026 Outlook
- Conservative prediction: $0.00277 - $0.00340
- Neutral prediction: $0.00340 - $0.00395
- Optimistic prediction: $0.00395 - $0.00407 (requires favorable market conditions and increased adoption)
2027-2029 Outlook
- Market stage expectation: The token may enter a gradual growth phase as the broader crypto market matures and project fundamentals strengthen
- Price range predictions:
- 2027: $0.00329 - $0.00465
- 2028: $0.00264 - $0.00585
- 2029: $0.00458 - $0.00748
- Key catalysts: Potential ecosystem development, partnerships expansion, technological upgrades, and overall cryptocurrency market recovery could serve as primary drivers for price appreciation
2030-2031 Long-term Outlook
- Baseline scenario: $0.00440 - $0.00628 (assuming steady market growth and project development)
- Optimistic scenario: $0.00628 - $0.00823 (with accelerated adoption and favorable regulatory environment)
- Transformative scenario: $0.00704 - $0.01038 (under extremely favorable conditions including mainstream adoption and significant technological breakthroughs)
- 2026-01-25: TOKEN trading within predicted range, with average price expectations around $0.00395
| Year |
Predicted High Price |
Predicted Average Price |
Predicted Low Price |
Price Change |
| 2026 |
0.00407 |
0.00395 |
0.00277 |
0 |
| 2027 |
0.00465 |
0.00401 |
0.00329 |
1 |
| 2028 |
0.00585 |
0.00433 |
0.00264 |
9 |
| 2029 |
0.00748 |
0.00509 |
0.00458 |
28 |
| 2030 |
0.00823 |
0.00628 |
0.0044 |
58 |
| 2031 |
0.01038 |
0.00726 |
0.00704 |
83 |
IV. TOKEN Professional Investment Strategy and Risk Management
TOKEN Investment Methodology
(1) Long-term Holding Strategy
- Suitable for: Investors who believe in the tokenization industry's long-term growth potential and can tolerate high volatility
- Operational Suggestions:
- Consider dollar-cost averaging (DCA) to mitigate timing risk, given TOKEN's significant price fluctuations (30-day change: +70.16%, 1-year change: -88.92%)
- Monitor TOKEN's platform development milestones and adoption metrics in the tokenization sector
- Storage Solution: Use Gate Web3 Wallet for secure custody with multi-signature protection and regular security audits
(2) Active Trading Strategy
- Technical Analysis Tools:
- Support/Resistance Levels: Monitor the 24-hour range between $0.003929 and $0.004026 for short-term trading opportunities
- Volume Analysis: Track the 24-hour trading volume ($69,828.07) relative to market cap ($13.35M) to identify momentum shifts
- Swing Trading Considerations:
- TOKEN's high volatility (24-hour change: +0.4%, 7-day change: -19.13%) may present swing trading opportunities
- Set stop-loss orders at 5-10% below entry points due to significant price swings
TOKEN Risk Management Framework
(1) Asset Allocation Principles
- Conservative Investors: 0.5-1% of crypto portfolio allocation
- Moderate Investors: 1-3% of crypto portfolio allocation
- Aggressive Investors: 3-5% of crypto portfolio allocation
(2) Risk Hedging Solutions
- Diversification Strategy: Balance TOKEN holdings with established cryptocurrencies and stablecoins
- Position Sizing: Limit TOKEN exposure given its low market dominance (0.0012%) and high volatility profile
(3) Secure Storage Solutions
- Hot Wallet Recommendation: Gate Web3 Wallet for active trading and easy access
- Multi-chain Support: Ensure wallet compatibility with both BSC and ETH networks where TOKEN operates
- Security Precautions: Enable two-factor authentication, never share private keys, and verify contract addresses (BSC: 0x4507cef57c46789ef8d1a19ea45f4216bae2b528, ETH: 0x4507cef57c46789ef8d1a19ea45f4216bae2b528) before transactions
V. TOKEN Potential Risks and Challenges
TOKEN Market Risks
- High Volatility: TOKEN experienced an 88.92% decline over the past year, demonstrating substantial downside risk
- Low Liquidity: With a 24-hour trading volume of approximately $69,828, large orders may face significant slippage
- Limited Market Presence: TOKEN ranks #1069 by market cap with only 0.0012% market dominance, indicating limited market adoption
TOKEN Regulatory Risks
- Tokenization Platform Scrutiny: Platforms facilitating asset tokenization may face increased regulatory oversight as the industry grows
- Multi-jurisdictional Compliance: Operating across different regulatory frameworks may present compliance challenges
- Securities Classification Risk: Certain tokenized assets on the platform could be classified as securities in various jurisdictions
TOKEN Technical Risks
- Smart Contract Vulnerabilities: Multi-chain deployment (BSC and ETH) increases the attack surface for potential exploits
- Platform Development Risk: As a relatively new platform (launched October 2023), TOKEN's success depends on continuous technical development
- Network Dependency: TOKEN operates on Ethereum POS, making it subject to any technical issues or changes in the underlying blockchain
VI. Conclusion and Action Recommendations
TOKEN Investment Value Assessment
TOKEN targets the tokenization industry, which represents a significant long-term opportunity. However, the token faces considerable challenges, including an 88.92% decline over the past year and limited market presence (ranking #1069). The platform's no-code approach to token creation addresses a genuine market need, but investors should weigh this potential against the token's low circulating supply ratio (33.75% of total supply) and limited liquidity. The recent 30-day price increase of 70.16% suggests renewed interest, but this should be viewed cautiously given the broader negative trend.
TOKEN Investment Recommendations
✅ Newcomers: Start with minimal exposure (under 1% of crypto portfolio) and thoroughly research the tokenization industry and TOKEN's platform capabilities before investing. Consider observing TOKEN's price action and development progress over several months before making substantial commitments.
✅ Experienced Investors: TOKEN may serve as a speculative allocation (1-3% of crypto portfolio) for those seeking exposure to the tokenization sector. Monitor platform adoption metrics, holder growth (currently 31,040 holders), and partnership announcements for signals of sustainable growth.
✅ Institutional Investors: Conduct comprehensive due diligence on TOKEN's technology stack, team credentials, competitive positioning, and regulatory compliance framework. Consider TOKEN as part of a broader thematic investment in real-world asset tokenization alongside more established projects.
TOKEN Trading Participation Methods
- Spot Trading: Purchase TOKEN directly on Gate.com with support for both BSC and ETH networks
- Dollar-Cost Averaging: Implement systematic purchases over time to reduce timing risk given TOKEN's high volatility
- Gate Web3 Wallet Integration: Utilize Gate Web3 Wallet for seamless trading and secure storage of TOKEN across supported chains
Cryptocurrency investment carries extreme risks, and this article does not constitute investment advice. Investors should make prudent decisions based on their own risk tolerance and are advised to consult professional financial advisors. Never invest more than you can afford to lose.
FAQ
What are the main methods for TOKEN price prediction?
Main methods include technical analysis(using charts and indicators), fundamental analysis(evaluating project metrics), on-chain analytics(monitoring transaction volume and holder activity), market sentiment analysis, and historical price pattern recognition.
How to predict TOKEN price trends through technical analysis?
Analyze price charts using candlestick patterns, support/resistance levels, and moving averages. Monitor trading volume and RSI indicators for momentum signals. Combine multiple indicators for more accurate trend predictions and entry/exit points.
What are the main factors affecting TOKEN price?
TOKEN price is primarily influenced by market demand and supply dynamics, trading volume, overall market sentiment, macroeconomic conditions, project developments and partnerships, regulatory news, Bitcoin market trends, and investor confidence in the cryptocurrency sector.
What are common risks and misconceptions in TOKEN price prediction?
Common mistakes include relying solely on historical data, ignoring market sentiment and on-chain metrics, overleveraging positions, and neglecting liquidity and trading volume. Successful prediction requires analyzing multiple factors: technical patterns, fundamental developments, macro trends, and community dynamics together.
Popular tools include TradingView for charting and technical analysis, CoinGecko for comprehensive market data, and Dune Analytics for on-chain metrics. These platforms offer real-time price tracking, transaction volume analysis, and historical trend visualization to support informed TOKEN analysis.
What is the role of fundamental analysis in TOKEN price prediction?
Fundamental analysis evaluates TOKEN's intrinsic value by examining project technology, team, adoption metrics, transaction volume, and ecosystem development. Strong fundamentals typically support sustainable price appreciation and help predict long-term price trends.
* The information is not intended to be and does not constitute financial advice or any other recommendation of any sort offered or endorsed by Gate.