This comprehensive analysis examines TokenFi (TOKEN) price dynamics and investment potential from 2026 to 2031. The article provides detailed market status assessment, revealing TOKEN's current position at $0.003978 with a $13.43 million market capitalization, alongside historical price evolution from its October 2023 launch. Multi-scenario price forecasts are presented, ranging from conservative to optimistic outlooks, projecting potential appreciation of 34-63% by 2031. The analysis integrates technical and fundamental factors, including historical volatility patterns, holding distribution analysis, and market sentiment indicators showing extreme fear conditions. Professional investment strategies are outlined for different investor profiles, encompassing long-term holding approaches, active trading methodologies, and comprehensive risk management frameworks. Essential guidance covers secure storage via Gate Web3 Wallet, diversification principles, and position sizing recommendations. The article addresses
Introduction: TOKEN's Market Position and Investment Value
TokenFi (TOKEN), positioning itself as an all-in-one tokenization platform, has been serving the emerging digital asset tokenization sector since its launch in 2023. As of 2026, TOKEN maintains a market capitalization of approximately $13.43 million, with a circulating supply of around 3.38 billion tokens, and the price hovering around $0.003978. This asset, recognized as a "no-code tokenization solution," is playing an increasingly significant role in democratizing token creation and asset tokenization for users without technical programming expertise.
This article will comprehensively analyze TOKEN's price trajectory from 2026 to 2031, integrating historical patterns, market supply-demand dynamics, ecosystem development, and macroeconomic conditions to provide investors with professional price forecasts and practical investment strategies.
I. TOKEN Price History Review and Market Status
TOKEN Historical Price Evolution Trajectory
- October 2023: TokenFi (TOKEN) officially launched on Gate.com with trading starting around October 26, 2023, marking its entry into the cryptocurrency market
- March 2024: TOKEN reached its historical peak price of $0.24646 on March 26, 2024, representing a significant milestone in the token's price performance during this period
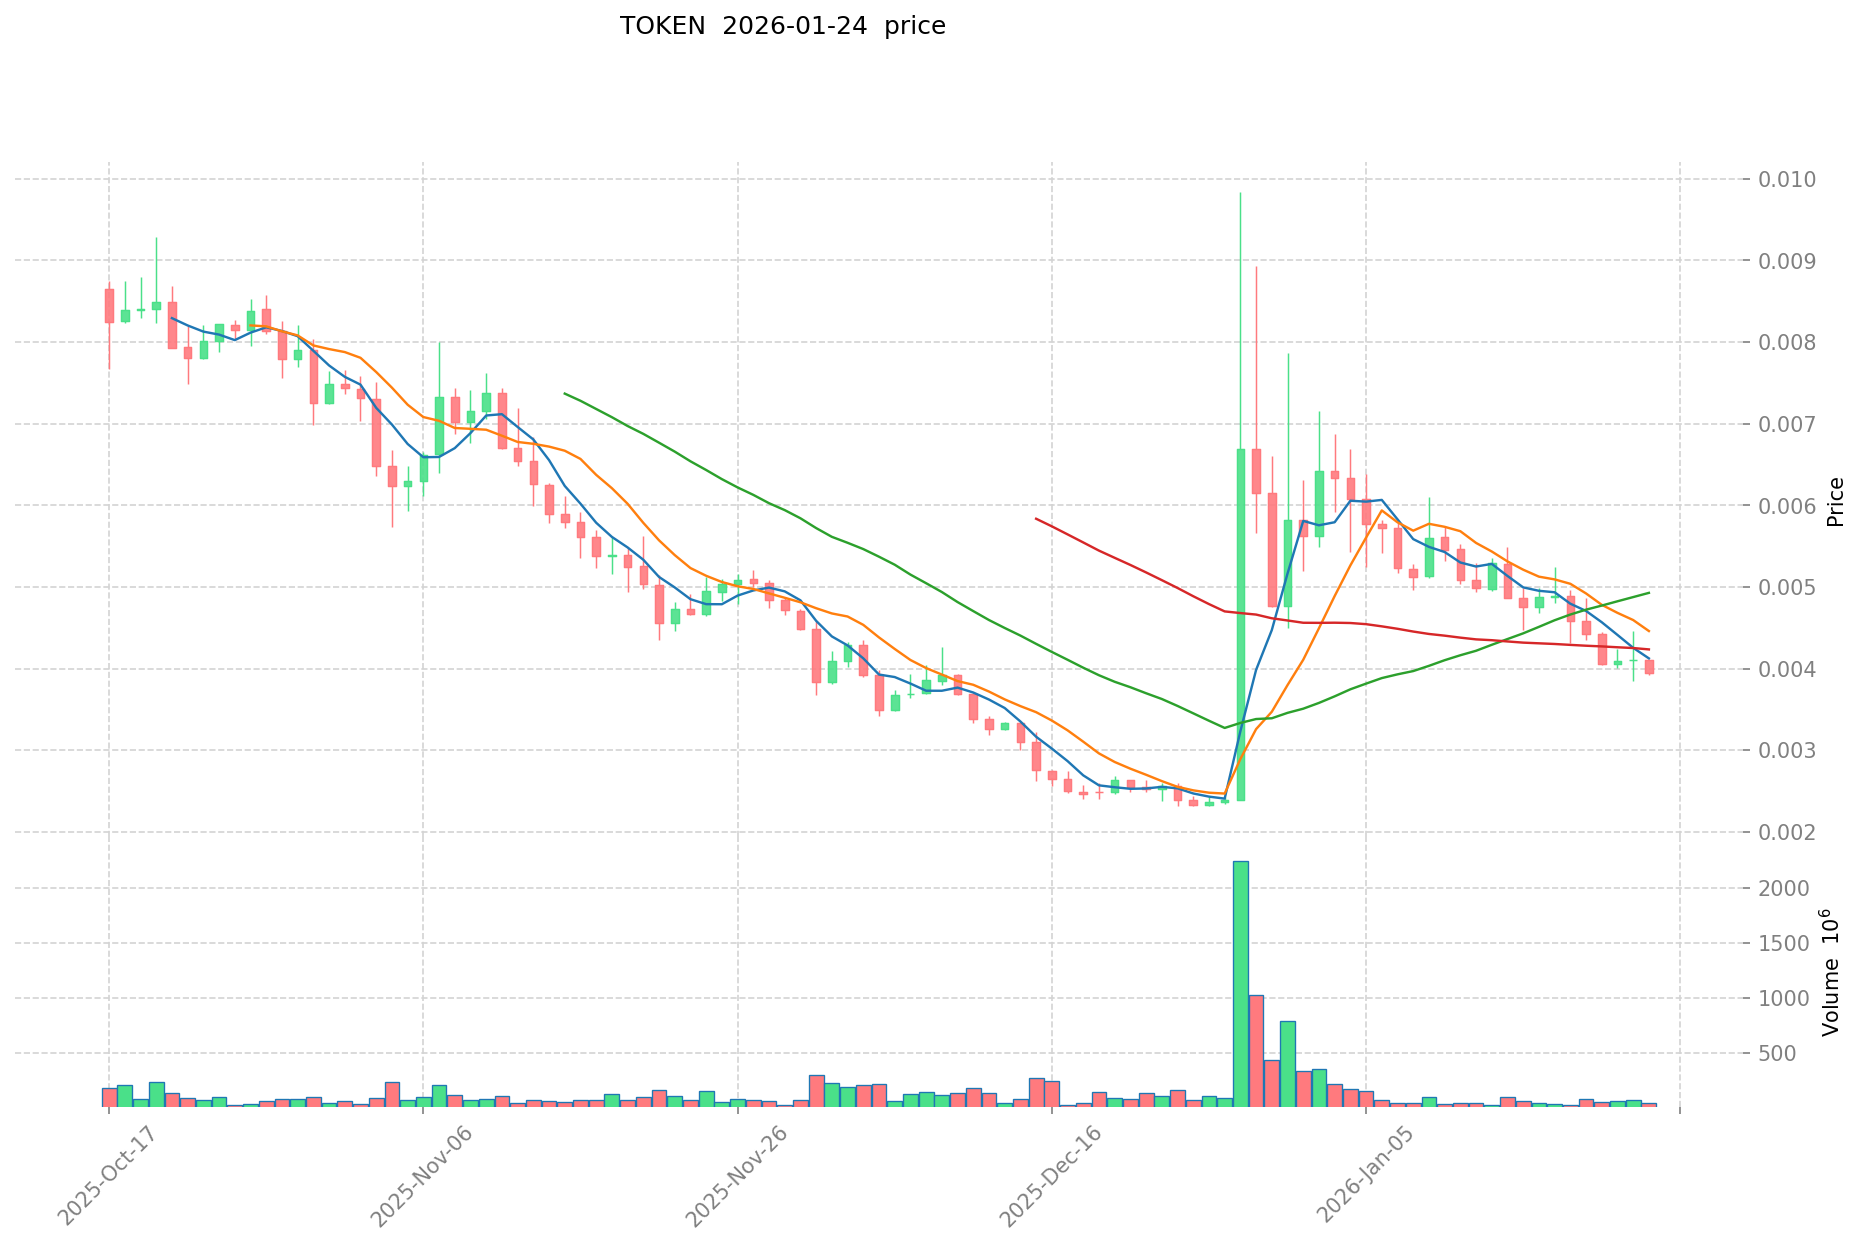
- December 2025: The token experienced substantial downward pressure, recording its historical low price of $0.002316 on December 24, 2025, reflecting a major market correction phase
TOKEN Current Market Situation
As of January 25, 2026, TOKEN is trading at $0.003978, showing a modest 24-hour increase of 1.01%. The token's trading volume over the past day reached $70,810.42, indicating moderate market activity. The current price represents a recovery from the December 2025 low, though it remains significantly below historical peaks.
TOKEN's market capitalization stands at approximately $13.43 million, with a circulating supply of 3.38 billion tokens out of a maximum supply of 10 billion tokens. This represents a circulation ratio of approximately 33.75%. The fully diluted market cap is calculated at $39.78 million. The token holds a market ranking of 1063 and maintains a market share of 0.0012%.
Recent price movements show mixed trends across different timeframes. The 1-hour change registered at -0.1%, while the 7-day performance indicates a decline of 19.18%. However, the 30-day performance presents a substantial gain of 67.69%, suggesting recent recovery momentum. The 1-year performance shows a decline of 89.48%, reflecting the broader market challenges faced over the past year.
The 24-hour trading range fluctuated between a low of $0.003928 and a high of $0.004026. TokenFi maintains presence across 22 exchanges and has attracted a holder base of approximately 31,040 addresses. The token operates on both Ethereum and BSC networks, with contract addresses deployed on both chains.
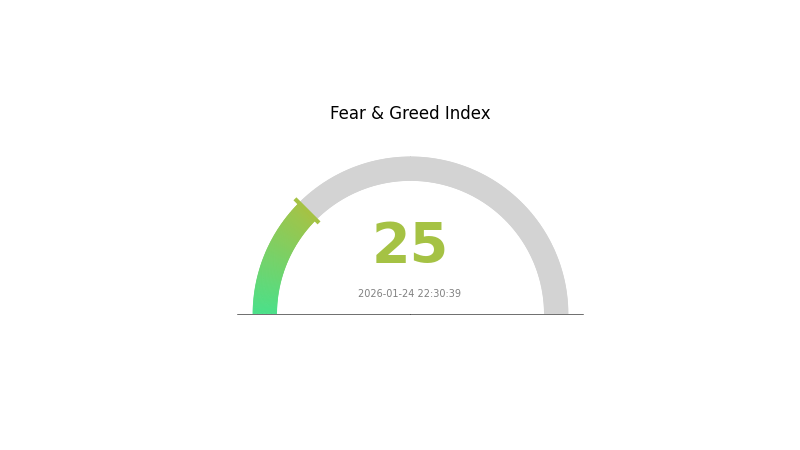
Market sentiment indicators show a crypto fear and greed index reading of 25, classified as "Extreme Fear" territory, suggesting cautious market conditions. TokenFi positions itself as an all-in-one tokenization platform, targeting the broader tokenization industry.
Click to view current TOKEN market price
TOKEN Market Sentiment Indicator
2026-01-24 Fear and Greed Index: 25 (Extreme Fear)
Click to view current Fear & Greed Index
The crypto market is currently experiencing extreme fear, with the Fear and Greed Index at 25. This indicates significant market pessimism and heightened investor anxiety. When the index reaches such low levels, it typically signals oversold conditions, presenting potential opportunities for contrarian investors. However, extreme fear also reflects genuine market concerns and volatility risks. Investors should exercise caution, conduct thorough research, and avoid making impulsive decisions based solely on short-term sentiment. Consider your risk tolerance and investment strategy carefully during periods of extreme fear.
TOKEN Holding Distribution
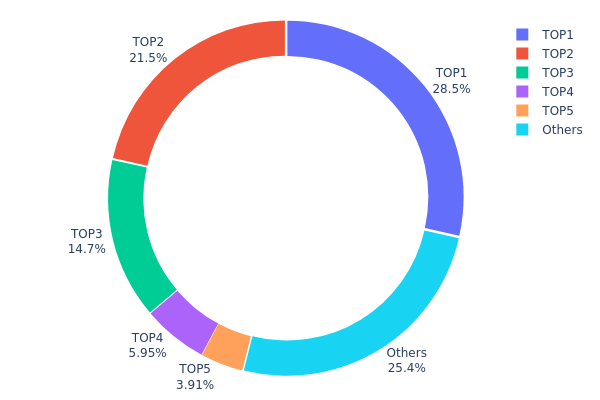
The holding distribution chart reflects the concentration level of TOKEN's circulating supply across different addresses. By analyzing the proportion held by top addresses versus smaller holders, this metric reveals the degree of centralization in token ownership and potential risks associated with concentrated holdings.
Based on current on-chain data, TOKEN exhibits a relatively high concentration pattern. The top address (0xb8d2...f4ee43) holds approximately 1.43 million tokens, accounting for 28.53% of the total supply, while the second-largest holder (0x2b9d...d60ab0) controls 21.49%. Combined, the top two addresses alone hold nearly 50% of TOKEN's circulating supply. The top five addresses collectively possess 74.58% of all tokens, with only 25.42% distributed among other holders. This concentration structure indicates that TOKEN's ownership is heavily centralized within a small number of major addresses.
Such high concentration presents significant implications for market dynamics. When a substantial portion of supply is controlled by a limited number of entities, these large holders possess considerable influence over price movements. Large-scale sell-offs or transfers by major holders could trigger substantial volatility, potentially causing rapid price fluctuations that impact market sentiment. Additionally, this concentration pattern raises concerns about potential market manipulation risks, as coordinated actions by major holders could artificially influence price discovery. From a decentralization perspective, TOKEN's current distribution structure suggests limited diffusion across the broader holder base, which may affect long-term ecosystem stability and community governance participation.
Click to view current TOKEN Holding Distribution
| Top |
Address |
Holding Qty |
Holding (%) |
| 1 |
0xb8d2...f4ee43 |
1426760.98K |
28.53% |
| 2 |
0x2b9d...d60ab0 |
1074642.31K |
21.49% |
| 3 |
0x1e78...2f7ecd |
735760.56K |
14.71% |
| 4 |
0x6522...837e90 |
297448.60K |
5.94% |
| 5 |
0xc7e6...c691c6 |
195501.23K |
3.91% |
| - |
Others |
1269886.32K |
25.42% |
II. Core Factors Influencing TOKEN Future Price
Based on the provided materials, there is insufficient data available to analyze the core factors that may influence TOKEN's future price. A comprehensive price analysis requires detailed information on supply mechanisms, institutional dynamics, macroeconomic conditions, and technical developments, none of which are present in the current reference materials.
To conduct a thorough analysis of TOKEN's price drivers, it would be necessary to gather data on token economics, major holder activities, regulatory developments, technological roadmap updates, and ecosystem growth metrics.
III. 2026-2031 TOKEN Price Prediction
2026 Outlook
- Conservative Forecast: $0.00203 - $0.00300
- Neutral Forecast: $0.00300 - $0.00398
- Optimistic Forecast: $0.00398 - $0.00414 (requires favorable market conditions and sustained adoption momentum)
2027-2029 Mid-term Outlook
- Market Phase Expectation: The token is anticipated to enter a gradual growth phase, with potential volatility reflecting broader crypto market cycles and project development milestones.
- Price Range Predictions:
- 2027: $0.00276 - $0.00439 (projected 2% change from 2026)
- 2028: $0.00393 - $0.00515 (projected 6% change from prior year)
- 2029: $0.00295 - $0.00600 (projected 17% change, indicating potential acceleration)
- Key Catalysts: Ecosystem expansion, partnership announcements, technological upgrades, and overall cryptocurrency market sentiment could serve as primary price drivers during this period.
2030-2031 Long-term Outlook
- Baseline Scenario: $0.00497 - $0.00535 by 2030 (assuming steady project development and moderate market conditions)
- Optimistic Scenario: $0.00535 - $0.00770 by 2030 (contingent on strong adoption metrics and favorable regulatory environment)
- Transformative Scenario: $0.00398 - $0.00756 range by 2031 (subject to breakthrough developments, major ecosystem integrations, or significant market expansion)
These projections reflect potential price movements based on historical data patterns and assume continued project viability. The predicted 34% change by 2030 and 63% by 2031 suggest potential long-term appreciation, though investors should note that cryptocurrency markets remain highly volatile and unpredictable. Actual performance may vary significantly based on technological developments, market conditions, regulatory changes, and competitive dynamics.
| Year |
Predicted High Price |
Predicted Average Price |
Predicted Low Price |
Price Change |
| 2026 |
0.00414 |
0.00398 |
0.00203 |
0 |
| 2027 |
0.00439 |
0.00406 |
0.00276 |
2 |
| 2028 |
0.00515 |
0.00422 |
0.00393 |
6 |
| 2029 |
0.006 |
0.00469 |
0.00295 |
17 |
| 2030 |
0.0077 |
0.00535 |
0.00497 |
34 |
| 2031 |
0.00756 |
0.00652 |
0.00398 |
63 |
IV. TOKEN Professional Investment Strategies and Risk Management
TOKEN Investment Methodology
(1) Long-term Holding Strategy
- Suitable for: Investors seeking exposure to the tokenization industry with a 3-5 year investment horizon
- Operational Recommendations:
- Consider dollar-cost averaging (DCA) to reduce entry timing risk, given TOKEN's high volatility (-89.48% over the past year)
- Monitor project development milestones and platform adoption metrics to assess long-term viability
- Storage Solution: Use Gate Web3 Wallet for secure multi-chain storage, supporting both ETH and BSC networks where TOKEN is deployed
(2) Active Trading Strategy
- Technical Analysis Tools:
- Moving Averages: Track 50-day and 200-day moving averages to identify trend reversals; TOKEN's 30-day gain of 67.69% suggests potential momentum shifts
- Volume Analysis: Monitor 24-hour trading volume ($70,810) relative to market cap ($13.43M) to gauge market participation
- Swing Trading Considerations:
- Set stop-loss orders 10-15% below entry points due to TOKEN's demonstrated price volatility
- Consider taking partial profits during price rallies, as TOKEN remains 98.39% below its all-time high of $0.24646
TOKEN Risk Management Framework
(1) Asset Allocation Principles
- Conservative Investors: 1-2% of cryptocurrency portfolio allocation
- Aggressive Investors: 3-5% of cryptocurrency portfolio allocation
- Professional Investors: Up to 8-10% with active portfolio rebalancing and hedging strategies
(2) Risk Hedging Solutions
- Diversification Approach: Combine TOKEN holdings with established cryptocurrencies to reduce concentration risk
- Position Sizing: Limit initial positions to amounts that can withstand a potential 50-70% drawdown based on historical volatility
(3) Secure Storage Solutions
- Multi-Chain Wallet Recommended: Gate Web3 Wallet, supporting TOKEN's dual-chain deployment (Ethereum and BSC)
- Cold Storage Option: For long-term holdings exceeding $10,000, consider hardware wallet solutions with regular security audits
- Security Precautions: Enable two-factor authentication, regularly update wallet software, and never share private keys or seed phrases
V. TOKEN Potential Risks and Challenges
TOKEN Market Risks
- High Volatility: TOKEN has experienced significant price fluctuations, declining 89.48% over the past year while showing 67.69% growth over 30 days, indicating unstable price action
- Low Market Capitalization: With a market cap of only $13.43 million and ranking at #1063, TOKEN faces higher susceptibility to market manipulation and liquidity risks
- Limited Trading Volume: Daily trading volume of $70,810 suggests relatively low liquidity, potentially resulting in higher slippage during large transactions
TOKEN Regulatory Risks
- Tokenization Sector Scrutiny: As tokenization platforms may involve securities-like offerings, regulatory frameworks in various jurisdictions could impact TOKEN's operational model
- Compliance Uncertainty: The evolving regulatory landscape for asset tokenization may require platform adaptations that could affect token utility or value
- Cross-Border Regulatory Challenges: TOKEN's dual-chain deployment across ETH and BSC may face different regulatory treatments in various jurisdictions
TOKEN Technical Risks
- Smart Contract Vulnerabilities: As a tokenization platform, any security flaws in TOKEN's smart contracts could compromise user assets and platform credibility
- Multi-Chain Dependency: TOKEN's deployment on both Ethereum and BSC exposes it to risks from both blockchain networks, including potential bridge vulnerabilities
- Platform Adoption Risk: The project's success depends on widespread adoption of its tokenization tools; failure to gain traction could diminish token utility and value
VI. Conclusion and Action Recommendations
TOKEN Investment Value Assessment
TOKEN represents a high-risk, high-potential opportunity in the emerging tokenization sector, which is projected to reach significant market size by 2030. However, the token's dramatic 89.48% decline over the past year, combined with its low market capitalization ($13.43M) and relatively modest trading volume, indicates substantial volatility and speculative characteristics. The recent 67.69% gain over 30 days demonstrates potential for short-term price movements, but investors should approach with caution given the project's current early-stage development and market positioning.
TOKEN Investment Recommendations
✅ Beginners: Consider minimal exposure (under 1% of crypto portfolio) only after thorough research into tokenization platforms and understanding of high-risk asset characteristics; prioritize education over immediate investment
✅ Experienced Investors: Limit allocation to 2-5% of crypto portfolio with strict stop-loss orders; monitor project development milestones and platform adoption metrics quarterly to reassess investment thesis
✅ Institutional Investors: Conduct comprehensive due diligence on platform technology, team credentials, and competitive positioning before considering strategic allocation; implement hedging strategies and regular risk assessments
TOKEN Trading Participation Methods
- Spot Trading: Purchase TOKEN directly on Gate.com with support for both ETH and BSC network deposits
- Dollar-Cost Averaging: Implement systematic purchase plans to mitigate timing risk given TOKEN's high volatility profile
- Portfolio Integration: Include TOKEN as part of a diversified blockchain infrastructure portfolio alongside more established assets to manage concentration risk
Cryptocurrency investment carries extremely high risks, and this article does not constitute investment advice. Investors should make prudent decisions based on their own risk tolerance and are advised to consult professional financial advisors. Never invest more than you can afford to lose.
FAQ
Analyze price trends using candlestick charts, support/resistance levels, and moving averages. Review trading volume, market cap, and on-chain metrics. Monitor key indicators like RSI and MACD to assess momentum and potential price movements.
What are the main factors affecting TOKEN price?
TOKEN price is primarily influenced by market demand and supply, trading volume, overall crypto market sentiment, project development progress, regulatory news, macroeconomic factors, and community engagement. Positive catalysts and technological updates typically drive price appreciation.
Common methods include technical analysis(using charts and indicators),fundamental analysis(evaluating project metrics),on-chain analysis(monitoring transaction volume and holder behavior),machine learning models,and sentiment analysis. Popular tools include TradingView,CoinGecko data analytics,blockchain explorers,and AI prediction platforms for market forecasting.
How to assess the accuracy and risk of TOKEN price predictions?
Evaluate predictions by analyzing historical accuracy rates, market volume data, technical indicators, and model methodology. Compare forecasts against actual price movements. Monitor prediction frequency and adjust strategies based on real performance metrics and market volatility trends.
What are the differences in price prediction strategies for different tokens?
Different tokens require tailored strategies based on market cap, trading volume, volatility, and adoption rates. Large-cap tokens show stable trends, while altcoins respond more to community sentiment and technical catalysts. Prediction accuracy varies by analyzing on-chain metrics, historical patterns, and fundamental developments specific to each token's ecosystem.
How do macroeconomic factors affect TOKEN's price trends?
Macroeconomic factors significantly influence TOKEN pricing. Interest rate changes, inflation rates, and global economic sentiment drive market cycles. Strong economies boost risk appetite, supporting token valuations, while recessions trigger selling pressure. Currency fluctuations and geopolitical events also create volatility. Additionally, regulatory policies and central bank decisions directly impact crypto market dynamics and investor confidence.
* The information is not intended to be and does not constitute financial advice or any other recommendation of any sort offered or endorsed by Gate.