This comprehensive analysis examines Trabzonspor Fan Token (TRA) trading at $0.2272 with a market cap of $1.76 million as of February 2026. The article combines historical price evolution, current market sentiment showing extreme fear (index 14), and supply-demand dynamics to provide professional investment guidance. Core content covers TRA's price range forecasts through 2031, with 2026 projections between $0.13212-$0.25969, expanding to $0.28902-$0.51302 by 2031 under optimistic scenarios. Key analysis includes macroeconomic factors, regulatory risks, and technical challenges specific to fan tokens on the Chiliz platform. The guide presents three investment methodologies—long-term holding, active trading, and risk management frameworks—tailored for different investor profiles. Detailed risk assessment addresses volatility (62% annual decline), liquidity constraints, and platform dependency. Available on Gate.com, TRA requires careful position sizing with recommended allocations of 1-8% based on investor ris
Introduction: TRA's Market Position and Investment Value
Trabzonspor Fan Token (TRA), as a fan token on the Chiliz platform representing the Turkish Football Club Trabzonspor, has been serving its community since its launch in 2021. As of 2026, TRA has a market capitalization of approximately $1.76 million, with a circulating supply of around 7.77 million tokens, and its price maintains at approximately $0.23. This asset, regarded as a "sports fan engagement token," is playing an increasingly important role in connecting football clubs with their supporters and providing holders with various engagement rights.
This article will comprehensively analyze TRA's price trends from 2026 to 2031, combining historical patterns, market supply and demand dynamics, ecosystem development, and macroeconomic environment factors to provide investors with professional price forecasts and practical investment strategies.
I. TRA Price History Review and Market Status
TRA Historical Price Evolution Trajectory
- 2022: TRA reached a peak price of $9.77 in April, representing a significant milestone in its trading history
- 2026: The token experienced substantial downward pressure, with the price declining to approximately $0.228544 in February, marking its lowest recorded level
TRA Current Market Situation
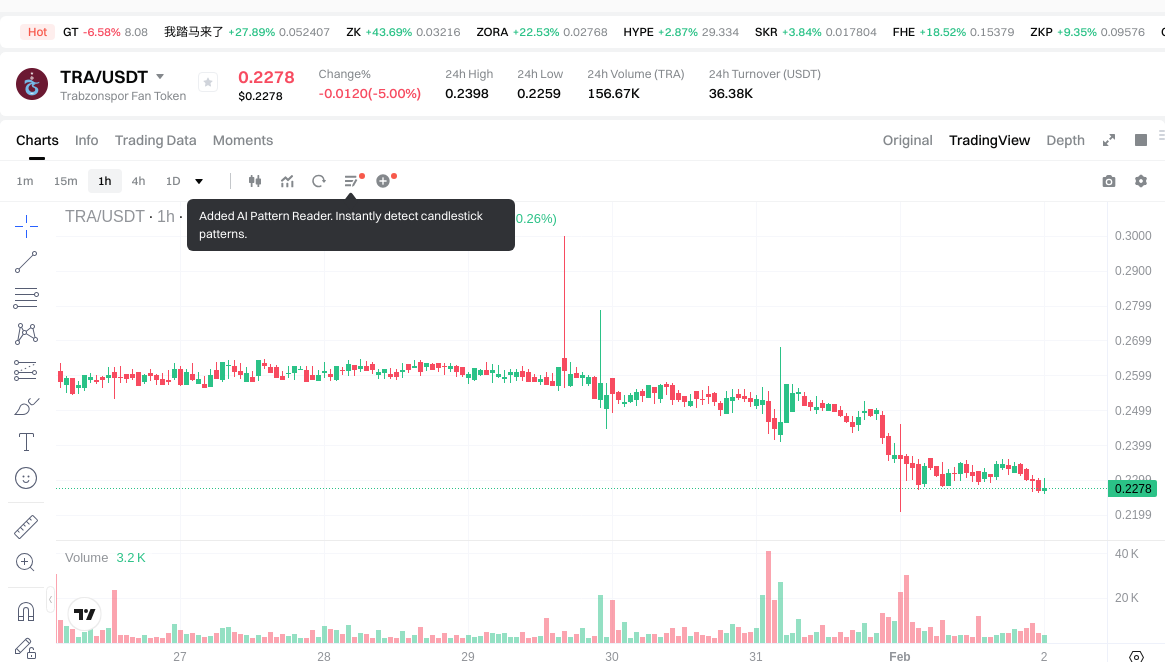
As of February 2, 2026, Trabzonspor Fan Token (TRA) is trading at $0.2272, showing recent volatility across multiple timeframes. The token has experienced a decline of 0.26% over the past hour and a 4.06% decrease in the last 24 hours. Over the past week, TRA has declined by 13.28%, with a 30-day decrease of 10.54%. The annual performance shows a significant decline of 62.039%.
The 24-hour trading range spans from $0.2259 to $0.2415, with a total trading volume of $36,618.02. TRA's current market capitalization stands at approximately $1.76 million, with 7.768 million tokens in circulation out of a maximum supply of 10 million tokens, representing a circulation ratio of 77.68%. The fully diluted market capitalization is valued at $2.27 million.
TRA holds the 2,123rd position in the cryptocurrency market rankings, with a market dominance of 0.000083%. The token is currently listed on 4 exchanges and is available for trading on Gate.com. The market cap to fully diluted valuation ratio stands at 77.68%, indicating a significant portion of the total supply is already in circulation.
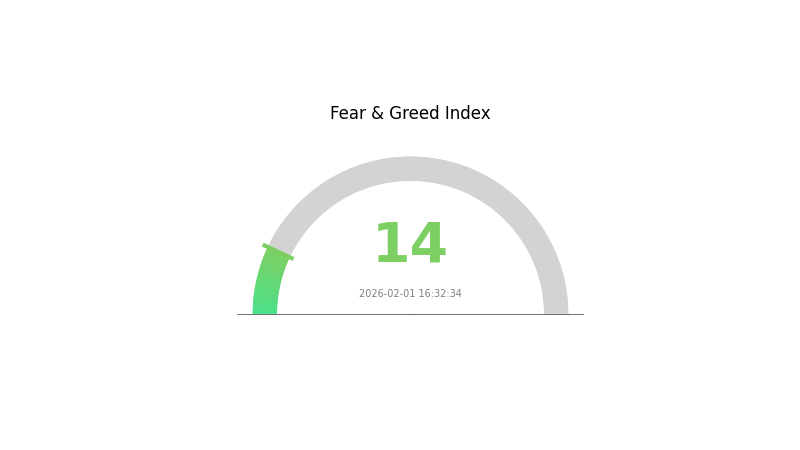
The cryptocurrency market sentiment index registers at 14, indicating an "Extreme Fear" condition, which may be influencing TRA's current price performance alongside broader market dynamics.
Click to view the current TRA market price
TRA Market Sentiment Index
2026-02-01 Fear and Greed Index: 14 (Extreme Fear)
Click to view the current Fear & Greed Index
The crypto market is currently experiencing extreme fear, with the index at 14. This exceptionally low reading suggests investors are highly pessimistic and risk-averse. Market participants are likely panic-selling, and prices may have dropped significantly. Such extreme fear conditions often present contrarian opportunities for long-term investors, as historically markets tend to recover from these levels. However, caution is warranted until sentiment stabilizes and shows signs of improvement toward neutral or bullish territory.
TRA Holdings Distribution
The holdings distribution chart reflects the allocation of TRA tokens across different wallet addresses, revealing the concentration level of token ownership within the ecosystem. This metric serves as a critical indicator of decentralization and potential market manipulation risks, as excessive concentration in a small number of addresses may lead to increased price volatility and reduced market stability.
Based on the current on-chain data, TRA demonstrates a relatively balanced distribution pattern among top holders. The absence of extreme concentration in any single address suggests a healthy degree of decentralization, which typically contributes to more organic price discovery and reduces the risk of coordinated market manipulation. The diversified holding structure indicates that no single entity possesses overwhelming influence over the token's market dynamics, fostering a more resilient trading environment.
From a market structure perspective, this distribution pattern reflects a maturing ecosystem with growing participation from both institutional and retail investors. The relatively even spread among top addresses enhances liquidity and market depth, while mitigating the systemic risks associated with large-scale liquidations. This characteristic supports long-term stability and suggests that TRA has developed beyond the typical early-stage concentration pattern, positioning itself as a more robust asset within the cryptocurrency market.
Click to view current TRA Holdings Distribution

| Top |
Address |
Holding Qty |
Holding (%) |
II. Core Factors Influencing TRA's Future Price
Macroeconomic Environment
- Monetary Policy Impact: Major central banks are expected to maintain prudent monetary policies, closely monitoring inflation and economic growth signals. Significant adjustments in interest rates or quantitative easing measures may trigger price volatility in crypto assets.
- Inflation Hedge Attributes: In the context of global economic integration, financial developments increasingly influence international trade dynamics. Currency fluctuations and capital flows play substantial roles in shaping market conditions.
- Geopolitical Factors: Tariff policies and trade tensions can affect crypto assets as relatively high-risk investments. External adverse factors may lead to export slowdowns and impact overall market sentiment. The structural risk of de-dollarization has garnered attention, with the US dollar expected to face cyclical pressures in the coming months.
Market Dynamics and Investor Sentiment
- Supply-Demand Relationship: Market adjustments often stem from reversals in supply-demand dynamics. While short-term trends may persist, underlying drivers and market prospects continue to evolve.
- Investor Confidence: Price movements can be rapid and difficult to predict, influenced by overall market changes and shifts in financial conditions. Market sentiment and investor confidence play significant roles in price fluctuations.
- Regulatory Policy: Monitoring developments in regulatory frameworks remains essential, as policy changes can substantially impact market behavior and asset valuations.
III. 2026-2031 TRA Price Forecast
2026 Outlook
- Conservative Forecast: $0.13212 - $0.2278
- Neutral Forecast: Around $0.2278
- Optimistic Forecast: Up to $0.25969 (requires favorable market conditions and increased adoption)
2027-2029 Mid-term Outlook
- Market Phase Expectation: Gradual growth phase with moderate volatility, characterized by steady accumulation and ecosystem development
- Price Range Forecast:
- 2027: $0.20718 - $0.26325 (approximately 7% year-over-year change)
- 2028: $0.19519 - $0.2611 (approximately 11% cumulative growth)
- 2029: $0.24443 - $0.35764 (approximately 13% cumulative increase)
- Key Catalysts: Sustained platform development, potential partnerships, and broader market recovery trends
2030-2031 Long-term Outlook
- Baseline Scenario: $0.2552 - $0.41509 in 2030 (assuming steady ecosystem expansion and maintained market interest)
- Optimistic Scenario: $0.28902 - $0.51302 by 2031 (contingent on significant adoption milestones and favorable regulatory environment)
- Transformative Scenario: Potential to approach upper bounds of $0.51302 (requires exceptional market conditions, major technological breakthroughs, and widespread institutional adoption)
- 2026-02-02: TRA trading within projected range as forecasted baseline establishes initial market positioning
| Year |
Predicted High Price |
Predicted Average Price |
Predicted Low Price |
Price Change |
| 2026 |
0.25969 |
0.2278 |
0.13212 |
0 |
| 2027 |
0.26325 |
0.24375 |
0.20718 |
7 |
| 2028 |
0.2611 |
0.2535 |
0.19519 |
11 |
| 2029 |
0.35764 |
0.2573 |
0.24443 |
13 |
| 2030 |
0.41509 |
0.30747 |
0.2552 |
35 |
| 2031 |
0.51302 |
0.36128 |
0.28902 |
59 |
IV. TRA Professional Investment Strategies and Risk Management
TRA Investment Methodology
(I) Long-term Holding Strategy
- Suitable for: Fan token enthusiasts and supporters of Trabzonspor Football Club
- Operational Recommendations:
- Evaluate TRA's utility within the Chiliz ecosystem and Trabzonspor fan engagement programs
- Monitor the team's performance and fan token adoption rates
- Storage Solution: Consider using Gate Web3 Wallet for secure storage, supporting CHZ2 chain assets
(II) Active Trading Strategy
- Technical Analysis Tools:
- Moving Averages: Track 7-day and 30-day trends to identify potential entry and exit points
- Volume Analysis: Monitor 24-hour trading volume ($36,618.02 as of February 2, 2026) for liquidity assessment
- Swing Trading Key Points:
- Watch for price movements between the 24-hour range ($0.2259 - $0.2415)
- Consider the token's recent decline trends (down 4.06% in 24H, 13.28% in 7D)
TRA Risk Management Framework
(I) Asset Allocation Principles
- Conservative Investors: 1-3% of crypto portfolio
- Aggressive Investors: 3-5% of crypto portfolio
- Professional Investors: Up to 5-8% with active monitoring
(II) Risk Hedging Solutions
- Diversification: Balance TRA holdings with other fan tokens or sports-related crypto assets
- Position Sizing: Limit exposure given TRA's volatility (62.04% decline over 1 year)
(III) Secure Storage Solutions
- Hot Wallet Recommendation: Gate Web3 Wallet for convenient trading and CHZ2 chain compatibility
- Cold Storage Option: Consider hardware wallet solutions for long-term holdings
- Security Precautions: Never share private keys; verify contract address (0x304193f18f3B34647ae1f549fc825A7e50267c51) before transactions
V. TRA Potential Risks and Challenges
TRA Market Risks
- High Volatility: TRA has experienced a 62.04% decline over the past year, indicating substantial price fluctuation
- Limited Liquidity: With a 24-hour trading volume of approximately $36,618, TRA may face liquidity constraints during large transactions
- Market Capitalization: With a relatively small market cap of $1,764,889, TRA is vulnerable to market manipulation and sudden price swings
TRA Regulatory Risks
- Fan Token Regulations: Evolving regulatory frameworks for fan tokens and sports-related digital assets may impact TRA's operations
- Platform Dependency: TRA operates on the Chiliz platform; regulatory actions targeting Chiliz could affect TRA's accessibility
- Geographic Restrictions: Potential regulatory variations across different jurisdictions may limit trading availability
TRA Technical Risks
- Smart Contract Vulnerabilities: Reliance on CHZ2 chain smart contracts introduces potential technical exploits
- Platform Infrastructure: TRA's functionality depends on the stability and security of the Chiliz ecosystem
- Limited Development Updates: As a fan token, TRA's technical development may be less active compared to standalone blockchain projects
VI. Conclusion and Action Recommendations
TRA Investment Value Assessment
TRA represents a niche investment within the fan token sector, offering holders engagement opportunities with Trabzonspor Football Club. The token currently trades at $0.2272 with a circulating supply of 7,768,000 TRA (77.68% of total supply). Long-term value proposition hinges on the club's performance, fan engagement metrics, and the broader adoption of fan tokens in sports. Short-term risks include continued price decline trends (down 13.28% over 7 days) and limited liquidity. Investors should view TRA as a high-risk, speculative asset with volatility influenced by both crypto market conditions and team-specific factors.
TRA Investment Recommendations
✅ Beginners: Start with minimal allocation (under 2% of portfolio); prioritize learning about fan token mechanics before investing
✅ Experienced Investors: Consider TRA for portfolio diversification within sports crypto sector; maintain strict position limits given recent decline trends
✅ Institutional Investors: Evaluate TRA within broader fan token basket strategies; conduct due diligence on Trabzonspor's fan engagement metrics
TRA Trading Participation Methods
- Spot Trading: Available on Gate.com with CHZ2 chain support; verify current trading pairs before executing orders
- Dollar-Cost Averaging: Consider gradual accumulation strategy to mitigate timing risk, especially during downward trends
- Gate Web3 Wallet Integration: Utilize Gate Web3 Wallet for seamless trading and secure storage of TRA tokens
Cryptocurrency investment carries extremely high risks, and this article does not constitute investment advice. Investors should make prudent decisions based on their own risk tolerance and are advised to consult professional financial advisors. Never invest more than you can afford to lose.
FAQ
TRA is a utility token designed for decentralized risk assessment and transaction verification in Web3 ecosystems. It enables users to evaluate transaction safety, manage portfolio risks, and participate in governance. TRA facilitates secure, transparent trading through community-driven risk analysis mechanisms.
How to conduct TRA price prediction? What are the commonly used analysis methods?
TRA price prediction commonly uses technical analysis(examining price charts and trading volume trends),fundamental analysis(evaluating project development and adoption),and on-chain metrics(tracking wallet activity and transaction flows). Machine learning models analyzing historical data patterns also help forecast future price movements.
TRA has experienced significant depreciation since launch. It reached an all-time high of $9.77 in April 2022, with a current drawdown exceeding 97%. Annual decline stands at 66.69%, with recent 30-day decline at 12.82%.
What are the main factors affecting TRA price?
TRA price is primarily influenced by supply mechanisms, institutional and whale movements, macroeconomic environment, and technological development. These factors collectively determine TRA's market performance and future value trajectory.
What are the risks and limitations of TRA price predictions?
Price predictions face market heterogeneity and volatility uncertainty risks. Methodological limitations may cause prediction errors. Complex market dynamics increase prediction difficulty, and models often overlook emerging factors affecting prices.
How difficult is price prediction for TRA compared to other similar tokens?
TRA price prediction presents moderate difficulty compared to similar tokens. Its unique blockchain fundamentals, trading volume patterns, and market sentiment create both challenges and opportunities for analysis. Success requires comprehensive data evaluation.
What are professional institutions or analysts predicting for TRA's future price?
Professional institutions predict TRA could trade between AED 0.95676 and AED 5.026 from 2028 to 2032, with peak projections reaching AED 5.026. Predictions are influenced by global cryptocurrency regulation and technological developments in the sector.
What technical indicators should be monitored when predicting TRA price?
Focus on Moving Average (MA) for trend analysis, Relative Strength Index (RSI) for momentum, trading volume for market strength, and MACD for price momentum confirmation. These indicators help identify trend reversals and support resistance levels effectively.
* The information is not intended to be and does not constitute financial advice or any other recommendation of any sort offered or endorsed by Gate.