This comprehensive guide delivers professional price forecasts and investment strategies for Polytrade (TRADE), a blockchain-based decentralized protocol revolutionizing accounts receivable financing. Currently trading at $0.04843 with a $4.84 million market cap, TRADE bridges traditional trade finance with crypto lending markets. The article combines historical price analysis, supply-demand dynamics, and macroeconomic insights to project TRADE's trajectory through 2031, with predictions ranging from $0.03154 to $0.08758. Featuring detailed investment methodologies for long-term holders and active traders, comprehensive risk management frameworks, and secure storage solutions via Gate Web3 Wallet, this analysis equips investors with actionable strategies while addressing regulatory challenges and technical risks inherent in real-world asset tokenization platforms.
Introduction: TRADE's Market Position and Investment Value
Polytrade (TRADE), a blockchain-based decentralized protocol transforming receivables financing, has been connecting buyers, sellers, insurers, and investors since its launch in 2021. As of 2026, TRADE maintains a market capitalization of approximately $4.84 million with a fully circulating supply of 100 million tokens, trading at around $0.048. This asset, known as a bridge between real-world receivables and crypto lending markets, is playing an increasingly important role in decentralized trade finance solutions.
This article provides a comprehensive analysis of TRADE's price trajectory from 2026 to 2031, combining historical patterns, market supply-demand dynamics, ecosystem developments, and macroeconomic conditions to deliver professional price forecasts and practical investment strategies for investors.
I. TRADE Price History Review and Current Market Status
TRADE Historical Price Evolution Trajectory
- 2021: Polytrade (TRADE) was launched on August 19, 2021, entering the decentralized finance market focusing on accounts receivable financing
- 2024: Token reached its all-time high of $3.03 on April 1, 2024, demonstrating strong market interest in real-world asset tokenization solutions
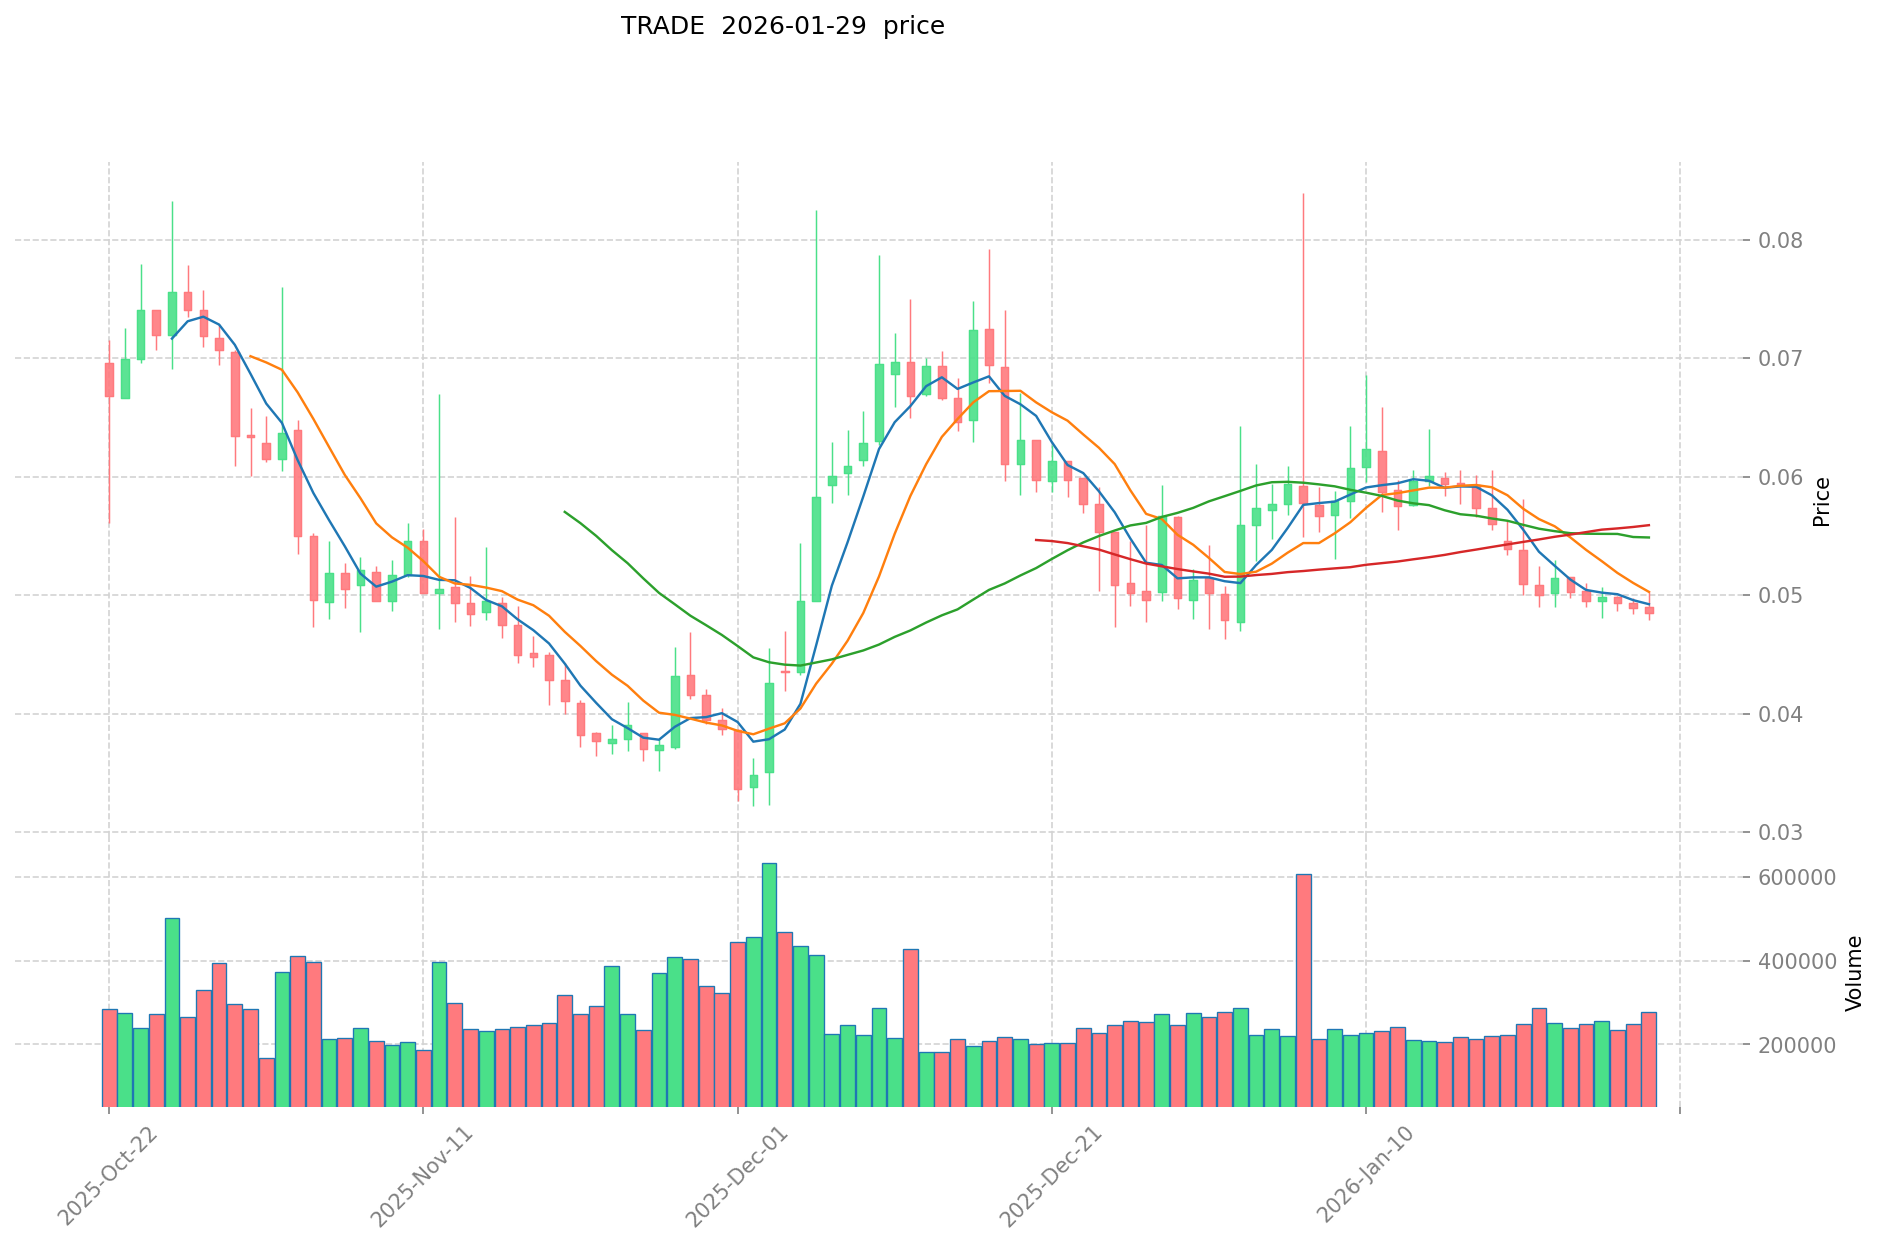
- 2025: Price experienced significant correction, reaching its all-time low of $0.03285692 on December 3, 2025, representing a decline of approximately 98.9% from its peak
TRADE Current Market Situation
As of January 29, 2026, TRADE is trading at $0.04843, showing a modest recovery of approximately 47.4% from its all-time low recorded in early December 2025. The token has demonstrated mixed short-term performance across different timeframes.
In the past hour, TRADE has gained 0.19%, with the price moving from approximately $0.0483 to its current level. However, the 24-hour performance shows a slight decline of 0.38%, with the price fluctuating between a high of $0.0504 and a low of $0.04795 during this period. The daily trading volume stands at $13,434.39, indicating relatively modest market activity.
Looking at broader timeframes, the token has declined 3.88% over the past week and 3.59% over the past 30 days, suggesting continued downward pressure in the near term. The most significant decline is observed in the one-year performance, where TRADE has fallen 90.05%, reflecting the broader correction in the cryptocurrency market and potential challenges in the accounts receivable financing sector.
The token maintains a fully circulating supply of 100 million TRADE tokens, with no maximum supply cap defined. The current market capitalization stands at approximately $4.84 million, representing 0.00015% of the total cryptocurrency market. With 100% of tokens in circulation, the market cap equals the fully diluted valuation, indicating complete token distribution.
TRADE is available on three exchanges and is held by 3,885 addresses, demonstrating a relatively small but established user base. The token has multi-chain presence with contract addresses on Ethereum, BSC, and Polygon networks, providing accessibility across different blockchain ecosystems.
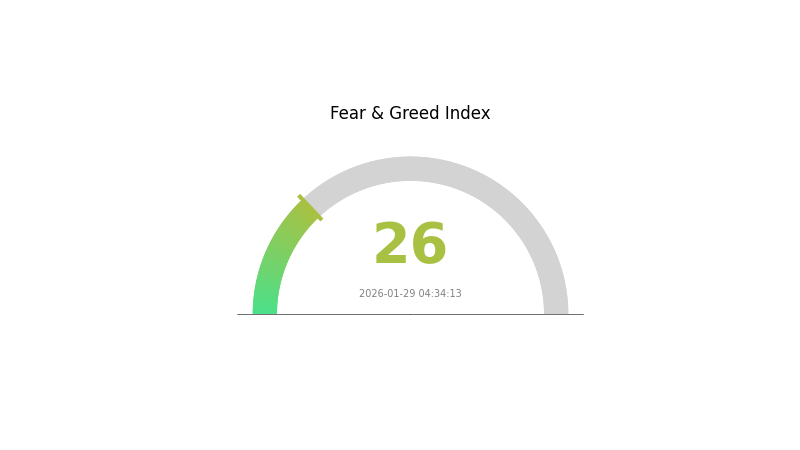
Current market sentiment analysis indicates a Fear Index reading of 26, suggesting cautious investor sentiment in the broader cryptocurrency market environment.
Click to view current TRADE market price
TRADE Market Sentiment Index
2026-01-29 Fear and Greed Index: 26 (Fear)
Click to view current Fear & Greed Index
Market Analysis:
The Fear and Greed Index stands at 26, indicating a strong fear sentiment in the cryptocurrency market. This level suggests heightened market pessimism and risk aversion among investors. When fear dominates, market participants tend to be cautious, leading to potential selling pressure and increased volatility. However, such fear-driven conditions often create buying opportunities for long-term investors seeking favorable entry points. Traders should exercise prudent risk management while remaining alert to market developments and potential reversals.
TRADE Token Holdings Distribution
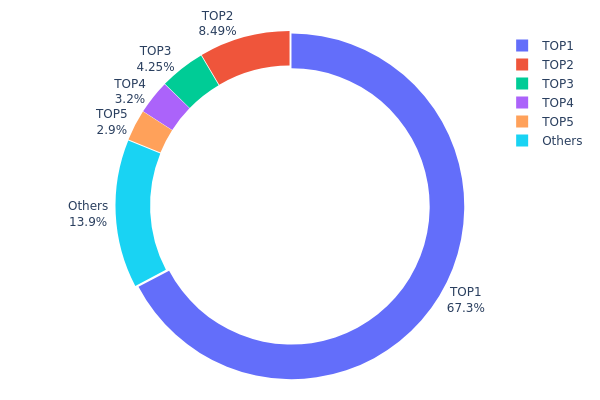
The token holdings distribution chart illustrates how TRADE tokens are allocated across different wallet addresses, providing crucial insights into the degree of decentralization and potential concentration risks within the ecosystem. This metric serves as a fundamental indicator of market structure health and potential vulnerability to large holder influence.
Based on the current data, TRADE exhibits significant concentration characteristics. The top holder controls approximately 67.30% of the total supply (67.306 million tokens), representing an exceptionally high concentration level. The top five addresses collectively hold 86.14% of the total token supply, while the remaining addresses account for only 13.86%. This distribution pattern reveals a highly centralized token structure that deviates substantially from ideal decentralization standards.
Such concentrated holdings present notable implications for market dynamics. The dominant position of the largest holder creates potential single-point risks, as any significant transaction from this address could trigger substantial price volatility. The relatively small proportion held by other addresses (13.86%) indicates limited token circulation in the broader market, which may constrain organic price discovery mechanisms and reduce market liquidity depth. This concentration structure also elevates the theoretical possibility of price manipulation, as major holders possess sufficient supply to influence market sentiment and trading patterns.
Click to view current TRADE Holdings Distribution
| Top |
Address |
Holding Qty |
Holding (%) |
| 1 |
0x40ec...5bbbdf |
67306.07K |
67.30% |
| 2 |
0x42ae...82108e |
8491.38K |
8.49% |
| 3 |
0x5207...22a9f8 |
4250.46K |
4.25% |
| 4 |
0xcd98...e7ff7e |
3200.00K |
3.20% |
| 5 |
0x0811...087f02 |
2900.00K |
2.90% |
| - |
Others |
13852.08K |
13.86% |
II. Core Factors Influencing TRADE's Future Price
Supply and Demand Dynamics
- Supply-Demand Relationship: Market price movements are fundamentally driven by the balance between supply and demand. When demand exceeds available supply, inventory levels decline and prices tend to rise. Conversely, when supply surpasses demand, inventory accumulation typically leads to price pressure.
- Historical Patterns: Supply-demand imbalances have consistently served as primary drivers of price fluctuations across trading markets. Historical cycles demonstrate that sustained supply constraints combined with robust demand can support extended price appreciation periods.
- Current Outlook: The interaction between current supply conditions and evolving demand patterns will likely continue shaping near-term price movements. Market participants should monitor inventory levels and consumption trends as key indicators.
Macroeconomic Environment
- Monetary Policy Impact: Central bank policies, including interest rate adjustments and liquidity management measures, can significantly influence asset prices. Policy shifts affecting the cost of capital and market liquidity conditions may create ripple effects across trading markets.
- Economic Growth Expectations: Broader economic recovery trajectories and GDP growth forecasts can reshape demand projections for various assets. Economic expansion typically supports increased market activity and capital flows.
- Currency Fluctuations: Exchange rate movements, particularly in the US dollar, can affect the relative pricing of dollar-denominated assets and influence international capital flows into trading markets.
Market Sentiment and Capital Flows
- Investor Sentiment: Market psychology and risk appetite play important roles in short-term price volatility. Shifts in sentiment driven by news events or technical developments can trigger rapid position adjustments.
- Capital Movement Patterns: The direction and magnitude of fund flows into or out of markets serve as indicators of institutional and retail positioning. Sustained capital inflows may provide price support while outflows can create headwinds.
- Liquidity Conditions: Market depth and trading volume levels affect price stability and the ease of executing large transactions without significant market impact.
Technical Analysis Considerations
- Price Patterns: Historical price formations and chart patterns provide insights into potential support and resistance levels that may influence future trading ranges.
- Market Structure: The technical positioning of markets, including momentum indicators and trend characteristics, can offer clues about potential directional bias and reversal points.
- Trading Volume: Volume analysis helps confirm price movements and identify potential shifts in market participation that may precede trend changes.
III. 2026-2031 TRADE Price Prediction
2026 Outlook
- Conservative Prediction: $0.03154 - $0.04928
- Neutral Prediction: $0.04928 (average expected price)
- Optimistic Prediction: $0.06456 (requires favorable market conditions and increased adoption)
2027-2029 Mid-term Outlook
- Market Stage Expectation: Gradual growth phase with potential for steady appreciation as the project matures and gains wider recognition
- Price Range Predictions:
- 2027: $0.04326 - $0.07456, representing approximately 17% growth from 2026 baseline
- 2028: $0.04076 - $0.08086, with potential 35% cumulative increase
- 2029: $0.04032 - $0.08503, showing possible 51% growth trajectory
- Key Catalysts: Platform development milestones, strategic partnerships expansion, and broader cryptocurrency market recovery trends
2030-2031 Long-term Outlook
- Baseline Scenario: $0.04671 - $0.07917 in 2030 (assuming steady ecosystem development and sustained user engagement)
- Optimistic Scenario: $0.08154 in 2030, reaching $0.08758 by 2031 (contingent upon accelerated adoption and favorable regulatory environment)
- Transformative Scenario: $0.08035 - $0.08758 range by 2031 (requires significant technological breakthroughs and mainstream institutional integration)
- 2031-01-29: TRADE could potentially reach approximately 65% cumulative growth from 2026 baseline (subject to market dynamics and project execution)
| Year |
Predicted High Price |
Predicted Average Price |
Predicted Low Price |
Price Change |
| 2026 |
0.06456 |
0.04928 |
0.03154 |
1 |
| 2027 |
0.07456 |
0.05692 |
0.04326 |
17 |
| 2028 |
0.08086 |
0.06574 |
0.04076 |
35 |
| 2029 |
0.08503 |
0.0733 |
0.04032 |
51 |
| 2030 |
0.08154 |
0.07917 |
0.04671 |
63 |
| 2031 |
0.08758 |
0.08035 |
0.0458 |
65 |
IV. TRADE Professional Investment Strategies and Risk Management
TRADE Investment Methodology
(I) Long-Term Holding Strategy
- Suitable for: Investors who believe in the potential of real-world asset tokenization and decentralized accounts receivable financing
- Operational Suggestions:
- Consider accumulating positions during market downturns, given TRADE's current price of $0.04843 is significantly below its all-time high
- Implement dollar-cost averaging to mitigate volatility risks, particularly given the token's 90.05% decline over the past year
- Storage Solution: Utilize Gate Web3 Wallet for secure custody, which supports multiple chains including ETH, BSC, and MATIC where TRADE is deployed
(II) Active Trading Strategy
- Technical Analysis Tools:
- Volume Analysis: Monitor the 24-hour trading volume of $13,434.39 to identify accumulation or distribution patterns
- Support and Resistance Levels: Track the 24-hour range between $0.04795 (low) and $0.0504 (high) for short-term trading opportunities
- Swing Trading Key Points:
- Consider taking profits during upward moves toward resistance levels while managing position sizes due to limited liquidity
- Set stop-loss orders below recent support levels to protect capital in this relatively volatile asset
TRADE Risk Management Framework
(I) Asset Allocation Principles
- Conservative Investors: 1-2% of crypto portfolio allocation
- Aggressive Investors: 3-5% of crypto portfolio allocation
- Professional Investors: Up to 10% with active monitoring and hedging strategies
(II) Risk Hedging Solutions
- Portfolio Diversification: Balance TRADE exposure with established cryptocurrencies and stablecoins to manage concentration risk
- Position Sizing: Limit individual position size based on the token's relatively small market cap of $4.843 million and limited exchange availability (listed on 3 exchanges)
(III) Secure Storage Solutions
- Multi-Chain Wallet Recommendation: Gate Web3 Wallet, which supports TRADE across Ethereum, BSC, and Polygon networks
- Cold Storage Option: For larger holdings, consider transferring to hardware wallet solutions after initial purchase
- Security Precautions: Enable two-factor authentication, verify contract addresses (ETH: 0x6e5970dbd6fc7eb1f29c6d2edf2bc4c36124c0c1, BSC: 0x6ba7a8f9063c712c1c8cabc776b1da7126805f3b, MATIC: 0x692AC1e363ae34b6B489148152b12e2785a3d8d6) before transactions, and never share private keys
V. TRADE Potential Risks and Challenges
TRADE Market Risks
- Liquidity Risk: With a market capitalization of only $4.843 million and ranking at 1544, TRADE faces limited trading depth and potential for high price volatility
- Price Volatility: The token has experienced a 90.05% decline over the past year, demonstrating susceptibility to broader market downturns and sector-specific challenges
- Market Share: With only 0.00015% market dominance, TRADE remains vulnerable to competitive pressures from larger DeFi and RWA projects
TRADE Regulatory Risks
- Real-World Asset Compliance: As a platform connecting traditional accounts receivable financing with blockchain technology, TRADE may face evolving regulatory scrutiny regarding securities laws and trade finance regulations
- Cross-Border Operations: The platform's involvement with buyers, sellers, insurers, and investors across jurisdictions introduces regulatory complexity
- Licensing Requirements: Traditional finance integration may require various licenses and regulatory approvals that could impact operational scalability
TRADE Technical Risks
- Smart Contract Vulnerabilities: Multi-chain deployment across Ethereum, BSC, and Polygon networks increases the attack surface and requires rigorous security audits
- Bridge Risk: Cross-chain functionality introduces potential vulnerabilities in asset transfers between different blockchain networks
- Platform Dependency: The protocol's reliance on connecting multiple parties (buyers, sellers, insurers, investors) creates technical complexity and potential points of failure
VI. Conclusion and Action Recommendations
TRADE Investment Value Assessment
Polytrade (TRADE) represents an innovative approach to bridging traditional accounts receivable financing with decentralized finance infrastructure. The platform's vision of providing low-interest, accessible financing for real-world borrowers while bringing insured real-world assets to crypto markets addresses a genuine market need. However, investors should carefully weigh the long-term value proposition against current challenges, including the token's significant price decline (down 90.05% over one year), limited liquidity with a market cap of $4.843 million, and competition in the emerging RWA tokenization space. The fully diluted market cap equals current market cap (100% circulation), eliminating token unlock concerns, but the small holder base of 3,885 addresses indicates limited adoption thus far.
TRADE Investment Recommendations
✅ Beginners: Start with a small allocation (no more than 1-2% of crypto portfolio) to gain exposure while learning about RWA tokenization. Use Gate.com for initial purchases and Gate Web3 Wallet for secure storage across supported chains
✅ Experienced Investors: Consider TRADE as a speculative position within a diversified DeFi portfolio, allocating 3-5% while actively monitoring project developments, partnership announcements, and platform adoption metrics. Implement strict stop-loss strategies given historical volatility
✅ Institutional Investors: Conduct thorough due diligence on the platform's regulatory compliance, insurance mechanisms, and real-world business traction before considering strategic positions. Evaluate opportunities for direct engagement with the protocol's governance and development
TRADE Trading Participation Methods
- Spot Trading: Purchase TRADE on Gate.com or other supported exchanges, taking advantage of the fully circulating supply and multi-chain availability
- Dollar-Cost Averaging: Implement systematic accumulation strategies during periods of market weakness to build positions at favorable average prices
- Multi-Chain Strategy: Utilize TRADE across Ethereum, BSC, and Polygon networks based on transaction cost optimization and DeFi integration opportunities
Cryptocurrency investment carries extremely high risks, and this article does not constitute investment advice. Investors should make prudent decisions based on their own risk tolerance and are advised to consult professional financial advisors. Never invest more than you can afford to lose.
FAQ
What is the historical price trend of TRADE token? What are the main factors affecting its price fluctuations?
TRADE token has experienced significant price volatility influenced by market sentiment, trading volume, regulatory developments, and broader crypto market trends. Bitcoin movements, institutional adoption, and macroeconomic factors notably impact TRADE's price direction and momentum.
How to conduct technical analysis on TRADE price? What are the commonly used technical indicators to help predict prices?
Common technical indicators for TRADE price analysis include Moving Average, RSI, and MACD. These tools help identify price trends and reversal points. Combine them with volume analysis to enhance prediction accuracy for market movements.
What is the fundamental situation of TRADE token? How do project development progress and ecosystem applications affect its price?
TRADE token's price is influenced by its earning and burning mechanisms that control supply. Project development and ecosystem expansion enhance market confidence and drive price appreciation through increased utility and adoption.
What are professional analysts' price predictions for TRADE? What are the basis and assumptions behind these predictions?
TRADE's future price depends on market adoption, trading volume growth, and ecosystem development. Analysts typically base predictions on technical trends, on-chain metrics, and tokenomics fundamentals. However, cryptocurrency prices remain highly volatile and unpredictable due to market sentiment and external factors.
What are the main risks of investing in TRADE for price prediction trading? How to manage risks?
Main risks include market volatility, liquidity risk, and leverage risk. Manage risk through diversification, position sizing, stop-loss orders, and never investing more than you can afford to lose.
TRADE demonstrates strong market fundamentals with competitive advantages in transaction volume and utility. Compared to similar tokens, TRADE shows robust growth potential driven by increasing adoption and ecosystem expansion, positioning it for significant upside as the market matures.
* The information is not intended to be and does not constitute financial advice or any other recommendation of any sort offered or endorsed by Gate.