This comprehensive guide analyzes Tharwa (TRWA) token's price trajectory from 2026 to 2031, offering professional forecasts and investment strategies for crypto investors. TRWA, trading at $0.0009987 with a $6.99 million market cap, presents moderate growth potential driven by ecosystem adoption and governance participation. The article examines historical price evolution, current market sentiment (Fear index: 29), and holding distribution patterns. Key forecasts include 2026 trading around $0.001, with gradual appreciation to approximately $0.0015 by 2031, suggesting 50% potential growth. The guide provides three investment approaches—long-term holding, active trading, and staking participation—alongside comprehensive risk management frameworks. Essential considerations include high volatility, limited liquidity ($209K daily volume), and regulatory uncertainties. Beginners should allocate 1-2% of crypto portfolios, while experienced investors may consider 3-7% positions on Gate exchange, prioritizing secure
Introduction: TRWA's Market Position and Investment Value
Tharwa (TRWA), as a governance and utility token within the decentralized finance ecosystem, has been actively developing since its launch in 2025. As of January 28, 2026, TRWA maintains a market capitalization of approximately $6.99 million, with a circulating supply of 7 billion tokens, and trades at around $0.0009987. This asset, designed to align holders with protocol performance through vaults, staking, and governance mechanisms, is playing an increasingly significant role in the decentralized finance landscape.
This article will comprehensively analyze TRWA's price trends from 2026 to 2031, combining historical patterns, market supply and demand dynamics, ecosystem development, and macroeconomic conditions to provide investors with professional price forecasts and practical investment strategies.
I. TRWA Price History Review and Market Status
TRWA Historical Price Evolution Trajectory
- 2025: Token launched in July and experienced significant growth, reaching an all-time high of $0.0128 in September
- 2025-2026: Market correction phase, price declined from the September peak
- 2026: Reached historical low of $0.0006851 in January, representing a substantial retracement from previous highs
TRWA Current Market Situation
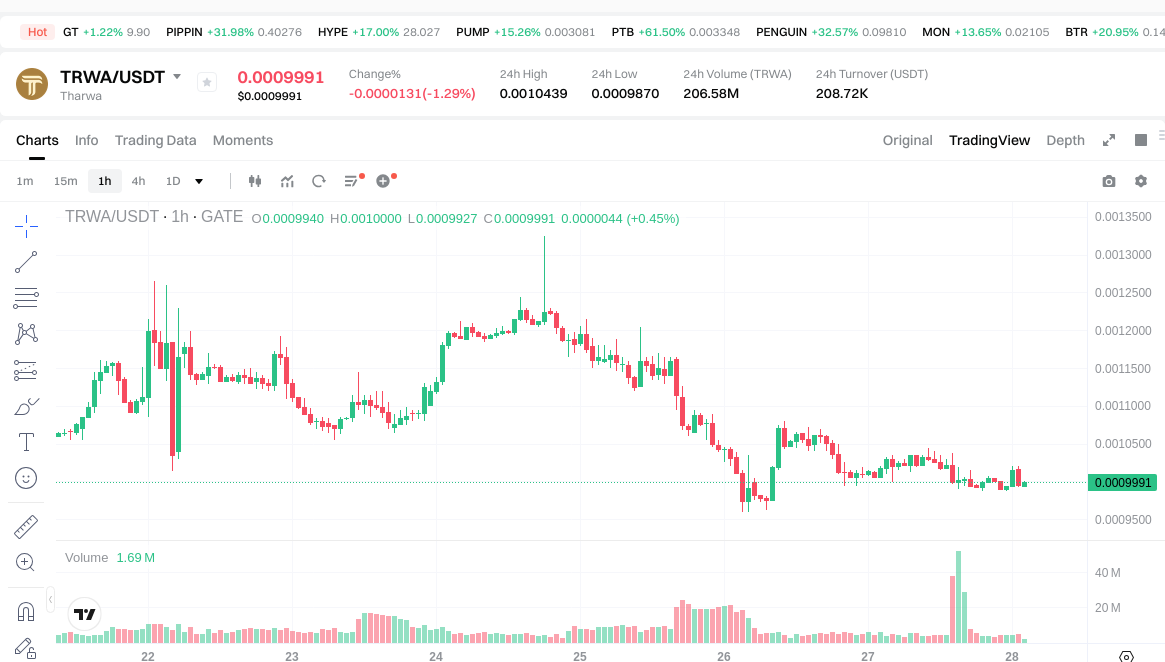
As of January 28, 2026, TRWA is trading at $0.0009987, positioned between its historical extremes. The token ranks #1370 in market capitalization with a total market cap of approximately $6.99 million. Current circulating supply stands at 7 billion tokens, representing 70% of the maximum supply of 10 billion tokens.
The token's fully diluted market capitalization is approximately $9.99 million, with a market cap to FDV ratio of 70%. Trading volume over the past 24 hours reached $209,333, indicating moderate market activity. The token holder base has grown to 8,320 addresses.
Recent price action shows mixed short-term performance, with a 1-hour decline of 0.58% and 24-hour decrease of 1.05%. The 7-day and 30-day trends reflect broader retracements of 6.95% and 13.27% respectively. However, the 1-year perspective demonstrates substantial growth of 1226.50% from earlier price levels.
TRWA maintains a market dominance of 0.00032% within the broader cryptocurrency ecosystem. The current price represents approximately 7.8% of its all-time high, suggesting significant distance from peak valuations. The cryptocurrency market sentiment index currently indicates a "Fear" reading of 29.
Click to view current TRWA market price
TRWA Market Sentiment Index
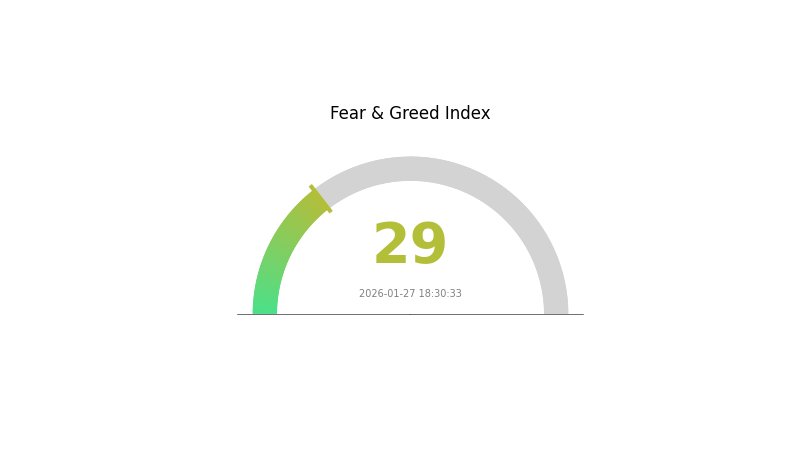
2026-01-27 Fear and Greed Index: 29 (Fear)
Click to view current Fear & Greed Index
Current market sentiment shows significant fear with an index reading of 29, indicating heightened investor anxiety in the crypto market. This low reading suggests risk-averse positioning and potential capitulation among market participants. During such fearful conditions, experienced investors often view this as an opportunity to accumulate assets at lower valuations. However, caution remains warranted as further downside pressure may emerge. Monitor key support levels closely and consider dollar-cost averaging strategies to mitigate volatility exposure during this uncertain period.
TRWA Holding Distribution
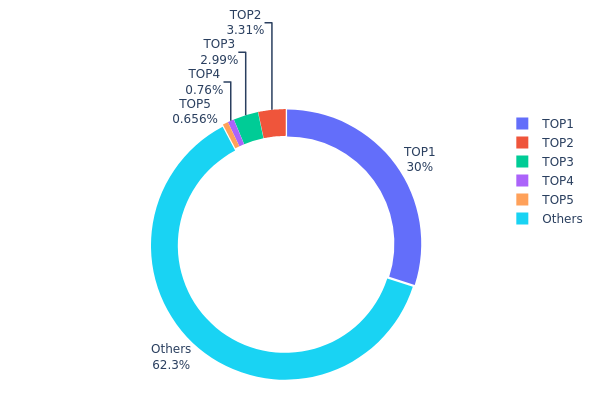
The holding distribution chart reflects the concentration level of token holdings across different wallet addresses on the blockchain, serving as a critical indicator for assessing market structure and decentralization characteristics. By analyzing the proportion of tokens held by top addresses versus the broader holder base, investors can gain insights into potential market manipulation risks, price volatility patterns, and the overall health of the token's distribution ecosystem.
According to the current data, TRWA exhibits a moderately concentrated holding structure. The top-ranked address controls approximately 29.97% of the total supply, holding nearly 3 million tokens, which represents a significant but not excessive concentration level. The top five addresses collectively account for 37.66% of total holdings, while the remaining 62.34% is distributed among other addresses. This distribution pattern suggests that while there is a dominant holder presence, the majority of tokens remain dispersed across the broader market, indicating a relatively balanced ecosystem compared to projects with extreme centralization.
From a market structure perspective, this holding distribution presents both opportunities and considerations. The substantial holding by the top address could provide price stability during market downturns, as large holders typically adopt longer-term investment horizons. However, it also introduces potential volatility risks if major holders decide to liquidate positions. The fact that over 60% of tokens are held by smaller addresses demonstrates reasonable decentralization, which generally contributes to more organic price discovery and reduces single-point manipulation risks. This distribution structure reflects a maturing market where institutional and retail participation coexist, supporting sustainable on-chain activity and market resilience.
Click to view the current TRWA Holding Distribution
| Top |
Address |
Holding Qty |
Holding (%) |
| 1 |
0xe58d...0160c3 |
2997489.02K |
29.97% |
| 2 |
0x9642...2f5d4e |
331120.23K |
3.31% |
| 3 |
0xd984...c6c3e9 |
298844.81K |
2.98% |
| 4 |
0x9da8...e48878 |
75976.97K |
0.75% |
| 5 |
0x0d07...b492fe |
65616.64K |
0.65% |
| - |
Others |
6230952.34K |
62.34% |
II. Core Factors Influencing TRWA's Future Price
Market Demand and Adoption Trends
- Market Demand Dynamics: TRWA's price outlook is influenced by market demand, adoption trends, and institutional participation. Understanding the token's economics and historical price movements can help investors better assess future price trends.
- Growth Projections: Analysis suggests a potential annual growth rate of approximately 5% for TRWA against CNY, reflecting moderate market expectations based on current adoption patterns.
- Market Sentiment: Historical price trajectories and prevailing market sentiment play important roles in shaping TRWA's valuation, with technical indicators providing valuable reference points for investors.
Technical Indicators and Trading Activity
- Price Movement Analysis: For actively traded RWA tokens like TRWA, technical indicators including price trends and trading volume offer significant analytical value for investors.
- Key Support Levels: Monitoring whether token prices breach critical support levels provides insights into potential market direction shifts.
- Trading Volume Patterns: Volume analysis helps identify investor confidence and potential trend reversals in TRWA's market performance.
Broader Economic Factors
- Macroeconomic Environment: TRWA's price performance is subject to broader economic factors that affect the cryptocurrency market as a whole.
- Market Participation: The level of institutional and retail participation influences liquidity and price stability in TRWA trading pairs.
- Economic Indicators: Various economic factors contribute to the token's valuation, though specific policy details were not available in the reference materials.
III. 2026-2031 TRWA Price Prediction
2026 Outlook
- Conservative forecast: $0.00057
- Neutral forecast: $0.001
- Optimistic forecast: $0.00105
Based on available projections, TRWA is expected to maintain relatively stable price levels throughout 2026, with the token potentially trading within a narrow range. The average price target sits around $0.001, suggesting limited volatility in the near term.
2027-2029 Outlook
- Market stage expectation: Early growth phase with gradual price appreciation
- Price range forecast:
- 2027: $0.00057 - $0.00135 (average $0.00102)
- 2028: $0.0008 - $0.00128 (average $0.00119)
- 2029: $0.00069 - $0.00172 (average $0.00124)
- Key catalysts: Market adoption trends and broader cryptocurrency ecosystem developments
During this mid-term period, TRWA shows potential for modest appreciation, with 2027 projecting a 2% price change and subsequent years indicating gradual growth momentum. The 2028 forecast suggests an 18% increase, while 2029 could see approximately 23% growth compared to baseline levels.
2030-2031 Long-term Outlook
- Baseline scenario: $0.00075 - $0.00152 (assuming steady market conditions)
- Optimistic scenario: $0.00142 - $0.00165 (assuming favorable adoption metrics)
- Transformative scenario: Sustained growth trajectory with potential 47-50% appreciation in later years
Long-term projections indicate TRWA could experience more substantial growth, with 2030 forecasting a 47% potential increase and 2031 showing a possible 50% appreciation. The average price in 2030 is estimated at $0.00148, rising to $0.0015 in 2031, suggesting a maturing market position.
- 2026-01-28: TRWA $0.001 (current average projection level)
| Year |
Predicted High Price |
Predicted Average Price |
Predicted Low Price |
Price Change |
| 2026 |
0.00105 |
0.001 |
0.00057 |
0 |
| 2027 |
0.00135 |
0.00102 |
0.00057 |
2 |
| 2028 |
0.00128 |
0.00119 |
0.0008 |
18 |
| 2029 |
0.00172 |
0.00124 |
0.00069 |
23 |
| 2030 |
0.00152 |
0.00148 |
0.00075 |
47 |
| 2031 |
0.00165 |
0.0015 |
0.00142 |
50 |
IV. TRWA Professional Investment Strategies and Risk Management
TRWA Investment Methodology
(I) Long-term Holding Strategy
- Target Investors: Investors who believe in Tharwa's long-term value proposition and are willing to participate in protocol governance
- Operational Recommendations:
- Consider accumulating positions during market downturns when TRWA trades closer to its historical low of $0.0006851
- Actively participate in staking mechanisms to earn rewards while contributing to protocol security
- Storage Solution: Use Gate Web3 Wallet for secure storage with convenient access to staking and governance features
(II) Active Trading Strategy
- Technical Analysis Tools:
- Moving Averages: Monitor 7-day and 30-day trends to identify entry points, noting the current -6.95% weekly and -13.27% monthly performance
- Volume Analysis: Track the 24-hour trading volume of $209,333 to assess market liquidity and trading opportunities
- Swing Trading Points:
- Consider the 24-hour price range between $0.000987 and $0.0010439 for short-term trading opportunities
- Monitor the 1-hour price movements (currently -0.58%) for intraday trading decisions
TRWA Risk Management Framework
(I) Asset Allocation Principles
- Conservative Investors: 1-3% of crypto portfolio
- Aggressive Investors: 5-10% of crypto portfolio
- Professional Investors: Up to 15% of crypto portfolio with active hedging strategies
(II) Risk Hedging Solutions
- Portfolio Diversification: Balance TRWA holdings with established cryptocurrencies to reduce volatility exposure
- Position Sizing: Avoid concentrating more than recommended percentages in a single mid-cap token
(III) Secure Storage Solutions
- Hot Wallet Recommendation: Gate Web3 Wallet for convenient access to trading and staking features
- Cold Storage Solution: For long-term holdings exceeding $10,000, consider hardware wallet storage with regular security audits
- Security Precautions: Never share private keys, enable two-factor authentication, and verify contract addresses (0x7b10d50b5885be4c7985a88408265c109bd1eec8) before transactions
V. TRWA Potential Risks and Challenges
TRWA Market Risks
- High Volatility: With a 24-hour change of -1.05% and 7-day change of -6.95%, TRWA demonstrates significant short-term price fluctuations
- Limited Liquidity: Daily trading volume of approximately $209,333 indicates moderate liquidity, which may result in slippage during large transactions
- Market Cap Position: Ranked at #1370 with a market cap of $6.99 million, representing only 0.00032% market dominance, indicating higher risk compared to established projects
TRWA Regulatory Risks
- Token Classification Uncertainty: As a governance and utility token, TRWA may face evolving regulatory scrutiny regarding its classification
- Jurisdictional Restrictions: Potential restrictions on token trading or staking activities in certain regions may affect accessibility
- Compliance Requirements: Future regulatory changes may require additional compliance measures that could impact token utility
TRWA Technical Risks
- Smart Contract Vulnerabilities: As an ERC-20 token deployed on Ethereum, TRWA is subject to potential smart contract bugs or exploits
- Protocol Dependency: The token's value is tied to the performance and security of the Tharwa protocol infrastructure
- Network Congestion: Ethereum network congestion may result in higher transaction fees and slower processing times
VI. Conclusion and Action Recommendations
TRWA Investment Value Assessment
Tharwa (TRWA) presents a unique value proposition by offering holders genuine participation rights aligned with protocol performance across vaults, staking, and governance. With a circulating supply of 7 billion tokens (70% of total supply) and 8,320 holders, the project demonstrates moderate community adoption. The token's remarkable 1-year performance of +1226.50% indicates strong historical growth, though recent trends show consolidation with -13.27% monthly performance. The fully diluted market cap of approximately $9.99 million suggests potential upside if the project successfully executes its roadmap, but investors should remain cautious given the token's mid-cap status and market volatility.
TRWA Investment Recommendations
✅ Beginners: Start with a small allocation (1-2% of crypto portfolio) and focus on understanding the protocol's governance and staking mechanisms before increasing exposure
✅ Experienced Investors: Consider a moderate position (3-7% of crypto portfolio) with active participation in staking to maximize utility and potential rewards
✅ Institutional Investors: Conduct thorough due diligence on the protocol's technical infrastructure and team credentials, considering positions up to 10% with appropriate hedging strategies
TRWA Trading Participation Methods
- Spot Trading: Purchase TRWA directly on Gate.com and other supported exchanges for immediate ownership and access to protocol features
- Staking Programs: Participate in Tharwa's staking mechanisms to earn rewards while supporting protocol security
- Governance Participation: Use TRWA tokens to vote on protocol proposals and influence the project's future direction
Cryptocurrency investment carries extremely high risks, and this article does not constitute investment advice. Investors should make prudent decisions based on their own risk tolerance and are advised to consult professional financial advisors. Never invest more than you can afford to lose.
FAQ
TRWA has experienced significant volatility over the past year. Recent weekly data shows the highest point at ¥0.00624067 and lowest at ¥0.00563535. The overall trend demonstrates fluctuation, indicating a dynamic market performance worthy of continued monitoring.
Use technical and fundamental analysis to predict TRWA price. CoinGecko provides price charts and market cap data. Common tools include moving averages, trading volume analysis, and on-chain metrics monitoring.
What are the main factors affecting TRWA price? How do market sentiment, project progress, and macroeconomic environment impact its price?
TRWA price is primarily driven by market sentiment and news, project development milestones, trading volume, and macroeconomic factors. Positive project updates and regulatory clarity boost price, while market uncertainty and broader crypto trends create volatility. Strong ecosystem growth correlates with long-term price appreciation.
What are the advantages or disadvantages of TRWA compared to other similar tokens?
TRWA excels in real-world asset tokenization with superior liquidity and transparent on-chain settlement. Its advantages include lower transaction costs, faster settlement times, and stronger regulatory compliance frameworks compared to peers. Disadvantages may include limited ecosystem integration and smaller trading volume compared to established RWA tokens.
What risk factors should I focus on when investing in TRWA? How volatile is the price?
TRWA price fluctuates between 0.06-0.07 USD with notable volatility. Key risks include market sentiment shifts, execution risks, and trading volume fluctuations. Current market conditions show cautious optimism but require careful monitoring of price movements.
What is the fundamental outlook of the TRWA project? What are the team background, technological innovation, and application scenarios?
TRWA is developed by an experienced team with leading blockchain technological innovation. The project focuses on decentralized finance and smart contract platforms, offering robust infrastructure for Web3 applications and demonstrating strong fundamental value.
* The information is not intended to be and does not constitute financial advice or any other recommendation of any sort offered or endorsed by Gate.