This comprehensive analysis examines TURTLE's price trajectory from 2026 through 2031, providing investors with data-driven forecasts and strategic guidance. Currently trading at $0.05866 with a $9.07 million market cap, TURTLE operates as an innovative DeFi distribution protocol monetizing Web3 activities. The article reviews historical performance, identifies key price drivers including supply mechanisms, whale dynamics, and macroeconomic factors, then projects price ranges: 2026 ($0.0558-$0.0670), 2027-2029 ($0.0352-$0.1076), and 2030-2031 ($0.0771-$0.1309). Professional investment strategies address long-term holding and active trading approaches, complemented by comprehensive risk management frameworks. Detailed analysis of market concentration, technical development, and regulatory considerations equips traders with actionable insights for TURTLE trading on Gate and navigating this early-stage DeFi asset's volatile landscape.
Introduction: TURTLE's Market Position and Investment Value
Turtle (TURTLE), as the first Distribution Protocol that monetizes Web3 activity by tracking user wallet activity, has established a unique position in the DeFi ecosystem since its launch in 2025. As of January 2026, TURTLE maintains a market capitalization of approximately $9.07 million, with a circulating supply of around 154.7 million tokens and a current price of $0.05866. This asset, which serves as a safeguarding layer in DeFi, is playing an increasingly important role in aligning incentives among liquidity providers, developers, venture capitalists, security auditors, and miners.
This article will comprehensively analyze TURTLE's price trends from 2026 to 2031, combining historical patterns, market supply and demand dynamics, ecosystem development, and macroeconomic conditions to provide investors with professional price forecasts and practical investment strategies.
I. TURTLE Price History Review and Market Status
TURTLE Historical Price Evolution Trajectory
- October 2025: TURTLE reached a significant price milestone at $0.26998 on October 22, 2025, representing a notable peak in its early trading period
- January 2026: Price experienced downward pressure, reaching $0.04801 on January 19, 2026, reflecting broader market adjustments
TURTLE Current Market Situation
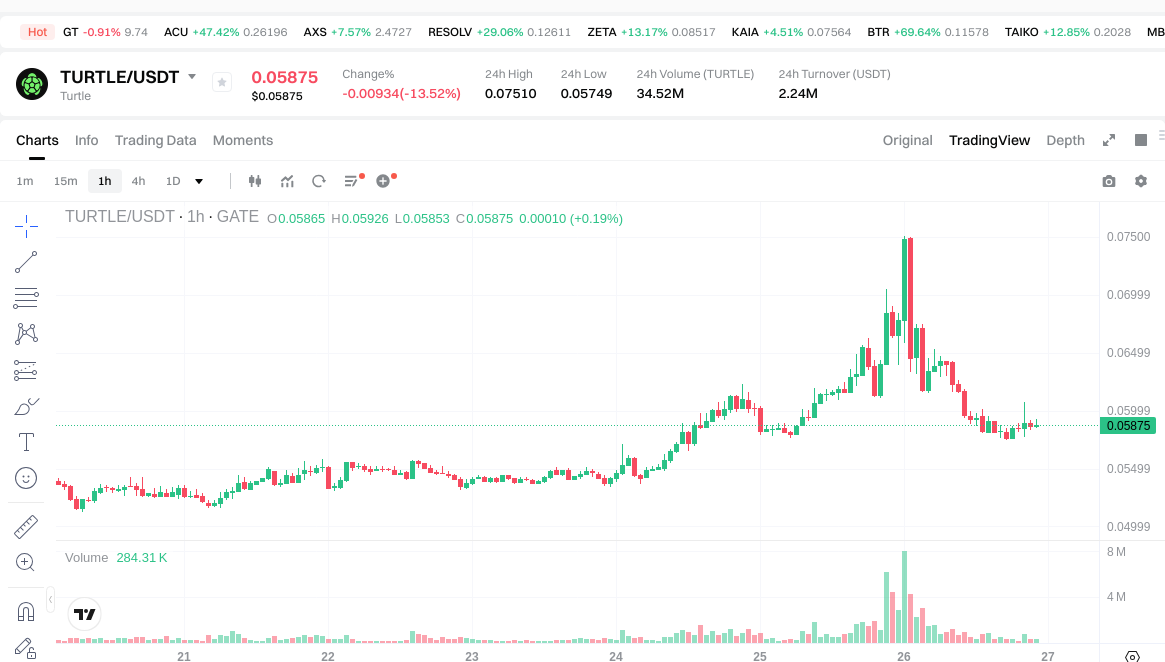
As of January 26, 2026, TURTLE is trading at $0.05866, showing a recovery of approximately 22% from its recent low recorded a week earlier. The token demonstrates mixed short-term momentum, with a decline of 0.2% over the past hour and a more pronounced decrease of 13% in the 24-hour period. The 24-hour trading range spans from $0.05749 to $0.0751, indicating substantial intraday volatility.
Over a seven-day period, TURTLE has shown resilience with an 11.5% increase, suggesting some recovery momentum from recent lows. However, the 30-day performance reveals a 2.32% decline, reflecting ongoing consolidation in the broader timeframe.
With a market capitalization of approximately $9.07 million and a fully diluted valuation of $58.66 million, TURTLE maintains a circulating supply of 154.7 million tokens, representing 15.47% of its maximum supply of 1 billion tokens. The 24-hour trading volume stands at approximately $2.28 million, indicating moderate market activity. TURTLE currently holds a market dominance of 0.0018% and ranks #1,246 among digital assets.
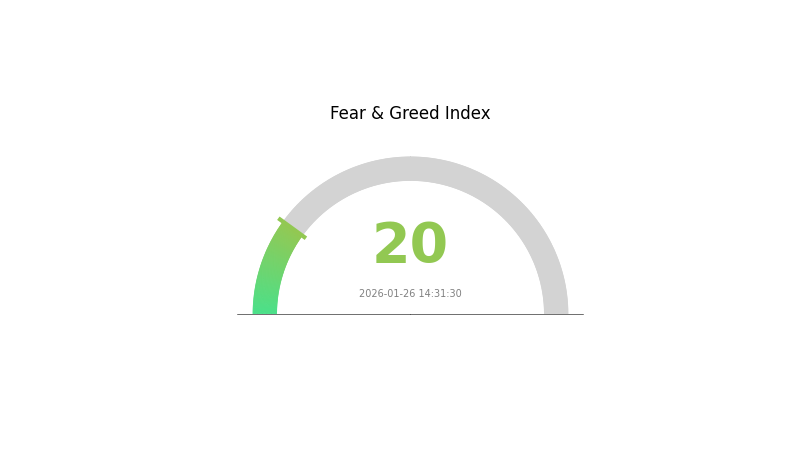
The current market sentiment index stands at 20, indicating an "Extreme Fear" environment, which may be influencing short-term price movements across the cryptocurrency sector.
Click to view current TURTLE market price
TURTLE Market Sentiment Indicator
2026-01-26 Fear and Greed Index: 20 (Extreme Fear)
Click to view current Fear & Greed Index
The crypto market is currently in a state of extreme fear with an index reading of 20. This indicates heightened market anxiety and risk aversion among investors. Extreme fear often presents contrarian opportunities, as markets tend to overcorrect during panic periods. Experienced traders frequently view such conditions as potential accumulation windows before sentiment stabilizes. However, caution is still advised as market volatility may continue. Monitor key support levels closely and consider dollar-cost averaging strategies rather than lump-sum investments during this uncertain period.
TURTLE Holding Distribution
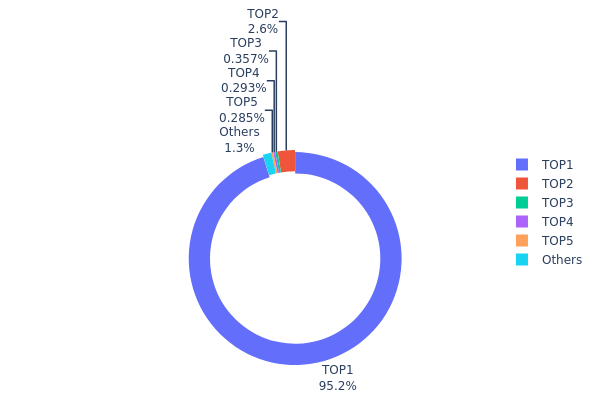
The holding distribution chart reflects the allocation of token supply across different addresses on the blockchain. By analyzing the concentration of holdings among top addresses versus smaller holders, this metric provides insights into token centralization, potential market manipulation risks, and overall ecosystem health.
Based on current data, TURTLE exhibits an extremely concentrated holding structure. The top address controls 665,797.13K tokens, representing an overwhelming 95.16% of total supply. The second-largest holder possesses only 2.59% (18,167.67K tokens), while addresses ranked 3rd through 5th each hold less than 0.4% of supply. The remaining addresses collectively account for merely 1.33% of total circulation. This distribution pattern reveals a highly centralized ownership model where a single entity maintains near-absolute control over token supply.
Such extreme concentration poses significant implications for market dynamics. The dominant address holder possesses sufficient liquidity to materially influence price discovery and trading patterns. This structural imbalance creates elevated volatility risk, as large-scale transfers or sales from the top address could trigger substantial price fluctuations. Additionally, the limited token distribution among smaller holders suggests restricted decentralization, potentially impacting community governance participation and long-term ecosystem resilience. From an on-chain structure perspective, this concentration level indicates that TURTLE's current market architecture remains heavily dependent on the actions of a single major stakeholder rather than demonstrating a broadly distributed holder base typical of mature digital assets.
Click to view current TURTLE Holding Distribution
| Top |
Address |
Holding Qty |
Holding (%) |
| 1 |
0x2e03...7f25b2 |
665797.13K |
95.16% |
| 2 |
0xf977...41acec |
18167.67K |
2.59% |
| 3 |
0x8893...60d48f |
2500.00K |
0.35% |
| 4 |
0x1157...8f4101 |
2049.99K |
0.29% |
| 5 |
0x9642...2f5d4e |
1991.54K |
0.28% |
| - |
Others |
9126.71K |
1.33% |
II. Core Factors Influencing TURTLE's Future Price
Supply Mechanism
- Fixed Supply Model: TURTLE token maintains a total fixed supply of 1 billion tokens, establishing scarcity as a fundamental value driver for the cryptocurrency.
- Historical Patterns: Historical data indicates that supply changes have triggered notable price fluctuations in TURTLE, with scarcity dynamics playing a significant role in price movements.
- Current Impact: The fixed supply structure continues to support potential long-term value appreciation, particularly as market demand evolves and ecosystem adoption expands.
Institutional and Whale Dynamics
- Whale Behavior: Large holder activities significantly impact TURTLE price movements, with major capital flows and concentrated trading volumes creating substantial market influence.
- Market Volume: Trading activity levels serve as a critical indicator, with increased volume often correlating with heightened price volatility and momentum shifts.
- Adoption Trends: Blockchain adoption patterns and broader cryptocurrency market sentiment contribute to TURTLE's price trajectory and investor confidence.
Macroeconomic Environment
- Market Sentiment Drivers: Price movements respond to news cycles, social media discussions, and overall investor confidence within the cryptocurrency sector.
- Regulatory Dynamics: Government policies and regulatory developments influence market conditions, affecting investor participation and institutional engagement.
- Broader Market Correlation: TURTLE's price remains subject to overall cryptocurrency market trends, with Bitcoin and major altcoin movements creating ripple effects across the sector.
Technical Development and Ecosystem Building
- Smart Liquidity Sharing Protocol: TURTLE operates as a Web3 token focused on intelligent liquidity sharing, connecting projects requiring liquidity enhancement with liquidity providers on blockchain networks like BNB Chain.
- DeFi Integration: The token's utility extends beyond typical meme characteristics, incorporating DeFi mechanics that reward liquidity providers while facilitating decentralized finance projects.
- Ecosystem Growth Strategy: Token allocation strategy aims to promote ecosystem expansion while rewarding early adopters and contributors, supporting long-term platform development and user engagement.
III. 2026-2031 TURTLE Price Prediction
2026 Outlook
- Conservative Prediction: $0.0558-$0.0587
- Neutral Prediction: $0.0587
- Optimistic Prediction: $0.0670 (requires favorable market conditions and increased adoption)
2027-2029 Outlook
- Market Stage Expectation: A gradual recovery phase is anticipated, with potential moderate volatility as the asset seeks to establish stronger market positioning
- Price Range Predictions:
- 2027: $0.0352-$0.0824
- 2028: $0.0617-$0.0929
- 2029: $0.0422-$0.1076
- Key Catalysts: Market sentiment shifts, broader cryptocurrency adoption trends, and potential technological developments within the TURTLE ecosystem may serve as primary drivers
2030-2031 Long-term Outlook
- Baseline Scenario: $0.0771-$0.1047 (assuming stable market conditions and continued project development)
- Optimistic Scenario: $0.0952-$0.1309 (with enhanced ecosystem growth and positive regulatory developments)
- Transformative Scenario: Up to $0.1309 (under exceptionally favorable conditions including widespread adoption and significant partnerships)
- 2026-01-26: TURTLE $0.0587 (baseline average projection for initial year)
| Year |
Predicted High Price |
Predicted Average Price |
Predicted Low Price |
Price Change |
| 2026 |
0.06698 |
0.05875 |
0.05581 |
0 |
| 2027 |
0.08235 |
0.06286 |
0.0352 |
7 |
| 2028 |
0.09294 |
0.07261 |
0.06172 |
23 |
| 2029 |
0.1076 |
0.08277 |
0.04221 |
41 |
| 2030 |
0.10471 |
0.09519 |
0.0771 |
62 |
| 2031 |
0.13093 |
0.09995 |
0.07396 |
70 |
IV. TURTLE Professional Investment Strategies and Risk Management
TURTLE Investment Methodology
(I) Long-term Holding Strategy
- Target Investors: DeFi enthusiasts and investors seeking exposure to Web3 distribution protocols
- Operational Recommendations:
- Consider accumulating positions during market corrections, as TURTLE's 24-hour decline of 13% may present potential entry opportunities
- Monitor the project's development milestones and protocol partnerships that could enhance liquidity routing capabilities
- Gate Web3 Wallet provides secure storage solutions with multi-chain support including ETH, BSC, and Linea networks
(II) Active Trading Strategy
- Technical Analysis Tools:
- Volume Analysis: Current 24-hour trading volume of approximately $2.28 million suggests moderate liquidity levels for shorter-term trading
- Price Range Monitoring: Recent 24-hour range between $0.05749 and $0.0751 indicates volatility suitable for swing trading
- Swing Trading Key Points:
- The 7-day price increase of 11.5% demonstrates potential short-term momentum patterns
- Consider position sizing relative to the circulating supply of 154.7 million tokens (15.47% of max supply)
TURTLE Risk Management Framework
(I) Asset Allocation Principles
- Conservative Investors: 1-3% of crypto portfolio allocation
- Aggressive Investors: 5-8% of crypto portfolio allocation
- Professional Investors: Up to 10% with active monitoring and hedging strategies
(II) Risk Hedging Solutions
- Diversification Strategy: Balance TURTLE holdings with established DeFi blue-chip tokens to reduce protocol-specific exposure
- Position Management: Implement stop-loss orders considering the token's volatility range demonstrated by recent price movements
(III) Secure Storage Solutions
- Multi-chain Wallet Recommendation: Gate Web3 Wallet supports TURTLE across Ethereum, BSC, and Linea networks
- Hardware Wallet Solution: For larger holdings, consider transferring tokens to hardware wallets compatible with ERC-20 and BEP-20 standards
- Security Precautions: Never share private keys, verify contract addresses (ETH: 0x66fd8de541c0594b4dccdfc13bf3a390e50d3afd, BSC: 0x66fd8de541c0594b4dccdfc13bf3a390e50d3afd), and enable multi-factor authentication
V. TURTLE Potential Risks and Challenges
TURTLE Market Risks
- Limited Circulating Supply: With only 15.47% of max supply in circulation, potential token unlocks could create selling pressure
- Volatility Exposure: Recent 24-hour price decline of 13% demonstrates significant short-term price fluctuation risks
- Market Cap Position: Ranking at #1246 with a market cap of approximately $9.07 million indicates relatively early-stage market presence
TURTLE Regulatory Risks
- DeFi Protocol Classification: Distribution protocols tracking user wallet activity may face evolving regulatory scrutiny regarding data privacy and financial surveillance
- Multi-jurisdiction Deployment: Operations across Ethereum, BSC, and Linea networks involve compliance considerations across multiple regulatory frameworks
- Yield and Staking Mechanics: Monetization of liquidity deployment and staking activities could attract regulatory attention regarding securities classification
TURTLE Technical Risks
- Smart Contract Dependencies: Protocol relies on tracking mechanisms across multiple blockchain networks, creating potential technical vulnerabilities
- Protocol Integration Risks: Dependencies on routing through protocol partners introduce third-party risk factors
- Multi-chain Complexity: Deployment across three blockchain networks (Ethereum, BSC, Linea) increases technical maintenance and security audit requirements
VI. Conclusion and Action Recommendations
TURTLE Investment Value Assessment
Turtle presents an innovative approach to monetizing Web3 activities through a distribution protocol that aligns DeFi stakeholder incentives. The project's focus on transparency and due diligence in liquidity deployment addresses important market needs. However, with a market cap of approximately $9.07 million and relatively low circulating supply (15.47%), the token exhibits characteristics of an early-stage project with corresponding volatility. The recent 7-day price increase of 11.5% demonstrates market interest, while the 24-hour decline of 13% highlights short-term price risk. Long-term value depends on successful execution of the protocol's mission to provide a safeguarding layer in DeFi and expansion of protocol partnerships.
TURTLE Investment Recommendations
✅ Beginners: Start with minimal allocation (1-2% of crypto portfolio) to gain exposure while learning about DeFi distribution protocols; utilize Gate Web3 Wallet for secure multi-chain storage
✅ Experienced Investors: Consider moderate position sizing (3-5%) with active monitoring of protocol development and partnership announcements; implement technical analysis for entry/exit timing
✅ Institutional Investors: Conduct thorough due diligence on protocol mechanics and security audits; consider staged accumulation strategy given limited circulating supply and potential for token unlocks
TURTLE Trading Participation Methods
- Spot Trading: Available on 8 exchanges including Gate.com, with 24-hour trading volume of approximately $2.28 million
- Multi-chain Access: Trade across Ethereum, BSC, and Linea networks depending on gas fee considerations and preferred ecosystem
- Liquidity Provision: Participate in the protocol's core functionality by deploying liquidity through tracked mechanisms, though carefully review smart contract risks
Cryptocurrency investment carries extremely high risks, and this article does not constitute investment advice. Investors should make cautious decisions based on their own risk tolerance and are advised to consult professional financial advisors. Never invest more than you can afford to lose.
FAQ
What is TURTLE token? What are its uses and features?
TURTLE is a decentralized finance token designed to solve liquidity fragmentation and inefficiency issues. It enhances market dynamics through innovative liquidity allocation, provides governance rights, and offers yield opportunities for liquidity providers with aligned incentives.
TURTLE declined approximately 40% over the past year, currently trading at $0.0349 as of January 2026. Looking ahead, projections suggest potential recovery with an estimated 30-day target near $0.0584 based on growth models.
What are the main factors affecting TURTLE price?
TURTLE price is primarily influenced by whale behavior, trading volume, blockchain adoption trends, and overall crypto market sentiment. Large fund flows and trading activity significantly impact price fluctuations.
What is the TURTLE price prediction for 2024-2025?
TURTLE price predictions for 2024-2025 indicate strong market growth potential. Based on current market trends and technical analysis, TURTLE is positioned to show significant appreciation, driven by increasing adoption and ecosystem expansion. Market momentum suggests upward trajectory through 2025.
What is the difference between TURTLE and other mainstream cryptocurrencies?
TURTLE stands out with highly active community engagement and significant market capitalization. It focuses on decentralized finance innovation with a circulating supply of 154.7 million tokens and total market value of $181.71 million, distinguishing it from mainstream competitors.
What are the main risks of investing in TURTLE?
Main risks include market volatility, regulatory uncertainty, and project development challenges. Crypto market fluctuations and policy changes significantly impact TURTLE's value and liquidity.
What is TURTLE's market liquidity and trading volume like?
TURTLE demonstrates strong market liquidity with substantial trading activity. The token attracts significant trading volume during bull markets, with historical price movements showing 400% increases during peak periods. Liquidity fluctuates with overall market conditions but remains healthy for active traders.
What is the TURTLE project team and development roadmap?
TURTLE is developing a private server with new playable races, zones, and dungeons. The 2024-2025 roadmap includes Goblins, High Elves, and expanded content. Development continues through 2026 with ongoing updates and new features planned.
* The information is not intended to be and does not constitute financial advice or any other recommendation of any sort offered or endorsed by Gate.