This comprehensive analysis examines USUAL token's price trajectory from 2026 to 2031, providing investors with data-driven forecasts and strategic guidance. The article reviews USUAL's historical performance, market position, and the key factors driving its value, including supply mechanisms, macroeconomic conditions, and ecosystem development within the decentralized stablecoin infrastructure. Detailed price predictions suggest gradual recovery from 2027 through 2029, with potential long-term appreciation reaching 79% by 2031 under favorable conditions. The guide presents tailored investment methodologies for beginners, experienced traders, and institutional investors, emphasizing risk management frameworks and secure storage solutions on Gate. Critical analysis of regulatory challenges, market centralization risks, and technical vulnerabilities ensures investors understand both opportunities and downside risks before committing capital to this emerging RWA-backed governance token.
Introduction: USUAL's Market Position and Investment Value
Usual (USUAL), as a secure and decentralized fiat-backed stablecoin issuer, has been redistributing ownership and value through its governance token since its launch in December 2024. As of January 2026, USUAL has a market capitalization of approximately $46.11 million, with a circulating supply of about 1.61 billion tokens, and the price maintains around $0.02857. This asset, known as an innovative infrastructure project in the stablecoin ecosystem, is playing an increasingly important role in decentralized finance and value redistribution.
This article will comprehensively analyze USUAL's price trends from 2026 to 2031, combining historical patterns, market supply and demand dynamics, ecosystem development, and macroeconomic conditions to provide investors with professional price forecasts and practical investment strategies.
I. USUAL Price History Review and Market Status
USUAL Historical Price Evolution Trajectory
- 2024: USUAL token launched on Gate.com in December, reaching an all-time high of $1.6555 on December 20, 2024, demonstrating significant initial market enthusiasm
- 2025: Price experienced substantial correction throughout the year, declining from peak levels to a historical low of $0.00851 recorded on October 10, 2025, reflecting broader market adjustments
USUAL Current Market Situation
As of January 19, 2026, USUAL is trading at $0.02857, representing a decline of 7.14% over the past 24 hours. The token has shown mixed short-term performance, with a 1.03% increase in the last hour and a 7.77% gain over the past week. The 30-day performance indicates a 17.14% increase, suggesting some recovery momentum in recent weeks.
The 24-hour trading range spans from $0.02461 to $0.03127, with a total trading volume of $563,746.08. USUAL's current market capitalization stands at approximately $46.11 million, with a circulating supply of 1.61 billion tokens out of a total supply of 898.41 million and a maximum supply of 4 billion tokens. The circulating supply represents 40.35% of the total supply, with the fully diluted market cap at $25.67 million.
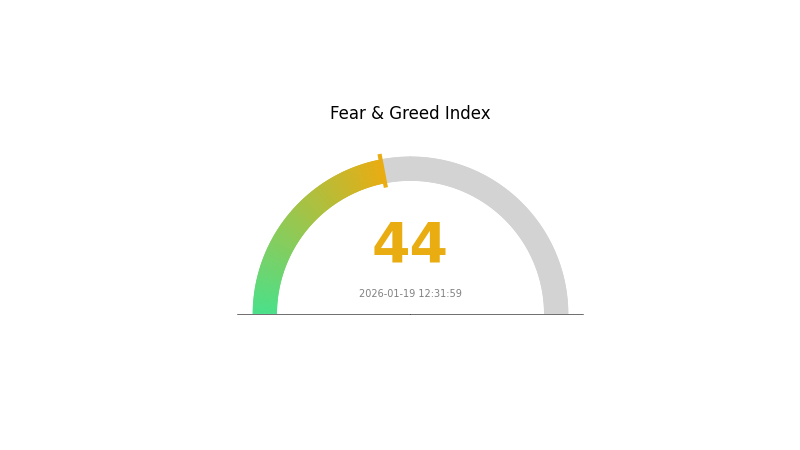
The token maintains a market dominance of 0.00077% and is currently ranked 550th in the cryptocurrency market. USUAL is held by approximately 23,260 addresses and is listed on 25 exchanges. The current market sentiment index stands at 44, indicating a "Fear" level according to market emotion indicators.
Since its all-time high in December 2024, USUAL has experienced a year-over-year decline of 94.78%, positioning the current price significantly below its historical peak. The token operates on the Ethereum blockchain as an ERC-20 standard token.
Click to view the current USUAL market price

USUAL Market Sentiment Index
2026-01-19 Fear and Greed Index: 44 (Fear)
Click to view current Fear & Greed Index
Current market sentiment shows notable fear with an index reading of 44. This indicates investors are exercising caution in the crypto market. When fear levels are elevated, market volatility typically increases as participants adopt defensive positioning. Traders should monitor this metric closely as it reflects collective market psychology. Lower index readings often present contrarian opportunities for experienced investors, though risk management remains essential during periods of heightened uncertainty.
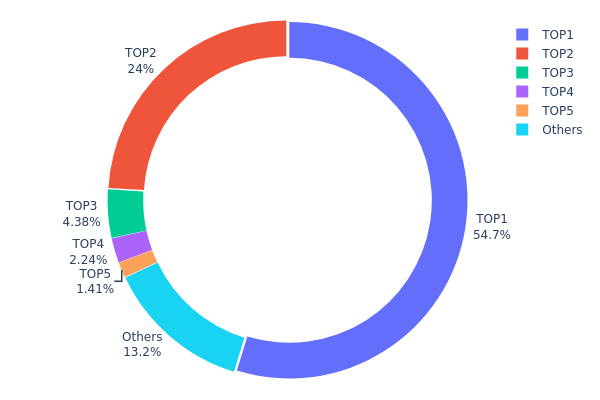
USUAL Address Holding Distribution
The address holding distribution chart reveals the proportion of token supply controlled by the largest holders versus the broader community. By examining the concentration of holdings among top addresses, analysts can assess market centralization risks, potential price manipulation vulnerabilities, and the overall decentralization health of a cryptocurrency's ecosystem.
According to current data, USUAL demonstrates significant concentration among its largest holders. The top address alone controls 885.03 million tokens, representing 54.74% of the total circulating supply, while the second-largest address holds 388.50 million tokens (24.03%). Combined, the top two addresses control nearly 78.77% of all circulating USUAL tokens. When expanding to the top five addresses, this concentration reaches 86.78%, leaving only 13.22% distributed among all other holders. This distribution pattern indicates an extremely centralized market structure that deviates substantially from ideal decentralization principles.
Such pronounced concentration creates multiple structural vulnerabilities for USUAL's market dynamics. The dominant position of the top two holders grants them substantial influence over price movements, potentially enabling coordinated selling pressure that could trigger cascading liquidations or panic selling among retail participants. Furthermore, this centralization undermines the project's resistance to single-point failures and regulatory scrutiny, as the majority of tokens remain under the control of a limited number of entities. The limited float available to the broader market (13.22%) may also contribute to exaggerated price volatility, as relatively small trading volumes could generate disproportionate price swings due to thin liquidity outside major holder positions.
Click to view the current USUAL Address Holding Distribution
| Top |
Address |
Holding Qty |
Holding (%) |
| 1 |
0x06b9...4d4b8e |
885029.19K |
54.74% |
| 2 |
0xf977...41acec |
388497.71K |
24.03% |
| 3 |
0xe3fd...e5a03f |
70789.47K |
4.37% |
| 4 |
0x4368...26f042 |
36270.85K |
2.24% |
| 5 |
0x28c6...f21d60 |
22736.42K |
1.40% |
| - |
Others |
213226.50K |
13.22% |
II. Core Factors Influencing USUAL's Future Price
Supply Mechanism
- Staking-Based Issuance: USUAL employs a gradual inflation model with a total supply cap of 4,000,000,000 tokens. New token distribution is linked to Total Value Locked (TVL) and liquidity contributions, encouraging long-term holding while maintaining ecosystem balance through community governance adjustments.
- Historical Pattern: The protocol's design aims to avoid excessive inflation through its staking mechanism, where users participate in network governance and earn rewards. This structure has helped maintain supply discipline since the project's 2024 launch.
- Current Impact: With approximately 40% staking rate and controlled token release schedules (team tokens locked for 4 years with linear vesting), supply pressure remains manageable. The protocol's burn mechanism, using portions of transaction fees for buybacks, helps balance supply-demand dynamics.
Institutional and Major Holder Dynamics
- Institutional Holdings: USUAL has garnered support from major exchanges including Coinbase and Kraken, providing market confidence and solid infrastructure for ecosystem applications. The top 10 holders demonstrate significant concentration, which may influence short-term price movements.
- Protocol Adoption: USD0 stablecoin integration across DeFi platforms and potential use as futures collateral or contract margin on exchanges creates additional demand drivers for the USUAL ecosystem.
- Governance Structure: The protocol's decentralized governance allows token holders to vote on critical decisions including parameter adjustments, protocol upgrades, and fund allocation, with voting weight typically proportional to holdings.
Macroeconomic Environment
- Monetary Policy Impact: USUAL's revenue model is tied to Real World Asset (RWA) yields, particularly U.S. Treasury bonds generating approximately 4% annual returns. Changes in interest rate policies by major central banks directly affect the protocol's income generation capacity.
- Inflation Hedge Attributes: The protocol's RWA-backed structure provides relative stability compared to purely algorithmic stablecoins. With current dollar interest rates, the stablecoin pool of approximately $1.5 billion generates notable annual returns, offering some protection against traditional market volatility.
- Regulatory Considerations: As a stablecoin protocol, USUAL faces potential regulatory scrutiny regarding compliance requirements. The project's transparent, decentralized approach aims to address traditional stablecoin centralization risks, though evolving regulations remain a key consideration.
Technical Development and Ecosystem Building
- USD0++ Vault Development: The protocol plans to launch USD0++ vaults with the first focused on sUSDe, allowing users to deposit USD0++ and simultaneously earn yields from both USD0++ and sUSDe, unlocking new yield opportunities.
- Layer 2 Solution: Long-term roadmap includes developing a dedicated Layer 2 for USUAL use cases, potentially establishing USUAL as network gas similar to ETH or BNB, expanding utility beyond governance functions.
- Synthetic Asset Expansion: Plans to create additional synthetic assets including ETH0 and BTC0 aim to diversify the asset pool beyond dollar-denominated RWAs, potentially attracting broader user participation and strengthening ecosystem resilience.
- Payment Infrastructure: The founding team intends to position USD0 as a payment tool with development of a specialized payment chain, which could significantly expand USUAL's application scenarios and demand drivers if successfully implemented.
III. 2026-2031 USUAL Price Prediction
2026 Outlook
- Conservative Prediction: $0.01696 - $0.02826
- Neutral Prediction: Around $0.02826
- Optimistic Prediction: Up to $0.02967 (requires favorable market conditions and ecosystem development)
According to the forecast data, USUAL may experience a relatively challenging year in 2026, with potential price corrections. The token is expected to trade within a range of $0.01696 to $0.02967, with an average price hovering around $0.02826. This bearish outlook suggests that investors should approach with caution and focus on long-term fundamentals rather than short-term gains.
2027-2029 Mid-term Outlook
- Market Stage Expectation: Recovery and gradual growth phase with increasing adoption
- Price Range Forecast:
- 2027: $0.02694 - $0.03447 (average $0.02897)
- 2028: $0.02728 - $0.03965 (average $0.03172, +11% change)
- 2029: $0.0207 - $0.04996 (average $0.03568, +24% change)
- Key Catalysts: Protocol upgrades, expanding use cases, and broader DeFi integration
The mid-term forecast indicates a recovery trajectory starting from 2027, with USUAL potentially entering a growth phase. By 2028, the token could see an 11% increase, followed by a more substantial 24% growth in 2029. This period may be characterized by increased market confidence and wider adoption of the USUAL ecosystem, though volatility remains a factor to consider.
2030-2031 Long-term Outlook
- Baseline Scenario: $0.02698 - $0.05995 (assuming steady ecosystem growth and market maturity)
- Optimistic Scenario: $0.0334 - $0.05995 in 2030 (+49% change), reaching $0.05138 - $0.05293 in 2031 (+79% cumulative change from 2026)
- Transformative Scenario: Approaching $0.05995 - $0.06000 (under highly favorable conditions including mass adoption and significant protocol innovations)
Looking toward the end of the forecast period, USUAL shows potential for substantial appreciation, with 2030 predictions suggesting a 49% increase and 2031 potentially delivering a 79% cumulative gain from the 2026 baseline. The long-term outlook appears more promising, particularly if the project successfully expands its utility and captures a larger share of the stablecoin or DeFi market. However, these projections remain subject to broader cryptocurrency market dynamics, regulatory developments, and the project's ability to execute its roadmap effectively.
As of January 19, 2026, investors should note that these predictions represent potential scenarios rather than guaranteed outcomes, and conducting thorough due diligence remains essential before making investment decisions.
| Year |
Predicted High Price |
Predicted Average Price |
Predicted Low Price |
Price Change |
| 2026 |
0.02967 |
0.02826 |
0.01696 |
-1 |
| 2027 |
0.03447 |
0.02897 |
0.02694 |
1 |
| 2028 |
0.03965 |
0.03172 |
0.02728 |
11 |
| 2029 |
0.04996 |
0.03568 |
0.0207 |
24 |
| 2030 |
0.05995 |
0.04282 |
0.02698 |
49 |
| 2031 |
0.05293 |
0.05138 |
0.0334 |
79 |
IV. USUAL Professional Investment Strategy and Risk Management
USUAL Investment Methodology
(1) Long-term Holding Strategy
- Target Audience: Investors who believe in the long-term value proposition of decentralized stablecoin infrastructure and are willing to weather short-term volatility
- Operational Recommendations:
- Consider gradual accumulation during market downturns, particularly when USUAL trades significantly below its historical average
- Monitor the project's stablecoin adoption metrics and governance developments as indicators of fundamental value
- Storage Solution: Utilize Gate Web3 Wallet for secure self-custody, ensuring private key backup and multi-factor authentication
(2) Active Trading Strategy
- Technical Analysis Tools:
- Moving Averages: Monitor 50-day and 200-day moving averages to identify potential trend reversals and support/resistance levels
- Volume Analysis: Track 24-hour trading volume patterns, currently at approximately $563,746, to gauge market participation and liquidity
- Swing Trading Considerations:
- USUAL has demonstrated significant volatility with 24-hour price fluctuations between $0.02461 and $0.03127
- Consider the token's 94.78% decline from its all-time high of $1.6555, which may present both opportunities and heightened risk
USUAL Risk Management Framework
(1) Asset Allocation Principles
- Conservative Investors: 1-2% of crypto portfolio allocation
- Moderate Investors: 3-5% of crypto portfolio allocation
- Aggressive Investors: 5-10% of crypto portfolio allocation, understanding the elevated risk profile
(2) Risk Hedging Approaches
- Portfolio Diversification: Combine USUAL with established cryptocurrencies and stablecoin positions to reduce concentration risk
- Position Sizing: Implement strict position limits based on individual risk tolerance and avoid over-leveraging
(3) Secure Storage Solutions
- Non-Custodial Wallet Recommendation: Gate Web3 Wallet provides secure self-custody for USUAL tokens with user-controlled private keys
- Multi-Signature Setup: Consider implementing multi-signature requirements for larger holdings to enhance security
- Security Precautions: Never share private keys or seed phrases, enable two-factor authentication, and be vigilant against phishing attempts
V. USUAL Potential Risks and Challenges
USUAL Market Risks
- Extreme Price Volatility: USUAL has experienced a 94.78% decline from its all-time high, demonstrating substantial downside potential and market uncertainty
- Low Market Capitalization: With a market cap of approximately $46.1 million and market dominance of only 0.00077%, USUAL remains highly susceptible to manipulation and liquidity constraints
- Limited Trading History: Having launched in December 2024, USUAL lacks sufficient historical data for comprehensive risk assessment
USUAL Regulatory Risks
- Stablecoin Regulatory Uncertainty: As a fiat-backed stablecoin issuer, USUAL operates in an evolving regulatory landscape where government policies regarding stablecoins continue to develop
- Decentralization Classification: The project's decentralized governance model may face scrutiny from regulatory authorities examining compliance with securities regulations
- Cross-Border Compliance: Operating as a global stablecoin issuer presents challenges in meeting diverse jurisdictional requirements
USUAL Technical Risks
- Smart Contract Vulnerabilities: As an ERC-20 token, USUAL depends on the security of its smart contract implementation, which could be susceptible to bugs or exploits
- Centralization Dependencies: Despite its decentralized positioning, the project may have centralized points of failure in its reserve management or governance structure
- Scalability Constraints: Ethereum network congestion could impact transaction efficiency and costs for USUAL token operations
VI. Conclusion and Action Recommendations
USUAL Investment Value Assessment
USUAL presents itself as a decentralized fiat-backed stablecoin issuer with an innovative value redistribution model through its governance token. However, the token's severe price decline of nearly 95% from its all-time high, combined with its relatively small market capitalization and limited trading history, suggests significant market skepticism and elevated risk. While the underlying stablecoin infrastructure concept has merit, investors should carefully weigh the substantial volatility and uncertainty against the project's long-term value proposition. The current circulating supply represents approximately 40.35% of the fully diluted market cap, indicating potential future token supply increases that could impact price dynamics.
USUAL Investment Recommendations
✅ Beginners: Avoid or limit exposure to minimal amounts while gaining experience with more established cryptocurrencies and understanding market dynamics
✅ Experienced Investors: Consider small speculative positions only within a well-diversified portfolio, maintaining strict risk management protocols
✅ Institutional Investors: Conduct comprehensive due diligence on reserve backing, governance mechanisms, and regulatory compliance before considering allocation
USUAL Trading Participation Methods
- Spot Trading: Purchase USUAL tokens directly on Gate.com, which supports trading for this asset with 25 exchanges currently listing the token
- Gradual Accumulation: Implement dollar-cost averaging strategies to mitigate timing risk in this volatile asset
- Monitoring Approach: Track project developments, stablecoin adoption metrics, and governance proposals before making investment decisions
Cryptocurrency investment carries extremely high risks, and this article does not constitute investment advice. Investors should make prudent decisions based on their own risk tolerance and are advised to consult professional financial advisors. Never invest more than you can afford to lose.
FAQ
What is USUAL token? What are its uses and application scenarios?
USUAL is a decentralized stablecoin governance token enabling holders to vote on protocol decisions and earn rewards. It powers the USD0 stablecoin ecosystem, allowing users to stake real-world assets as collateral and participate in protocol governance through voting on key parameters and upgrades.
USUAL currently trades at $0.030, with a 24-hour price increase of 3.91%. Market cap stands at $48.9 million. Trading activity shows $12.6 million in transaction volume over the past 24 hours, demonstrating solid market participation and liquidity for this multi-chain RWA infrastructure token.
What are professional analysts' price predictions for USUAL in the future? What are the main factors affecting the price?
Professional analysts predict USUAL could reach $2.00 to $3.00 in the future. Key factors include market demand, technology development, and adoption rates. Now may be a good time for long-term investors to consider accumulating positions.
What are the risks of investing in USUAL token? How to evaluate its investment value?
USUAL token carries high volatility risk due to its short-term economic model design. Evaluate value by analyzing initial liquidity strength, staking mechanism sustainability, and token flywheel dynamics. Strong early momentum possible, but long-term potential remains limited due to model constraints.
USUAL与其他同类加密货币相比有什么优势和劣势?
USUAL优势:USD0由美国国库券支持,完全透明;协议收益分配给用户,去中心化程度高。劣势:相比USDT和USDC流动性较低,用户基础更小,市场接受度有待提升。
What is the technical team background of USUAL? What is the project's development roadmap?
USUAL's technical team comprises experts from traditional finance and blockchain sectors. The roadmap prioritizes DeFi innovation, enhanced user experience, and sustainable market expansion through phased development initiatives.
* The information is not intended to be and does not constitute financial advice or any other recommendation of any sort offered or endorsed by Gate.