This comprehensive analysis examines VARA Network's price trajectory from 2026 through 2031, combining historical data, market dynamics, and ecosystem developments. The article evaluates VARA as a pioneering Web3 infrastructure platform, currently trading at $0.001224 with a market cap of $5.94 million. It provides professional price forecasts across multiple scenarios—conservative, neutral, and optimistic—alongside practical investment strategies for different investor profiles. The analysis addresses core price drivers including supply mechanisms, macroeconomic conditions, and technical development. Risk management frameworks, potential challenges from volatility and limited liquidity, and secure trading methods on Gate are outlined. Designed for investors seeking informed entry points and strategic positioning in emerging blockchain platforms, the article emphasizes high-risk characteristics and recommends appropriate allocation percentages based on investor experience levels.
Introduction: VARA's Market Position and Investment Value
VaraNetwork (VARA), as a pioneering Web3 infrastructure platform focused on decentralized application development, has been advancing the evolution of blockchain technology since its launch in 2023. As of January 2026, VARA has achieved a market capitalization of approximately $5.94 million, with a circulating supply of around 4.86 billion tokens, and its price is maintained at approximately $0.001224. This asset, recognized as an "innovative Actor Model-based blockchain platform," is playing an increasingly vital role in the development of next-generation decentralized applications.
This article will comprehensively analyze VARA's price trends from 2026 to 2031, combining historical patterns, market supply and demand dynamics, ecosystem development, and macroeconomic conditions to provide investors with professional price forecasts and practical investment strategies.
I. VARA Price History Review and Current Market Status
VARA Historical Price Evolution Trajectory
- 2023: VARA launched on September 20, 2023, with a publish price of $0.25, marking the beginning of its market journey
- 2024: On January 17, 2024, VARA reached a notable price level of $0.2, representing a significant market milestone since its launch
- 2025: VARA experienced market volatility throughout the year, with the price declining from previous levels to $0.0008251 by December 31, 2025
VARA Current Market Situation
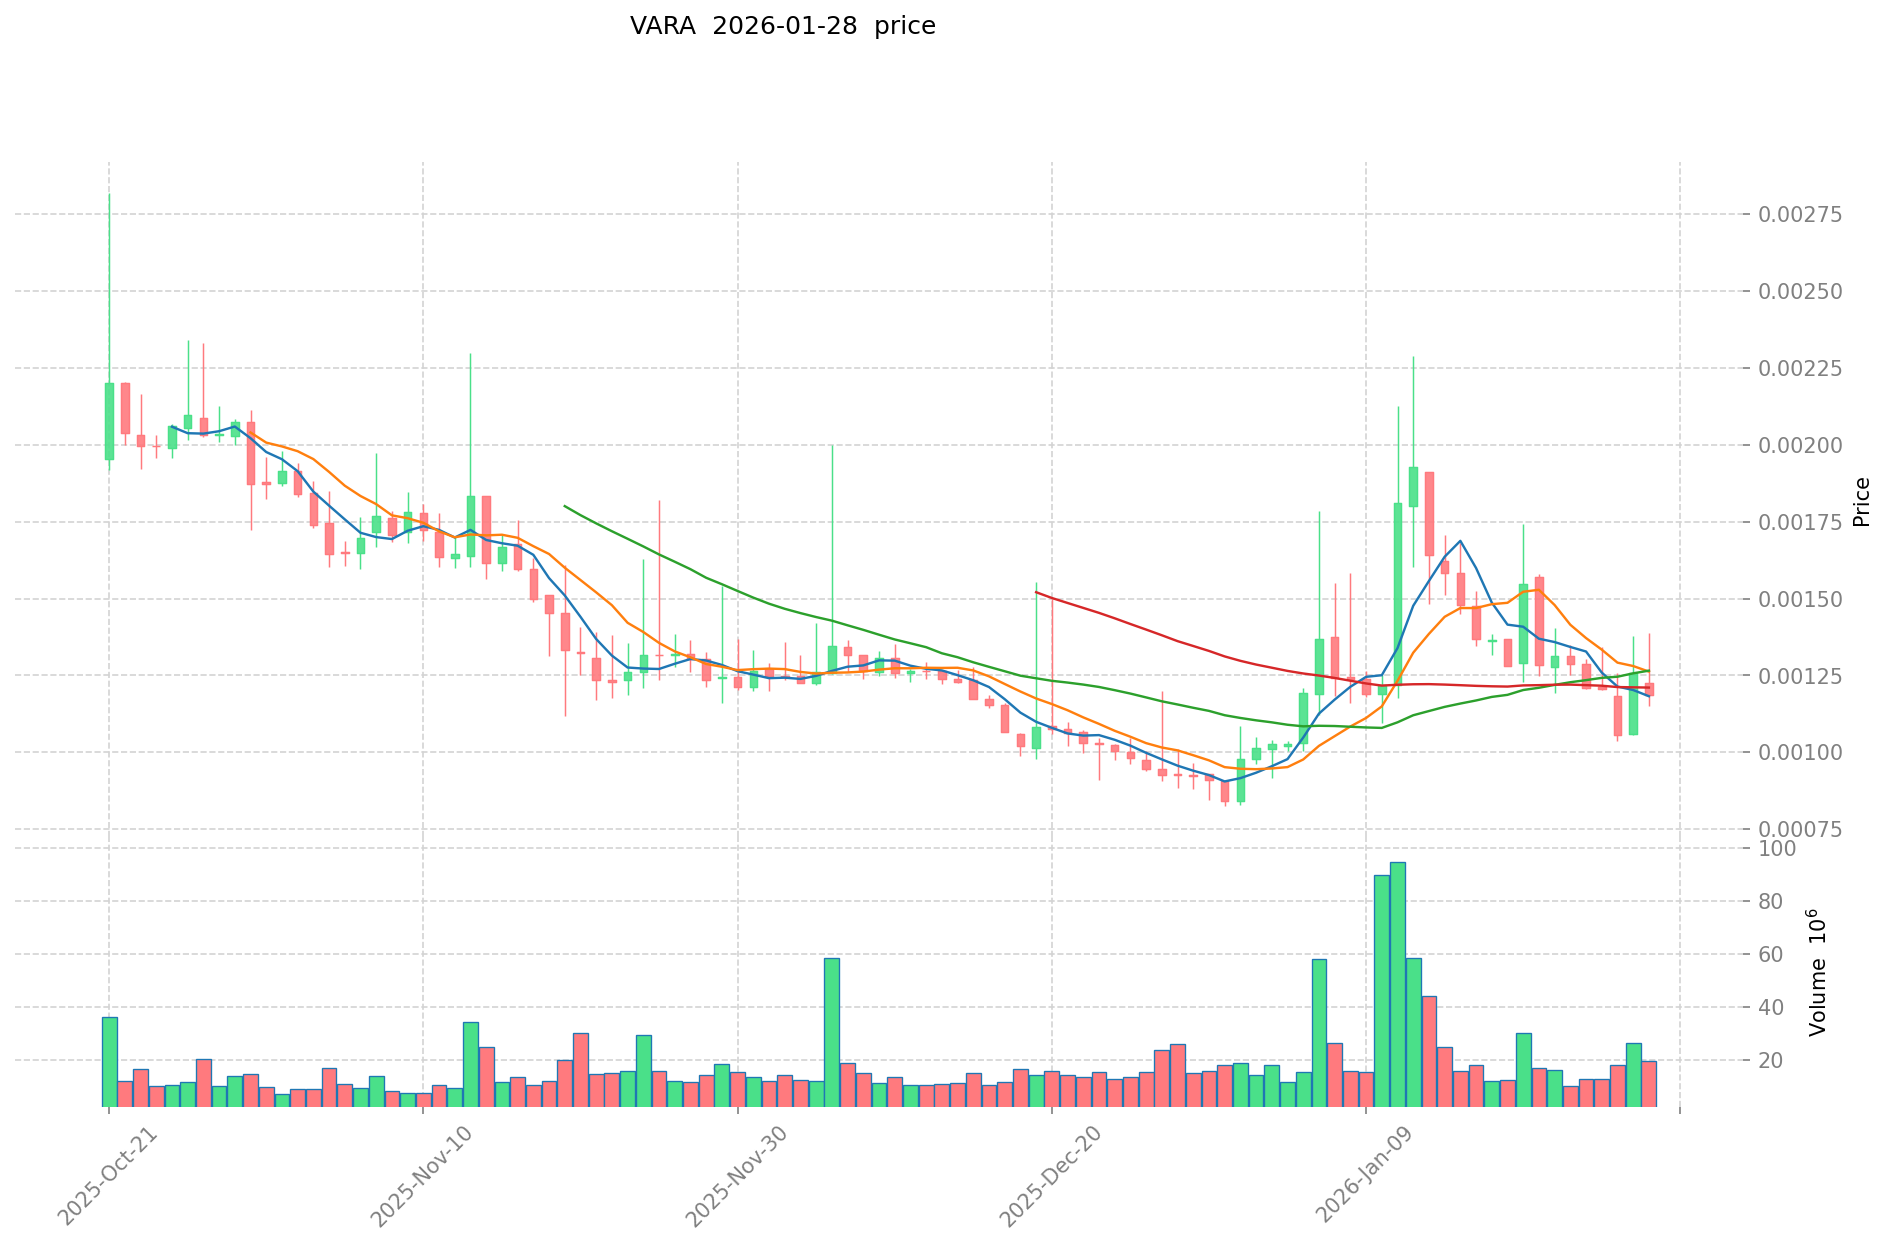
As of January 28, 2026, VARA is trading at $0.0012238, showing a 1.7% increase over the past 24 hours. The token has demonstrated mixed short-term performance, with a 2.19% decline in the past hour and a 6.98% decrease over the past week. However, the 30-day trend shows a recovery with a 30.72% increase.
The 24-hour trading volume stands at $24,044.50, with the price fluctuating between $0.00115 and $0.0017002 during this period. VARA's market capitalization is approximately $5.94 million, with a circulating supply of 4.86 billion tokens out of a maximum supply of 10 billion tokens, representing a circulation ratio of 48.57%.
The fully diluted market cap is calculated at $12.24 million, with the market cap to FDV ratio at 48.57%. VARA's market dominance is currently 0.00038%, reflecting its position in the broader cryptocurrency market. The current price represents a significant decline from the $0.2 level observed in January 2024.
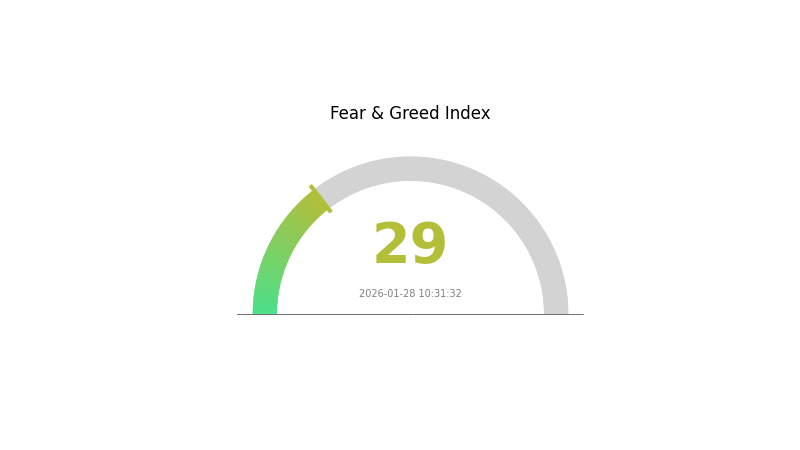
The cryptocurrency market sentiment index currently stands at 29, indicating a "Fear" sentiment among market participants, which may be influencing trading activity across various digital assets.
Click to view current VARA market price
VARA Market Sentiment Indicator
2026-01-28 Fear and Greed Index: 29 (Fear)
Click to view current Fear & Greed Index
Today's cryptocurrency market sentiment shows a fear reading of 29, indicating significant bearish pressure in the market. This fear index suggests investors are experiencing heightened concerns about market volatility and potential downside risks. When the fear and greed index drops to this level, it often reflects panic selling and defensive positioning among traders. Such sentiment typically presents contrarian opportunities for long-term investors to accumulate quality assets at lower valuations. Monitor this indicator closely as shifts in market psychology can signal important turning points in the crypto cycle.
VARA Holdings Distribution
The holdings distribution chart illustrates the concentration of VARA tokens across different wallet addresses, providing crucial insights into the token's decentralization level and market structure. This metric serves as a key indicator of potential price manipulation risks and the overall health of token distribution among holders.
Based on the current data, VARA demonstrates a relatively concentrated distribution pattern where the top 10 addresses collectively control a significant portion of the total token supply. The leading address holds approximately 8.67% of the circulating supply with 86.7M tokens, while the top three addresses combined account for over 20% of all tokens. This concentration level suggests that a small number of entities possess substantial influence over the token's market dynamics, which could potentially lead to increased volatility during periods of large-scale selling or accumulation.
From a market structure perspective, this distribution pattern indicates moderate centralization risk. While not approaching the extreme concentration levels that would raise immediate red flags, the current holdings distribution does create vulnerability to coordinated price movements if major holders decide to adjust their positions simultaneously. The relatively balanced distribution among the top 10 holders somewhat mitigates this risk, as no single entity appears to have absolute control. However, investors should remain cognizant that the cumulative power of these top addresses could significantly impact short-term price action and liquidity conditions in the VARA market.
Click to view current VARA Holdings Distribution

| Top |
Address |
Holding Qty |
Holding (%) |
II. Core Factors Influencing VARA's Future Price
Supply Mechanism
-
Market Demand Dynamics: The future price trajectory of VARA appears to be primarily driven by shifting market demand patterns. Current market trends indicate potential growth opportunities as demand factors evolve.
-
Historical Patterns: Historical price movements and trading volume data have served as important indicators for understanding VARA's market behavior. These patterns provide context for anticipating future price fluctuations.
-
Current Impact: Analysts suggest that ongoing market demand shifts, combined with production cost considerations, continue to shape VARA's near-term price outlook.
Macroeconomic Environment
-
Economic Conditions: Broader economic conditions play a meaningful role in influencing VARA's price movements. Market participants monitor economic indicators as they assess potential price directions.
-
Cost Structure: Production costs remain a relevant factor in the overall price equation, as they influence supply-side dynamics and market equilibrium points.
Technical Development and Ecosystem Building
-
Innovation and Adaptation: The ability to adapt to changing market conditions and technological developments may influence VARA's competitive positioning and long-term value proposition.
-
Market Structure: Current market structure and trading dynamics provide insights into potential future price behavior, though outcomes remain subject to various market forces and external factors.
III. 2026-2031 VARA Price Prediction
2026 Outlook
- Conservative prediction: $0.00088 - $0.00122
- Neutral prediction: $0.00122 (average scenario)
- Optimistic prediction: $0.00162 (requires favorable market conditions and increased adoption)
2027-2029 Outlook
- Market stage expectation: VARA may experience gradual growth as the project develops its ecosystem and expands its user base during this mid-term period
- Price range prediction:
- 2027: $0.00101 - $0.00146
- 2028: $0.00073 - $0.00154
- 2029: $0.00079 - $0.00174
- Key catalysts: Market sentiment improvement, potential platform upgrades, and broader crypto market recovery could serve as primary drivers for price appreciation
2030-2031 Long-term Outlook
- Baseline scenario: $0.00091 - $0.00162 in 2030 (assuming steady ecosystem development)
- Optimistic scenario: $0.00127 - $0.00196 in 2031 (contingent on successful technology implementation and market expansion)
- Transformational scenario: up to $0.0029 in 2031 (requires exceptional market conditions, widespread adoption, and significant technological breakthroughs)
- 2026-01-28: VARA trading within the projected range of $0.00088 - $0.00162 (early stage of the prediction cycle)
| Year |
Predicted High Price |
Predicted Average Price |
Predicted Low Price |
Price Change |
| 2026 |
0.00162 |
0.00122 |
0.00088 |
0 |
| 2027 |
0.00146 |
0.00142 |
0.00101 |
16 |
| 2028 |
0.00154 |
0.00144 |
0.00073 |
17 |
| 2029 |
0.00174 |
0.00149 |
0.00079 |
21 |
| 2030 |
0.0023 |
0.00162 |
0.00091 |
32 |
| 2031 |
0.0029 |
0.00196 |
0.00127 |
59 |
IV. VARA Professional Investment Strategy and Risk Management
VARA Investment Methodology
(1) Long-term Holding Strategy
- Target Investors: Crypto enthusiasts who believe in the future of decentralized application platforms and are willing to tolerate high volatility for potential long-term growth.
- Operational Recommendations:
- Consider accumulating VARA positions gradually during market pullbacks, particularly when prices approach support levels.
- Monitor ecosystem developments including dApp launches and technical upgrades that may drive fundamental value.
- Utilize secure storage solutions like Gate Web3 Wallet for long-term holdings to maintain control of private keys.
(2) Active Trading Strategy
- Technical Analysis Tools:
- Moving Averages: Use 50-day and 200-day moving averages to identify trend direction and potential entry/exit points.
- Relative Strength Index (RSI): Monitor RSI levels to identify overbought (above 70) and oversold (below 30) conditions for timing trades.
- Swing Trading Key Points:
- Pay attention to the 24-hour trading volume patterns, as VARA currently shows relatively low liquidity with approximately $24,044 in daily volume.
- Set strict stop-loss orders given the token's high volatility, with price fluctuations exceeding 6% over weekly periods.
VARA Risk Management Framework
(1) Asset Allocation Principles
- Conservative Investors: 1-3% of crypto portfolio allocation
- Aggressive Investors: 5-10% of crypto portfolio allocation
- Professional Investors: Up to 15% with active hedging strategies
(2) Risk Hedging Solutions
- Position Sizing: Never allocate more than you can afford to lose, considering VARA's 92.75% decline over the past year.
- Diversification Strategy: Spread investments across multiple blockchain infrastructure projects rather than concentrating solely in VARA.
(3) Secure Storage Solutions
- Software Wallet Recommendation: Gate Web3 Wallet provides convenient access for active traders while maintaining security standards.
- Multi-signature Solution: For larger holdings, consider implementing multi-signature wallet configurations to enhance security.
- Security Precautions: Never share private keys, enable two-factor authentication, and regularly update wallet software to protect against vulnerabilities.
V. VARA Potential Risks and Challenges
VARA Market Risks
- High Volatility: VARA has experienced extreme price fluctuations, with a historical high of $0.20 and a historical low of $0.0008251, indicating significant volatility that may result in substantial losses.
- Limited Liquidity: With only 2 exchange listings and approximately $24,044 in 24-hour trading volume, VARA faces liquidity constraints that could make it difficult to execute large trades without significant price impact.
- Market Cap Positioning: Ranked at #1440 with a market cap of approximately $5.94 million, VARA remains a small-cap project vulnerable to market manipulation and sudden sell-offs.
VARA Regulatory Risks
- Compliance Uncertainty: As blockchain regulations continue to evolve globally, decentralized application platforms like Vara Network may face changing compliance requirements that could impact operations.
- Cross-border Legal Complexity: Operating across multiple jurisdictions creates potential legal challenges that could affect the project's development and token utility.
- Securities Classification Risk: Depending on regulatory interpretations in different regions, VARA tokens could potentially be classified as securities, affecting trading availability and investor access.
VARA Technical Risks
- Network Adoption Risk: Despite innovative architecture combining Actor Model and Persistent Memory, Vara Network's success depends on attracting developers and dApp projects to build on its platform.
- Competition Pressure: Vara faces intense competition from established smart contract platforms and other emerging Layer 1 solutions, which may limit market share growth.
- Technical Complexity: The unique architecture, while innovative, may create barriers to entry for developers unfamiliar with Actor Model programming paradigms, potentially slowing ecosystem growth.
VI. Conclusion and Action Recommendations
VARA Investment Value Assessment
Vara Network presents an innovative approach to decentralized application development through its combination of Actor Model architecture and Persistent Memory. However, the token has experienced significant price depreciation, declining 92.75% over the past year while the circulating supply represents only 48.57% of the total supply. The project's low liquidity and limited exchange listings pose additional challenges. While the technical foundations show promise, investors should carefully weigh the high-risk profile against potential long-term upside as the ecosystem develops.
VARA Investment Recommendations
✅ Beginners: Avoid investing in VARA until gaining more experience with crypto markets due to extreme volatility and limited liquidity. If interested, allocate no more than 1-2% of your crypto portfolio and focus on learning about the project fundamentals.
✅ Experienced Investors: Consider small speculative positions (3-5% of crypto portfolio) with clearly defined risk parameters and stop-loss levels. Monitor ecosystem development milestones and dApp adoption metrics before increasing exposure.
✅ Institutional Investors: Conduct thorough due diligence on the Vara Network team, technology roadmap, and competitive positioning. Consider strategic partnerships or ecosystem participation rather than purely token-based exposure given liquidity constraints.
VARA Trading Participation Methods
- Spot Trading on Gate.com: Direct purchase and sale of VARA tokens with immediate settlement, suitable for both long-term holders and active traders.
- Dollar-Cost Averaging: Gradually accumulate positions over time to reduce the impact of short-term price volatility, particularly given VARA's fluctuating price patterns.
- Portfolio Rebalancing: Periodically adjust VARA allocation based on performance relative to other assets, maintaining target risk exposure levels as part of a diversified crypto portfolio.
Cryptocurrency investment carries extremely high risks, and this article does not constitute investment advice. Investors should make cautious decisions based on their own risk tolerance and are advised to consult professional financial advisors. Never invest more than you can afford to lose.
FAQ
What is VARA token and what is its purpose?
VARA is the native token of Vara Network, built on Gear Protocol. It is used to pay network transaction fees and participate in governance decisions. VARA enables efficient smart contract execution on the Vara Network blockchain.
What are the main factors affecting VARA price?
VARA price is primarily driven by market demand, technological development, strategic partnerships, and market competition. Successful product implementations and collaborations typically push prices upward.
How to analyze VARA price trends and technical aspects?
Monitor key technical indicators like moving averages, RSI, and MACD to identify trend direction. Analyze support and resistance levels, trading volume, and chart patterns. Track market sentiment, on-chain metrics, and fundamental developments. Use multiple timeframes for comprehensive analysis to make informed trading decisions.
VARA未来的发展前景和应用场景如何?
VARA leverages VR/AR technology with promising prospects. VR is set to replace gaming consoles and TVs, while AR will replace smartphones. Both are key metaverse infrastructures. Long-term shipment volumes could reach hundreds of millions of units across gaming, social, education, healthcare, and industrial applications.
What risks should investors be aware of when investing in VARA tokens?
VARA token investment carries high volatility risk. The token may lack substantial utility and face sudden price crashes. Investors should be cautious of promises offering excessive returns, which are often warning signs of potential fraud or market manipulation.
What methods are commonly used for VARA price prediction?
VARA price prediction typically employs moving averages, including simple moving averages (SMA) and exponential moving averages (EMA). Technical analysis, on-chain metrics, trading volume, market sentiment, and historical price patterns are also commonly used to forecast VARA price movements.
What are the advantages and disadvantages of VARA compared to similar tokens?
VARA's advantage lies in real asset backing, providing stability and reduced risk. Its disadvantage is potentially limited innovation potential compared to other cryptocurrencies with greater speculative upside.
* The information is not intended to be and does not constitute financial advice or any other recommendation of any sort offered or endorsed by Gate.