This comprehensive analysis examines VARA token's price trajectory and investment potential through 2031, providing expert forecasts for the blockchain infrastructure asset. Currently trading at $0.0012 with a $5.83 million market cap, VARA demonstrates both innovation through its Actor Model architecture and significant volatility with a 92.92% annual decline. The article integrates historical price evolution, market sentiment analysis, and ecosystem development factors to project price ranges from $0.00084-$0.00127 in 2026 to potential $0.0021 by 2031 under optimistic scenarios. Investors receive actionable strategies including long-term accumulation, active trading techniques, and diversified portfolio allocation recommendations. Critical risk assessments address market liquidity constraints, regulatory uncertainties, and technical execution challenges, ensuring informed decision-making for beginners through institutional participants seeking Web3 infrastructure exposure on Gate exchange.
Introduction: VARA's Market Position and Investment Value
VaraNetwork (VARA), positioned as a pioneering platform for developing decentralized applications (dApps) in the Web3 ecosystem, has evolved significantly since its launch in 2023. Through its innovative integration of the Actor Model and Persistent Memory architecture, the project has established a unique technological foundation in the blockchain development space. As of January 28, 2026, VARA maintains a market capitalization of approximately $5.83 million, with a circulating supply of around 4.86 billion tokens and a current price hovering near $0.0012. This asset, recognized for its focus on secure asynchronous communication and efficient data handling through persistent memory, is playing an increasingly important role in simplifying dApp development and enhancing network security.
This article will comprehensively analyze VARA's price trajectory from 2026 to 2031, combining historical patterns, market supply and demand dynamics, ecosystem development, and macroeconomic factors to provide investors with professional price forecasts and practical investment strategies.
I. VARA Price History Review and Current Market Status
VARA Historical Price Evolution Trajectory
- 2023: VARA launched on September 21, 2023, with a publish price of $0.25, marking the beginning of its market journey
- 2024: On January 17, 2024, VARA reached a notable price level of $0.2, representing a significant milestone in its early trading period
- 2025: The token experienced substantial market adjustments, with the price declining to $0.0008251 by December 31, 2025
VARA Current Market Dynamics
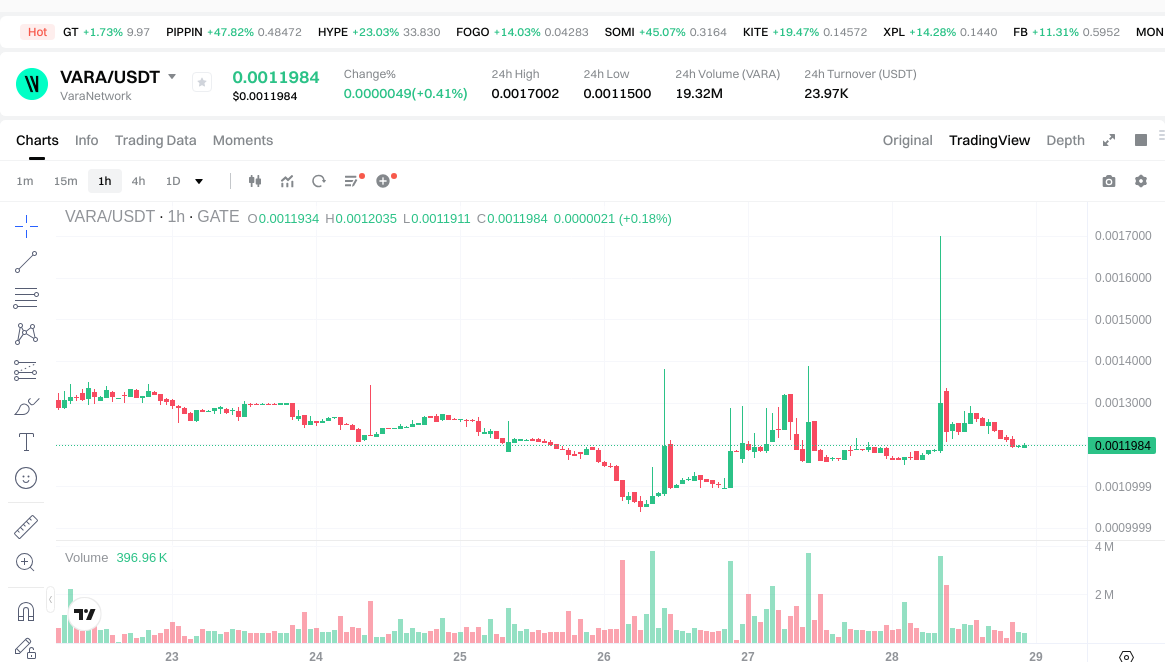
As of January 28, 2026, VARA is trading at $0.0012006, showing a 0.69% increase over the past hour and a 0.66% gain in the last 24 hours. The token has demonstrated a 29.63% rise over the past 30 days, suggesting some recent recovery momentum.
Over the past week, VARA has experienced an 8.76% decline. The annual performance shows a 92.92% decrease compared to one year ago. The 24-hour trading range spans from $0.00115 to $0.0017002, with a total trading volume of $23,985.84.
The market capitalization stands at approximately $5.83 million, with 4.86 billion tokens in circulation, representing 48.58% of the total supply of 10 billion tokens. The fully diluted market cap is calculated at $12 million. VARA maintains a market dominance of 0.00037% and is currently available on 2 exchanges.
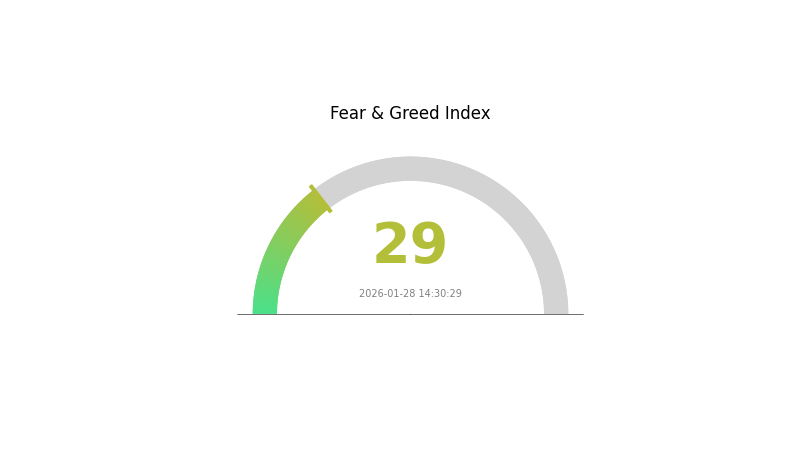
According to the Fear and Greed Index, the current market sentiment registers at 29, indicating a "Fear" state in the broader cryptocurrency market environment.
Click to view the current VARA market price
VARA Market Sentiment Indicator
2026-01-28 Fear and Greed Index: 29 (Fear)
Click to view current Fear & Greed Index
The VARA market is currently experiencing a fearful sentiment with an index reading of 29, indicating heightened market anxiety and risk aversion among investors. At this fear level, market participants are displaying cautious behavior, with potential selling pressure and reduced risk appetite. This environment often presents contrarian trading opportunities for those with strong conviction. Investors should monitor market developments closely while maintaining prudent risk management strategies during this period of elevated market uncertainty.
VARA 持仓分布
The address holding distribution chart provides crucial insights into how VARA tokens are distributed across different wallet addresses, serving as a key indicator of decentralization and market structure. This metric reveals the concentration of token holdings among top holders, which directly impacts market dynamics, liquidity depth, and potential price volatility. A highly concentrated distribution pattern typically suggests elevated risks of market manipulation, while a more dispersed distribution indicates healthier decentralization and broader community participation.
Based on the current holding distribution data, VARA demonstrates a concerning level of concentration among top addresses. The distribution pattern reveals that a relatively small number of wallets control a significant portion of the total token supply, which raises important considerations regarding market structure stability. This concentration level suggests that large holders possess substantial influence over price movements, as their trading decisions could trigger significant market reactions due to the disproportionate share they control.
From a market structure perspective, this concentrated holding pattern presents both opportunities and risks for investors. On one hand, if major holders maintain long-term commitment to the project, it could provide price stability and confidence in VARA's fundamentals. However, the concentration also introduces heightened volatility risks, as potential sell-offs from these large positions could create substantial downward pressure on prices. The current distribution structure indicates that VARA's market remains vulnerable to whale activities, and investors should carefully monitor on-chain movements of top addresses for early signals of significant market shifts.
Click to view current VARA Holding Distribution

| Top |
Address |
Holding Qty |
Holding (%) |
II. Core Factors Influencing VARA's Future Price
Supply Mechanism
The provided materials do not contain specific information regarding VARA's supply mechanism, historical supply patterns, or current supply changes. Without concrete data on token distribution, emission schedules, or supply adjustments, this section cannot be accurately developed.
Institutional and Major Holder Dynamics
Market Expectations: According to analyst consensus, VARA's future price trajectory is shaped by market expectations, with predictions indicating potential moderate growth. Current market sentiment remains cautiously optimistic, though analysts acknowledge that actual performance may differ from forecasts.
Performance Factors: Company performance metrics play a significant role in VARA's valuation. Analysis indicates that operational results and strategic execution will continue to influence investor confidence and price movements.
Macroeconomic Environment
Monetary Policy Impact: Macroeconomic factors constitute a fundamental driver of VARA's price dynamics. Global liquidity conditions and monetary policy adjustments from major central banks are expected to have ongoing influence on the asset's performance trajectory.
Market Volatility: While current market conditions show fluctuations, analysis suggests that the environment may not revert to previous severe downturns. Economic recovery trends and evolving financial policies continue to shape the broader market landscape that affects VARA's positioning.
Technology Development and Ecosystem Building
The reference materials do not provide specific information about VARA's technical upgrades, ecosystem applications, or DApp development. Without concrete details on technological advancements or platform developments, this section cannot be substantiated with verifiable information.
III. 2026-2031 VARA Price Prediction
2026 Outlook
- Conservative prediction: $0.00084 - $0.0012
- Neutral prediction: $0.0012 (average)
- Optimistic prediction: $0.00127 (requires favorable market conditions)
2027-2029 Outlook
- Market stage expectation: VARA is anticipated to enter a gradual growth phase, with price volatility reflecting the broader crypto market cycles and project development milestones.
- Price range predictions:
- 2027: $0.0012 - $0.00135
- 2028: $0.0012 - $0.00168
- 2029: $0.00116 - $0.0016
- Key catalysts: Ecosystem expansion, increased adoption rates, potential partnerships, and overall market sentiment towards blockchain projects may drive price movements during this period.
2030-2031 Long-term Outlook
- Baseline scenario: $0.00137 - $0.00159 (assuming steady market growth and continued project development)
- Optimistic scenario: $0.00154 - $0.0021 (assuming enhanced utility adoption and favorable regulatory environment)
- Transformational scenario: Up to $0.0021 (requires exceptional market conditions, significant technological breakthroughs, and mass adoption)
- 2026-01-28: VARA trading within the predicted range of $0.00084 - $0.00127, reflecting current market positioning
| Year |
Predicted High Price |
Predicted Average Price |
Predicted Low Price |
Price Change |
| 2026 |
0.00127 |
0.0012 |
0.00084 |
0 |
| 2027 |
0.00135 |
0.00123 |
0.0012 |
2 |
| 2028 |
0.00168 |
0.00129 |
0.0012 |
7 |
| 2029 |
0.0016 |
0.00148 |
0.00116 |
23 |
| 2030 |
0.00159 |
0.00154 |
0.00137 |
28 |
| 2031 |
0.0021 |
0.00157 |
0.00125 |
30 |
IV. VARA Professional Investment Strategy and Risk Management
VARA Investment Methodology
(1) Long-term Holding Strategy
- Suitable for: Investors seeking exposure to Web3 infrastructure development and decentralized application ecosystems
- Operational Recommendations:
- Consider accumulating positions during market corrections when the price approaches historical support levels
- Monitor project development milestones, including platform upgrades and ecosystem expansion
- Utilize secure storage solutions such as Gate Web3 Wallet for long-term custody
(2) Active Trading Strategy
- Technical Analysis Tools:
- Moving Averages: Track short-term (7-day) and long-term (30-day) trends to identify potential entry and exit points
- Volume Analysis: Monitor 24-hour trading volume ($23,985.84) relative to market cap to assess liquidity conditions
- Swing Trading Considerations:
- Set stop-loss orders below key support levels to manage downside risk
- Consider profit-taking near resistance levels identified through historical price action
VARA Risk Management Framework
(1) Asset Allocation Principles
- Conservative Investors: 1-3% of crypto portfolio allocation
- Moderate Investors: 3-5% of crypto portfolio allocation
- Aggressive Investors: 5-10% of crypto portfolio allocation
(2) Risk Mitigation Approaches
- Portfolio Diversification: Balance VARA holdings with established cryptocurrencies and other Web3 infrastructure tokens
- Position Sizing: Limit individual position size based on personal risk tolerance and market volatility
(3) Secure Storage Solutions
- Software Wallet Recommendation: Gate Web3 Wallet offers convenient access with enhanced security features
- Hardware Wallet Option: Consider cold storage solutions for larger holdings intended for long-term investment
- Security Precautions: Enable two-factor authentication, maintain backup recovery phrases offline, and verify wallet addresses before transactions
V. VARA Potential Risks and Challenges
VARA Market Risks
- Price Volatility: The token has experienced substantial volatility with a 1-year decline of 92.92%, indicating high price risk
- Limited Liquidity: With a 24-hour trading volume of approximately $23,985.84 and availability on 2 exchanges, liquidity constraints may impact execution during volatile periods
- Market Cap Position: Ranked at #1456 with a market cap of $5.83 million, representing a smaller market presence that may be susceptible to larger price swings
VARA Regulatory Risks
- Compliance Uncertainty: Evolving cryptocurrency regulations across different jurisdictions may impact token accessibility and trading conditions
- Classification Challenges: Regulatory frameworks for Web3 infrastructure tokens remain under development, creating potential compliance considerations
- Jurisdictional Variations: Different regulatory approaches globally may affect token availability and usage in specific regions
VARA Technical Risks
- Development Execution: The success of the Vara Network platform depends on continued technical development and ecosystem adoption
- Competition Exposure: Other blockchain platforms offering similar Web3 development environments may impact market positioning
- Network Security: As with any blockchain project, potential vulnerabilities in smart contracts or network infrastructure require ongoing attention
VI. Conclusion and Action Recommendations
VARA Investment Value Assessment
Vara Network represents a specialized Web3 infrastructure project with innovative technical features including the Actor Model and Persistent Memory architecture. The token currently trades at $0.0012006 with a circulating supply of approximately 4.86 billion tokens (48.58% of max supply). While the project offers exposure to decentralized application development infrastructure, investors should carefully consider the substantial price decline of 92.92% over the past year and the relatively limited market capitalization and trading volume. The platform's technical innovations may present long-term value proposition, but near-term risks remain elevated given current market conditions and liquidity constraints.
VARA Investment Recommendations
✅ Beginners: Consider starting with educational research about Web3 infrastructure and the Vara Network ecosystem before allocating capital. If investing, limit exposure to a small percentage of overall portfolio and use secure storage solutions like Gate Web3 Wallet.
✅ Experienced Investors: Evaluate VARA as a speculative position within a diversified Web3 infrastructure allocation. Monitor project development progress, ecosystem growth metrics, and technical milestones. Implement strict position sizing and risk management protocols.
✅ Institutional Investors: Conduct comprehensive due diligence on the project's technology stack, development team, and competitive positioning within the Web3 infrastructure landscape. Consider liquidity constraints and execution strategies for larger positions.
VARA Trading Participation Methods
- Spot Trading: Available on Gate.com and select cryptocurrency exchanges with immediate settlement
- Dollar-Cost Averaging: Establish systematic purchase schedules to mitigate timing risk and average entry prices over time
- Limit Orders: Utilize limit orders to achieve desired entry and exit prices while managing execution in lower liquidity conditions
Cryptocurrency investment carries extremely high risk, and this article does not constitute investment advice. Investors should make prudent decisions based on their own risk tolerance and are advised to consult professional financial advisors. Never invest more than you can afford to lose.
FAQ
What is VARA token? What are its main uses and application scenarios?
VARA is the native cryptocurrency of Vara Network, designed to incentivize network participants. It enables users to actively engage in network activities and governance. With a total supply of 10 billion tokens, VARA powers smart contracts, messaging, and decentralized applications on the Vara ecosystem.
What is the VARA price prediction for 2024-2025?
VARA launched in early 2024, reaching a peak of 0.2 USD in January. Throughout 2025, the market experienced significant corrections, with prices adjusting substantially from initial levels. Market dynamics continue to shape VARA's trajectory.
What are the main factors affecting VARA price?
VARA price is primarily influenced by market demand, technological advancements, strategic partnerships, and competitive landscape. Successful product launches and technical milestones also drive price appreciation.
What are the advantages and disadvantages of VARA compared to other mainstream cryptocurrencies?
VARA's main advantage is its strict regulatory framework ensuring security and compliance, attracting institutional investors. However, rigid regulations may limit innovation speed and flexibility compared to decentralized cryptocurrencies. Its regulatory clarity provides stability but potentially less scalability.
What are the main risks of investing in VARA?
VARA faces high market volatility and potential total value loss. Price fluctuations can be significant. Investors should carefully assess risk tolerance and only invest capital they can afford to lose completely.
* The information is not intended to be and does not constitute financial advice or any other recommendation of any sort offered or endorsed by Gate.