This comprehensive analysis examines Vara Network (VARA) token price trajectory from 2026 to 2031, providing professional forecasts for Web3 infrastructure investors. As of January 2026, VARA trades at $0.001206 with a $5.86 million market cap, reflecting a 92.83% decline from previous highs. The article synthesizes historical price patterns, market sentiment analysis, and ecosystem development to project price ranges: 2026 ($0.00065-$0.00125), progressing to 2031 ($0.00159-$0.00194). It delivers actionable investment strategies including dollar-cost averaging and risk management frameworks tailored for different investor profiles. Coverage includes critical technical risks, liquidity constraints, and regulatory considerations. Spot trading opportunities are available on Gate.com with comprehensive guidance for both conservative and aggressive portfolio allocations in this emerging Web3 sector.
Introduction: VARA's Market Position and Investment Value
Vara Network (VARA), positioned as a cutting-edge Web3 platform for decentralized application development, has been building its ecosystem since its mainnet launch in September 2023. As of January 2026, VARA maintains a market capitalization of approximately $5.86 million, with a circulating supply of about 4.86 billion tokens, and the price stabilizing around $0.001206. This asset, characterized by its innovative integration of the Actor Model and Persistent Memory architecture, is playing an increasingly important role in the next-generation dApp development space.
This article will comprehensively analyze VARA's price trajectory from 2026 to 2031, combining historical patterns, market supply and demand dynamics, ecosystem development, and macroeconomic conditions to provide investors with professional price forecasts and practical investment strategies.
I. VARA Price History Review and Market Status
VARA Historical Price Evolution Trajectory
- 2023: VARA launched on September 20, 2023, with a publish price of $0.25, marking its entry into the cryptocurrency market
- 2024: The token experienced significant volatility, reaching a notable price level of $0.2 on January 17, 2024
- 2025: Market conditions led to substantial downward pressure, with the price declining to $0.0008251 on December 31, 2025
VARA Current Market Situation
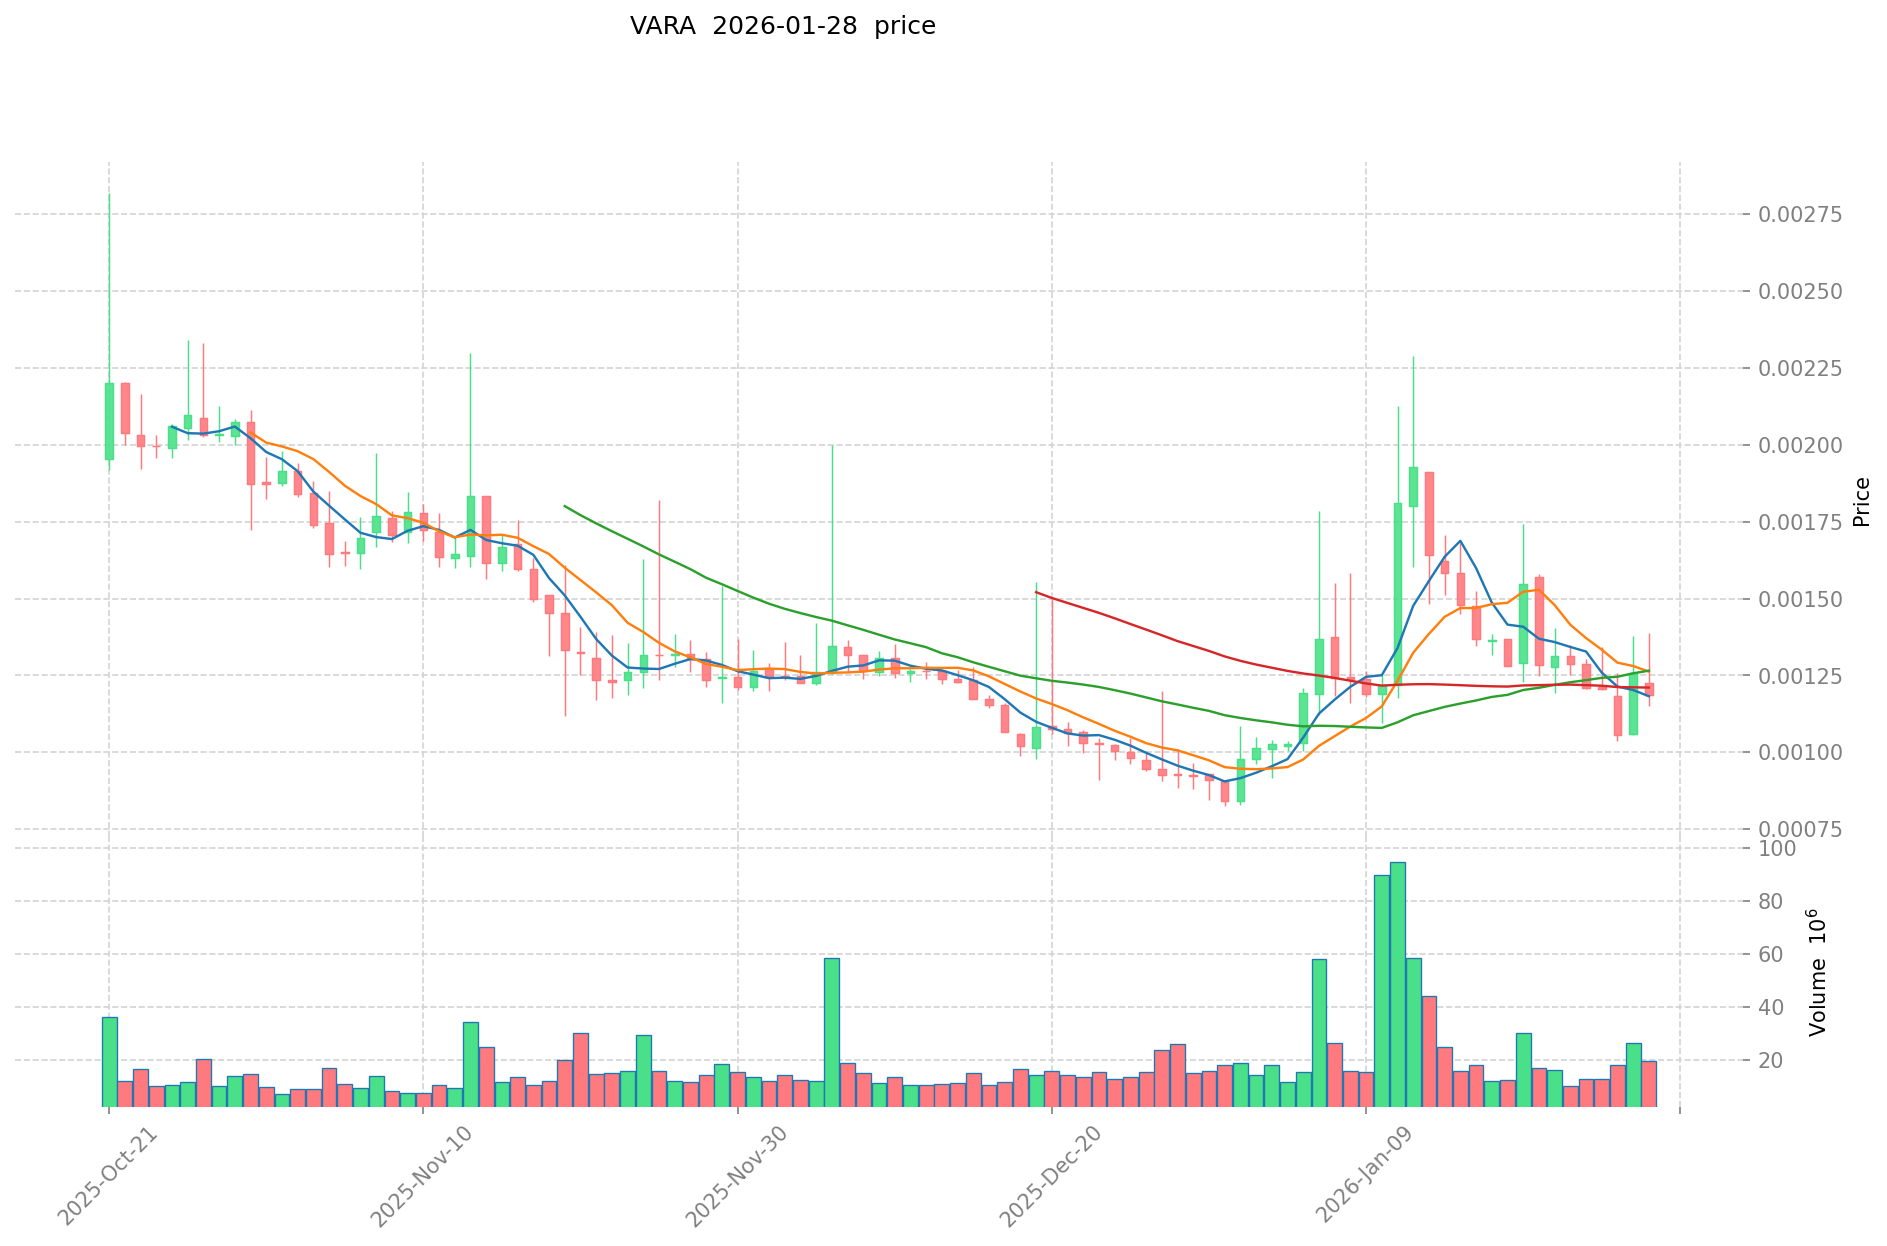
As of January 28, 2026, VARA is trading at $0.001206, demonstrating a recovery from recent lows. The token has shown mixed performance across different timeframes, with a 2.44% increase over the past 24 hours and a 30.36% gain over the past 30 days. However, the 7-day performance indicates a decline of 7.9%, and the 1-year data shows a substantial decrease of 92.83%.
The 24-hour trading volume stands at $23,246.98, with the price fluctuating between a high of $0.0017002 and a low of $0.00115 during this period. VARA's market capitalization is approximately $5.86 million, with a circulating supply of 4.86 billion tokens, representing 48.58% of the total supply of 10 billion tokens. The fully diluted market cap is calculated at $12.06 million.
The token's market share is 0.00037%, and it currently ranks at position 1454 in the cryptocurrency market. With a listing on 2 exchanges and maintaining active trading on Gate.com, VARA continues to provide liquidity for traders and investors.
Click to view the current VARA market price
VARA Market Sentiment Indicator
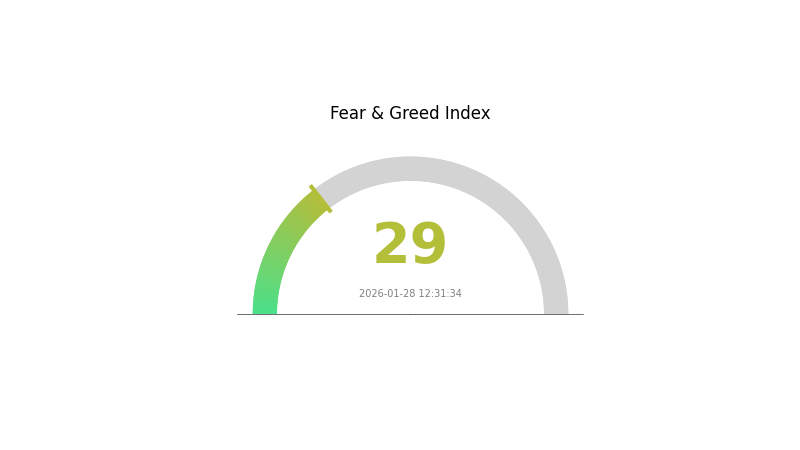
2026-01-28 Fear and Greed Index: 29 (Fear)
Click to view the current Fear & Greed Index
Today's crypto market sentiment shows significant fear with an index reading of 29. This low score indicates elevated market anxiety and risk aversion among investors. Market participants are displaying cautious behavior, with increased uncertainty about near-term price movements. Such fear-driven conditions often present contrarian opportunities for long-term investors, as extreme fear can lead to oversold conditions. However, traders should remain vigilant about further downside risks. Monitor key support levels and market indicators closely. Consider dollar-cost averaging strategies during periods of high fear to mitigate timing risks.
VARA Token Holder Distribution
The token holder distribution chart represents the allocation pattern of VARA tokens across different wallet addresses on the blockchain. This metric serves as a crucial indicator to assess the degree of decentralization within the VARA ecosystem and helps identify potential concentration risks that could impact market dynamics.
Based on the current holder distribution data, VARA exhibits a relatively concentrated ownership structure. The top-ranked addresses control a significant portion of the total token supply, which may create imbalances in voting power and market liquidity. Such concentration patterns are common in early-stage blockchain projects, where founding teams, early investors, and treasury wallets typically hold substantial positions. However, excessive concentration in a limited number of addresses could potentially expose the market to manipulation risks or trigger heightened volatility during large-scale transfers or selling events.
This distribution structure reflects VARA's current stage of market development. While some degree of concentration is expected during the initial phases of token distribution, the level of decentralization will likely improve as the project matures and tokens gradually disperse through community activities, staking mechanisms, and broader market participation. Investors should monitor changes in this distribution pattern over time, as increasing decentralization typically signals growing ecosystem health and reduced systemic risks associated with whale-dominated markets.
Click to view current VARA Token Holder Distribution

| Top |
Address |
Holding Qty |
Holding (%) |
II. Core Factors Influencing VARA's Future Price
Based on the provided materials, specific information about VARA as a cryptocurrency is not available. The search results primarily discuss BASF's financial performance (where "Vara" appears as an analyst consensus figure of 79 billion euros and 32 billion euros for different metrics), along with various unrelated topics about financial markets, AI predictions, and regulatory frameworks.
Without concrete data about VARA's supply mechanisms, institutional holdings, technological developments, or ecosystem applications, a comprehensive analysis following the template structure cannot be accurately generated. The materials do not contain information about:
- VARA's supply mechanism or tokenomics
- Institutional or major holder dynamics related to VARA
- Macroeconomic factors specifically affecting VARA
- Technical upgrades or ecosystem development for VARA
To provide an accurate and meaningful analysis of factors influencing VARA's future price trajectory, detailed information about the project's fundamentals, market dynamics, and development roadmap would be required.
III. 2026-2031 VARA Price Forecast
2026 Outlook
- Conservative forecast: $0.00065 - $0.00125
- Neutral forecast: around $0.0012
- Optimistic forecast: up to $0.00125 (contingent on favorable market conditions and increased adoption)
2027-2029 Mid-term Outlook
- Market stage expectation: Gradual growth phase with progressive price appreciation as the project matures and gains wider recognition
- Price range forecast:
- 2027: $0.00105 - $0.00169
- 2028: $0.00136 - $0.00162
- 2029: $0.00141 - $0.00209
- Key catalysts: Ecosystem development, technological enhancements, strategic partnerships, and broader cryptocurrency market trends may serve as primary drivers for price movement
2030-2031 Long-term Outlook
- Baseline scenario: $0.0012 - $0.00189 (assuming steady market growth and project development)
- Optimistic scenario: $0.00159 - $0.00194 (assuming enhanced adoption rates and favorable regulatory environment)
- Transformative scenario: potentially exceeding $0.00194 (under exceptionally favorable conditions including mass adoption and significant technological breakthroughs)
- 2026-01-28: VARA trading within the $0.00065 - $0.00125 range (early stage of forecasted period)
| Year |
Predicted High Price |
Predicted Average Price |
Predicted Low Price |
Price Change |
| 2026 |
0.00125 |
0.0012 |
0.00065 |
0 |
| 2027 |
0.00169 |
0.00122 |
0.00105 |
1 |
| 2028 |
0.00162 |
0.00146 |
0.00136 |
20 |
| 2029 |
0.00209 |
0.00154 |
0.00141 |
27 |
| 2030 |
0.00189 |
0.00181 |
0.0012 |
50 |
| 2031 |
0.00194 |
0.00185 |
0.00159 |
53 |
IV. VARA Professional Investment Strategy and Risk Management
VARA Investment Methodology
(1) Long-term Holding Strategy
- Suitable for: Investors with moderate to high risk tolerance seeking exposure to Web3 infrastructure development
- Operational Recommendations:
- Consider dollar-cost averaging (DCA) to reduce entry price volatility impact
- Monitor development milestones and ecosystem growth metrics quarterly
- Gate Web3 Wallet provides secure storage solution with multi-signature support
(2) Active Trading Strategy
- Technical Analysis Tools:
- Moving Averages: Track 50-day and 200-day MAs to identify potential trend reversals; current price shows significant distance from historical levels
- Volume Analysis: Monitor 24-hour trading volume ($23,246.98) relative to market cap to gauge liquidity conditions
- Swing Trading Considerations:
- Given the 24-hour range of $0.00115-$0.0017002, volatility levels suggest opportunities for short-term position management
- Exercise caution during low-volume periods which may amplify price swings
VARA Risk Management Framework
(1) Asset Allocation Principles
- Conservative Investors: 0.5-1% of crypto portfolio allocation
- Aggressive Investors: 2-3% of crypto portfolio allocation
- Professional Investors: Up to 5% with active position management
(2) Risk Hedging Solutions
- Portfolio Diversification: Balance VARA holdings with established Layer 1 protocols to reduce single-asset exposure
- Position Sizing: Limit individual position size to manage downside risk given the 92.83% decline over the past year
(3) Secure Storage Solutions
- Software Wallet Recommendation: Gate Web3 Wallet offers convenient access with institutional-grade security features
- Cold Storage Option: Consider hardware wallet solutions for long-term holdings exceeding significant portfolio thresholds
- Security Precautions: Never share private keys, enable two-factor authentication, and verify all transaction addresses before confirming transfers
V. VARA Potential Risks and Challenges
VARA Market Risks
- High Volatility: The token has experienced significant price fluctuations, declining 92.83% from its previous levels, indicating substantial market volatility
- Limited Liquidity: With only 2 exchange listings and relatively modest 24-hour trading volume, liquidity constraints may impact entry and exit execution
- Market Capitalization: Current market cap of approximately $5.86 million represents a micro-cap position with associated higher risk profile
VARA Regulatory Risks
- Jurisdictional Uncertainty: Evolving global regulatory frameworks for blockchain infrastructure projects may impact project operations and token utility
- Compliance Requirements: Potential future regulatory requirements for decentralized application platforms could affect project development trajectory
- Cross-border Considerations: International regulatory variations may affect token accessibility in different jurisdictions
VARA Technical Risks
- Network Security: As a platform supporting decentralized applications, the security of the Actor Model architecture and Persistent Memory implementation remains critical
- Competition Risk: Intensifying competition from established Layer 1 and Layer 2 solutions may challenge market positioning
- Adoption Challenges: Developer adoption and dApp ecosystem growth are essential for long-term value realization but remain uncertain
VI. Conclusion and Action Recommendations
VARA Investment Value Assessment
VARA represents a specialized infrastructure play in the Web3 development ecosystem, focusing on innovative architectural approaches through Actor Model and Persistent Memory integration. The long-term value proposition centers on potential developer adoption and differentiation in the competitive dApp platform landscape. However, investors should carefully consider the significant short-term risks, including substantial historical price decline, limited liquidity, and early-stage project maturity. The token currently trades at approximately 48.58% of its fully diluted valuation, suggesting high circulating supply relative to total supply.
VARA Investment Recommendations
✅ Beginners: Approach with extreme caution; consider allocating only a minimal portion of total crypto holdings (under 1%) after thorough research and understanding of Web3 infrastructure dynamics
✅ Experienced Investors: May consider tactical positions with strict risk management protocols, including predefined exit strategies and position sizing limits not exceeding 2-3% of crypto portfolio
✅ Institutional Investors: Evaluate as a speculative allocation within broader Web3 infrastructure thesis, with comprehensive due diligence on technical architecture, team credentials, and competitive positioning
VARA Trading Participation Methods
- Spot Trading: Available on Gate.com with VARA trading pairs, providing direct exposure to price movements
- Gradual Accumulation: Implement dollar-cost averaging strategy to mitigate timing risk and reduce average entry price volatility
- Portfolio Integration: Consider VARA as part of a diversified blockchain infrastructure basket rather than a standalone concentrated position
Cryptocurrency investments carry extremely high risks, and this article does not constitute investment advice. Investors should make prudent decisions based on their own risk tolerance and are advised to consult professional financial advisors. Never invest more than you can afford to lose.
FAQ
What is VARA token and what are its practical uses?
VARA is a Web 3.0 application platform token powering the Vara network ecosystem. It primarily addresses scalability challenges for decentralized applications, enabling efficient dApp operations and supporting blockchain infrastructure development.
How to predict and analyze the future price of VARA token?
Analyze VARA's market trends, trading volume, network adoption, and tokenomics. Based on current data, VARA could reach $0.007396-$0.067447 by 2037, representing potential 3291.29% growth. Monitor ecosystem developments and market conditions for informed predictions.
What are the main risk factors for investing in VARA tokens?
VARA token investments face high volatility risk due to lower market capitalization and trading volume. Technical risks include scalability challenges and network stability concerns. Market liquidity constraints may amplify price fluctuations and trading difficulties.
What are the differences between VARA tokens and other mainstream cryptocurrencies?
VARA focuses on Web3 ecosystem development and dApp construction, unlike Bitcoin and Ethereum which emphasize payments. VARA provides comprehensive developer tools and infrastructure, positioning itself as a specialized platform for decentralized application building rather than just a digital currency.
What are the key factors affecting VARA price fluctuations?
VARA price is primarily driven by market sentiment, macroeconomic trends, and technological innovation. Regulatory policies play a crucial role, while market supply and demand dynamics further influence price movements.
What are the development prospects and expectations for VARA token in 2024?
Vara Network's $VARA is expected to rise to $0.026 by end of 2024, representing significant growth from current levels. This prediction is based on market analysis, ongoing network development, and ecosystem expansion. Strong community adoption and increasing transaction volume are key drivers for positive momentum.
* The information is not intended to be and does not constitute financial advice or any other recommendation of any sort offered or endorsed by Gate.