This comprehensive guide analyzes VELODROME, a leading decentralized exchange token built on Optimism, providing expert price predictions from 2026 through 2031. Currently trading at $0.02079 with a market cap of $21.98 million, VELODROME demonstrates the ve(3,3) tokenomics model for optimized liquidity incentivization. The article examines historical price evolution, current market sentiment (extreme fear at index 20), and holding concentration risks, with forecasts ranging from $0.01641 to $0.05481 by 2031. Readers will discover three investment strategies—long-term holding for ecosystem believers, active trading using technical analysis, and diversified portfolio approaches—alongside comprehensive risk management frameworks. The guide addresses key concerns including price volatility, regulatory uncertainties, and smart contract risks, while offering practical trading methods on Gate. Ideal for beginners seeking foundational DeFi knowledge and experienced investors evaluating Optimism ecosystem opportuniti
Introduction: VELODROME's Market Position and Investment Value
Velodrome (VELODROME) serves as a liquidity incentivization solution built on the Optimism protocol, designed to optimize liquidity provision through its innovative dual-token model. Since its launch in 2022, the project has established itself as a significant participant in the decentralized finance ecosystem on Optimism. As of January 23, 2026, VELODROME maintains a market capitalization of approximately $21.98 million, with a circulating supply of around 1.057 billion tokens, trading at $0.02079. This asset, recognized for its ve(3,3) tokenomics mechanism, plays a growing role in decentralized exchange operations and liquidity management within the Layer 2 scaling solution landscape.
This article provides a comprehensive analysis of VELODROME's price trajectory from 2026 through 2031, examining historical patterns, market supply and demand dynamics, ecosystem development milestones, and macroeconomic conditions to deliver professional price forecasts and practical investment strategies for market participants.
I. VELODROME Price History Review and Market Status
VELODROME Historical Price Evolution Trajectory
- 2022: VELODROME reached its all-time low at $0.00557275 on July 5, marking the token's initial market entry phase with price discovery at relatively low levels.
- 2024: The token achieved its all-time high of $0.407515 on December 13, representing a substantial price appreciation from its historical low point.
- 2025-2026: Following the December 2024 peak, the token experienced a significant price correction, with the annual performance showing a decline of 81.39% over the past year.
VELODROME Current Market Status
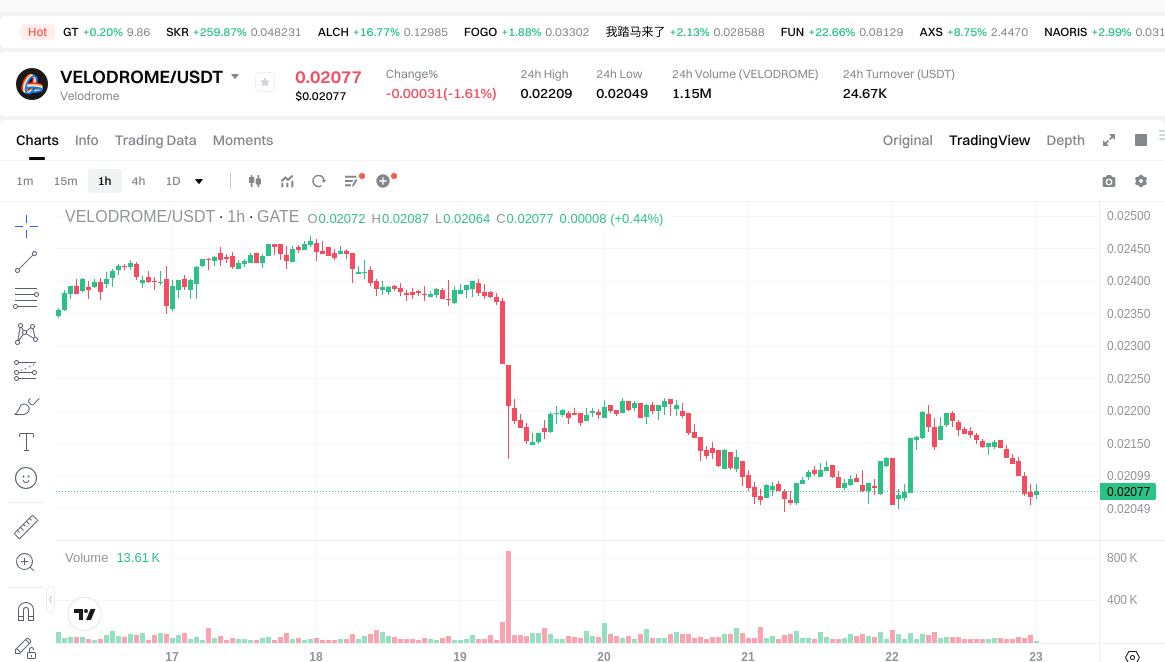
As of January 23, 2026, VELODROME is trading at $0.02079, positioning it at rank 836 in the cryptocurrency market. The token has demonstrated mixed short-term performance, with a 0.82% increase over the past hour, while experiencing a 1.14% decline over the past 24 hours. The 24-hour trading range spans from $0.02049 to $0.02209.
Over the past week, VELODROME has declined by 14.14%, though it maintains a 7.35% gain over the 30-day period. The token's 24-hour trading volume stands at $24,678.19, with a circulating market capitalization of approximately $21.98 million.
The current circulating supply is 1,057,238,852.33 VELODROME tokens, representing 45.02% of the total supply of 2,348,630,830.20 tokens. With an unlimited maximum supply, the fully diluted market capitalization reaches $48.83 million. The token currently holds a 0.0015% market dominance, with the market cap to fully diluted valuation ratio at 45.02%.
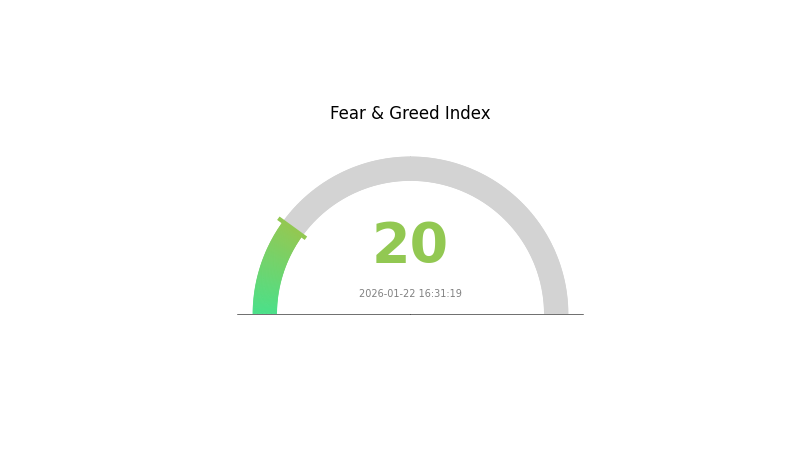
VELODROME has a holder base of 57,941 addresses and is available for trading on 6 exchanges. The current market sentiment index indicates a reading of 20, reflecting an "Extreme Fear" environment in the broader cryptocurrency market as of January 22, 2026.
Click to view the current VELODROME market price
VELODROME Market Sentiment Indicator
2026-01-22 Fear and Greed Index: 20 (Extreme Fear)
Click to view the current Fear & Greed Index
The crypto market is currently experiencing extreme fear, with the Fear and Greed Index at 20. This indicates significant market pessimism and heightened investor anxiety. During such periods, market volatility typically increases as traders react emotionally to price fluctuations. While extreme fear can create opportunities for long-term investors to accumulate assets at lower prices, it also signals elevated risk. Market participants should exercise caution, conduct thorough research, and avoid making impulsive decisions driven by fear. Monitoring the index trends and fundamental developments remains essential for informed trading strategies.
VELODROME Holding Distribution
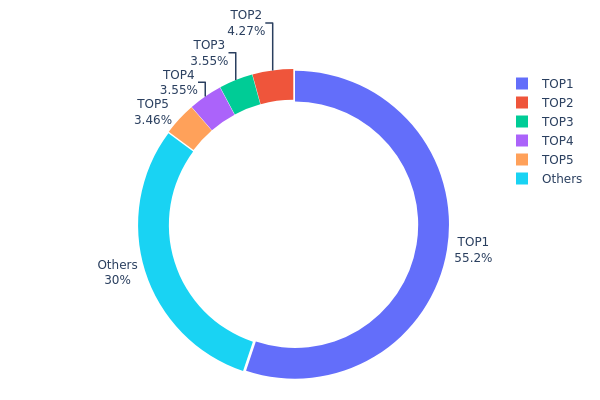
The holding distribution chart reflects the allocation of token holdings across different wallet addresses within the blockchain network, serving as a key indicator of decentralization level and market structure stability. By analyzing the concentration of holdings among top addresses, investors can assess potential manipulation risks and the health of token circulation.
According to the current data, VELODROME exhibits a highly concentrated holding pattern. The top address holds approximately 1.29 billion tokens, representing 55.15% of the total supply, indicating significant centralization. The second through fifth addresses hold 4.27%, 3.54%, 3.54%, and 3.46% respectively, with the top five addresses collectively controlling approximately 69.96% of the total supply. The remaining 30.04% is distributed among other addresses, suggesting limited token dispersion across the broader market.
This concentration level poses notable concerns for market stability. The dominant position of the largest holder creates asymmetric market power, potentially enabling significant price influence through large-scale buy or sell orders. Such concentration increases volatility risk and may discourage participation from retail investors who perceive reduced fairness in price discovery mechanisms. Furthermore, the substantial holdings by top addresses could indicate locked treasury reserves, team allocations, or strategic partnerships, though without additional context regarding vesting schedules or lock-up periods, the immediate liquidity risk remains elevated.
From a decentralization perspective, VELODROME's current holding structure suggests a relatively centralized ecosystem. While concentrated holdings are common during early project stages or among governance-focused protocols, this distribution pattern warrants careful monitoring. The limited dispersion beyond top holders may impact governance participation and long-term network resilience, though it could also reflect intentional tokenomics design aimed at maintaining protocol stability through concentrated governance rights.
Click to view current VELODROME Holding Distribution
| Top |
Address |
Holding Qty |
Holding (%) |
| 1 |
0xfaf8...06787d |
1291129.15K |
55.15% |
| 2 |
0x6867...2b450f |
100000.02K |
4.27% |
| 3 |
0x5e68...c7f88d |
83100.92K |
3.54% |
| 4 |
0x12e3...109aee |
83100.92K |
3.54% |
| 5 |
0x65e3...394a92 |
81078.79K |
3.46% |
| - |
Others |
702700.30K |
30.04% |
II. Core Factors Affecting VELODROME's Future Price
Based on the provided materials, there is insufficient data available to analyze the core factors affecting VELODROME's future price at this time. Key areas such as supply mechanisms, institutional dynamics, macroeconomic environment, and technical developments require specific data points that are not present in the current reference materials.
For a comprehensive analysis of VELODROME's price drivers, readers may want to monitor official project announcements, on-chain data from blockchain explorers, and verified market reports as they become available.
III. 2026-2031 VELODROME Price Forecast
2026 Outlook
- Conservative Forecast: $0.01641 - $0.02077
- Neutral Forecast: $0.02077
- Optimistic Forecast: $0.027 (subject to favorable market conditions and increased adoption)
2027-2029 Outlook
- Market Stage Expectation: The token may experience gradual growth as the DeFi ecosystem continues to mature, with potential fluctuations driven by broader cryptocurrency market cycles and protocol developments.
- Price Range Forecast:
- 2027: $0.01409 - $0.02651
- 2028: $0.02218 - $0.03477
- 2029: $0.02879 - $0.04408
- Key Catalysts: Expansion of liquidity pools, protocol upgrades, strategic partnerships within the DeFi space, and overall market sentiment towards decentralized finance solutions.
2030-2031 Long-term Outlook
- Baseline Scenario: $0.02259 - $0.05481 (assuming steady protocol growth and sustained user engagement)
- Optimistic Scenario: $0.04592 - $0.05481 (driven by significant protocol innovation and mainstream DeFi adoption)
- Transformative Scenario: Above $0.05481 (contingent on breakthrough integrations, widespread institutional adoption, and exceptional market conditions)
| Year |
Predicted High Price |
Predicted Average Price |
Predicted Low Price |
Price Change |
| 2026 |
0.027 |
0.02077 |
0.01641 |
0 |
| 2027 |
0.02651 |
0.02389 |
0.01409 |
14 |
| 2028 |
0.03477 |
0.0252 |
0.02218 |
21 |
| 2029 |
0.04408 |
0.02999 |
0.02879 |
44 |
| 2030 |
0.05481 |
0.03703 |
0.02259 |
78 |
| 2031 |
0.04822 |
0.04592 |
0.02526 |
120 |
IV. VELODROME Professional Investment Strategy and Risk Management
VELODROME Investment Methodology
(1) Long-term Holding Strategy
- Target Audience: Investors who believe in the long-term development potential of Optimism ecosystem and DeFi liquidity solutions
- Operational Recommendations:
- Consider accumulating positions during market corrections when the price approaches support levels around $0.020
- Monitor the protocol's TVL growth and weekly emissions distribution as indicators of ecosystem health
- Utilize Gate Web3 Wallet for secure storage of VELODROME tokens with multi-signature protection
(2) Active Trading Strategy
- Technical Analysis Tools:
- Moving Averages: Track 7-day and 30-day moving averages to identify trend reversals; current 7-day decline of 14.14% suggests short-term bearish momentum
- Volume Analysis: Monitor 24-hour trading volume ($24,678) relative to market cap to gauge liquidity and trading interest
- Swing Trading Points:
- Consider taking partial profits during rallies toward recent highs around $0.022
- Set stop-loss orders below key support levels to manage downside risk
VELODROME Risk Management Framework
(1) Asset Allocation Principles
- Conservative Investors: 1-3% of crypto portfolio allocation
- Aggressive Investors: 5-8% of crypto portfolio allocation
- Professional Investors: 8-12% of crypto portfolio allocation with active hedging strategies
(2) Risk Hedging Solutions
- Portfolio Diversification: Combine VELODROME with other Optimism ecosystem tokens and stablecoins to reduce single-asset exposure
- Position Sizing: Scale into positions gradually rather than entering full exposure at once, especially given the 81.39% annual decline
(3) Secure Storage Solutions
- Hot Wallet Recommendation: Gate Web3 Wallet offers convenient access for active trading with built-in security features
- Cold Storage Option: Transfer long-term holdings to hardware wallet solutions after accumulating significant positions
- Security Precautions: Enable two-factor authentication, never share private keys, verify contract addresses (0x9560e827aF36c94D2Ac33a39bCE1Fe78631088Db on Optimism) before transactions
V. VELODROME Potential Risks and Challenges
VELODROME Market Risks
- Price Volatility: The token has experienced significant volatility with an 81.39% decline over the past year, reflecting sensitivity to broader DeFi market conditions
- Limited Trading Volume: Daily trading volume of $24,678 suggests relatively limited liquidity compared to major assets, which may result in higher slippage during large transactions
- Market Cap Position: Ranking at #836 with 0.0015% market dominance indicates exposure to competitive pressure from larger DeFi protocols
VELODROME Regulatory Risks
- DeFi Protocol Oversight: Increasing regulatory scrutiny of decentralized finance platforms may impact the operational environment for liquidity protocols
- Token Classification Uncertainty: Evolving regulatory frameworks regarding governance tokens could affect VELODROME's utility and trading status
- Jurisdictional Compliance: Changes in cryptocurrency regulations across different regions may impact accessibility and adoption of the protocol
VELODROME Technical Risks
- Smart Contract Vulnerabilities: As an ERC-20 token with governance mechanisms involving veNFTs, the protocol relies on complex smart contract interactions that may contain undiscovered vulnerabilities
- Optimism Network Dependencies: VELODROME operates exclusively on the Optimism network, creating concentration risk if the Layer 2 solution experiences technical issues or security breaches
- Protocol Competition: The presence of alternative liquidity solutions on Optimism and other networks may impact VELODROME's ability to attract and retain liquidity providers
VI. Conclusion and Action Recommendations
VELODROME Investment Value Assessment
VELODROME represents a specialized DeFi infrastructure play focused on optimizing liquidity incentives within the Optimism ecosystem. The protocol's dual-token model (VELO for utility and veVELO for governance) builds upon the Solidly foundation with improvements aimed at achieving sustainable liquidity. However, the significant 81.39% annual price decline and modest market position suggest investors should approach with caution. Long-term value depends on the protocol's ability to capture meaningful market share within the growing Layer 2 ecosystem, while short-term risks include continued price volatility and limited liquidity.
VELODROME Investment Recommendations
✅ Beginners: Consider starting with a small allocation (1-2% of crypto portfolio) only after thoroughly understanding DeFi protocols and the Optimism ecosystem. Use Gate.com for straightforward spot trading access.
✅ Experienced Investors: May consider swing trading opportunities based on technical indicators, maintaining 3-5% portfolio allocation with defined stop-loss levels. Monitor protocol TVL trends and governance developments.
✅ Institutional Investors: Could explore strategic positions if aligned with broader Optimism ecosystem thesis, implementing risk management through portfolio hedging and phased accumulation strategies.
VELODROME Trading Participation Methods
- Spot Trading: Purchase VELODROME directly on Gate.com with access to trading pairs and real-time market data
- DeFi Integration: Participate in the Velodrome protocol directly by providing liquidity or engaging in governance through veNFT holdings
- Portfolio Tracking: Monitor holdings through Gate.com portfolio management tools with real-time price alerts and performance analytics
Cryptocurrency investment carries extremely high risks, and this article does not constitute investment advice. Investors should make prudent decisions based on their own risk tolerance and are advised to consult professional financial advisors. Never invest more than you can afford to lose.
FAQ
What factors influence Velodrome (VELO) token price?
VELO price is influenced by market demand, trading volume, liquidity pool activity, governance decisions, broader crypto market conditions, and protocol adoption rates on the Optimism network.
How can I predict Velodrome price movements in the short term?
Monitor trading volume changes, on-chain activity, and liquidity metrics. Track market sentiment through social channels and analyze technical indicators like support/resistance levels, moving averages, and volume patterns. Combine fundamental protocol updates with chart analysis for better short-term predictions.
Velodrome token has demonstrated strong price growth since its launch, driven by its DEX platform success and strategic partnerships. The token experienced significant rallies during market upswings and maintained support during downturns, reflecting solid fundamental adoption in the Optimism ecosystem.
What are the risks involved in Velodrome price prediction?
Velodrome price prediction involves market volatility risks, liquidity fluctuations, and smart contract vulnerabilities. Trading volume changes, protocol updates, and broader cryptocurrency market movements significantly impact VELO token prices. Predictive models may not account for unexpected events or market sentiment shifts.
How does Velodrome's TVL and trading volume affect its token price?
Higher TVL and trading volume increase Velodrome's protocol utility and network effects, driving stronger token demand. Growing liquidity attracts more traders, boosting fee generation and token value appreciation through enhanced ecosystem activity and user adoption.
What is the difference between Velodrome and other DEX tokens like Uniswap?
Velodrome operates as an Optimism-native DEX with ve-tokenomics, enabling governance and liquidity incentives through voting. Unlike Uniswap, it prioritizes protocol-owned liquidity and community-directed emissions, offering superior capital efficiency and lower trading fees for users.
* The information is not intended to be and does not constitute financial advice or any other recommendation of any sort offered or endorsed by Gate.