This comprehensive analysis examines VELVET's price trajectory from 2026 through 2031, positioning it as a DeFAI operating system with 100,000+ active users across multiple blockchains. The article reviews historical volatility, current market status ($0.1374 as of January 2026), and provides tiered price forecasts: conservative ($0.1158-$0.1363 for 2026) to optimistic scenarios ($0.2913 by 2031). It addresses key investment considerations including tokenomics, market concentration risks, and liquidity metrics. Professional investment strategies cover long-term holding and active trading approaches, alongside risk management frameworks for different investor profiles. The analysis also highlights technical risks, regulatory uncertainties, and market volatility concerns. Suitable for both beginners and experienced investors seeking structured guidance on VELVET trading via Gate and other platforms, with emphasis on portfolio diversification and secure asset management.
Introduction: VELVET's Market Position and Investment Value
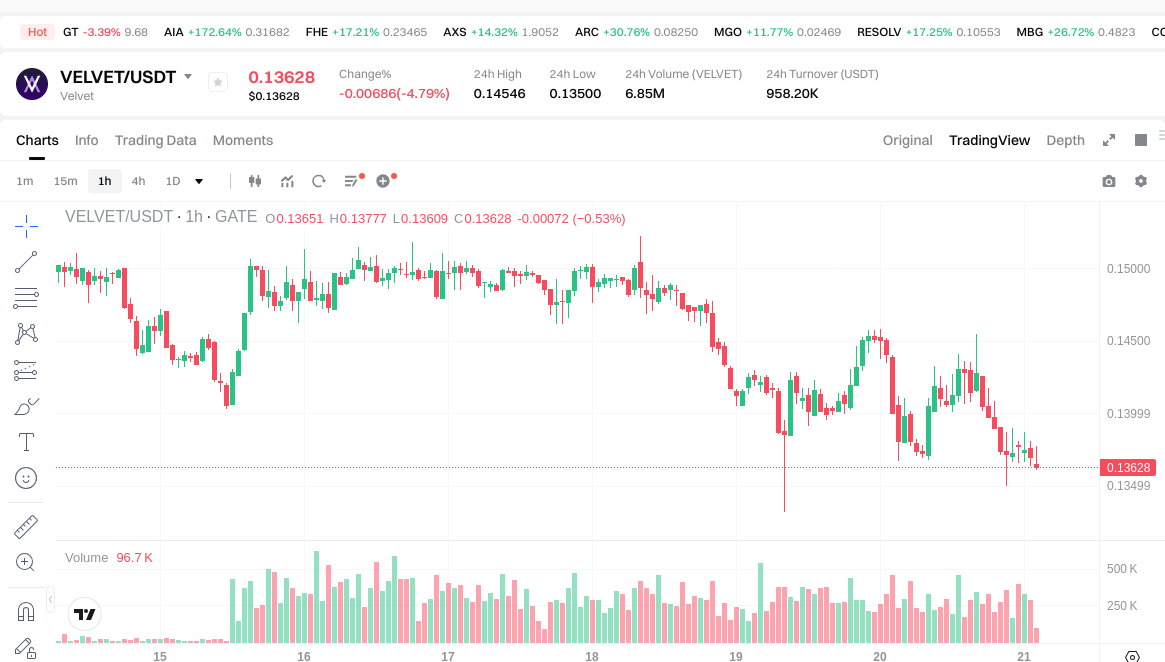
Velvet (VELVET), as a DeFAI Operating System designed to streamline onchain research, trading, and portfolio management, has gained notable traction since its launch in 2025. With over 100,000 users actively trading and executing DeFi strategies across BNB Chain, Base, Solana, Ethereum, and Sonic, the platform has established itself as a significant player in the decentralized finance ecosystem. As of January 21, 2026, VELVET maintains a market capitalization of approximately $34.10 million, with a circulating supply of around 248.27 million tokens and a current price hovering near $0.1374. This asset, characterized as a "multi-agent AI-powered DeFi infrastructure," is playing an increasingly vital role in democratizing access to sophisticated trading strategies and portfolio management tools.
This article provides a comprehensive analysis of VELVET's price trajectory from 2026 through 2031, combining historical patterns, market supply-demand dynamics, ecosystem development milestones, and macroeconomic factors to deliver professional price forecasts and practical investment strategies for both new and experienced investors.
I. VELVET Price History Review and Market Status
VELVET Historical Price Evolution Trajectory
- 2025: VELVET experienced significant price volatility during its initial market phase, with the price reaching a low of $0.037 in July 2025
- 2025: The token showed substantial growth momentum in the latter half of the year, with the price climbing to $0.32332 in September 2025
- 2025-2026: Following the peak period, the market entered a consolidation phase with notable corrections across various timeframes
VELVET Current Market Status
As of January 21, 2026, VELVET is trading at $0.13735, representing a decline from recent trading levels. The token has demonstrated mixed performance across different time horizons, with short-term pressure evident in the 1-hour decline of 0.89% and 24-hour decrease of 4.25%. Over the past week, VELVET has declined by 7.91%, while the 30-day performance shows a more pronounced correction of 29.86%.
The token maintains a market capitalization of approximately $34.10 million, with a circulating supply of 248.27 million tokens out of a maximum supply of 1 billion tokens. This represents a circulation ratio of 24.83%. The fully diluted market cap stands at $137.35 million, with a 24-hour trading volume of $964,390.85.
VELVET currently holds a market share of 0.0043% and ranks 656th among cryptocurrencies. The token is held by approximately 28,762 addresses and is listed on 16 exchanges. The current market sentiment index indicates a fear level of 32, suggesting cautious positioning among market participants.
Despite the recent short-term corrections, VELVET has demonstrated substantial growth over the annual period, with a 200.30% increase from its lower price levels. The token's price range over the past 24 hours has fluctuated between $0.135 and $0.14546.
Click to view current VELVET market price
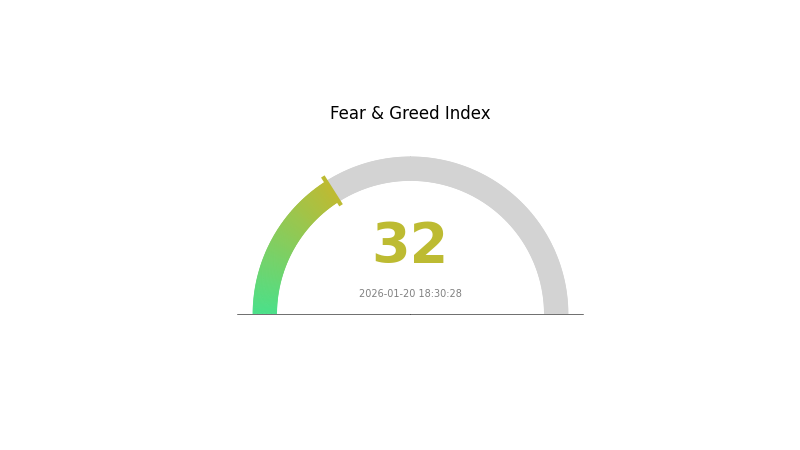
VELVET Market Sentiment Index
2026-01-20 Fear and Greed Index: 32 (Fear)
Click to view the current Fear & Greed Index
Market participants are currently experiencing significant fear sentiment with an index reading of 32. This indicates heightened risk aversion and cautious market behavior. Investors are predominantly defensive, with reduced appetite for risk-taking. Such fear-driven conditions often present contrarian opportunities for seasoned traders who recognize potential market dislocations. Consider your portfolio positioning carefully during this phase of market uncertainty on Gate.com.
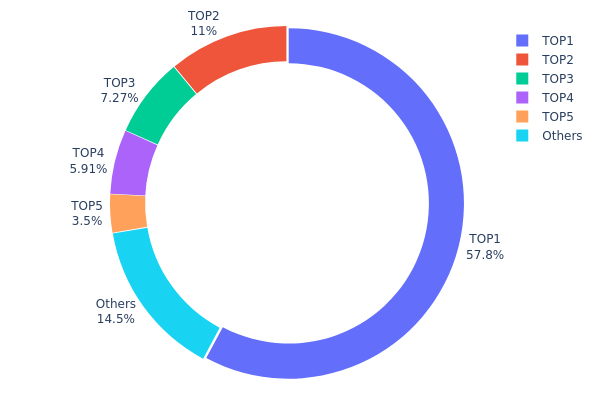
VELVET Holding Distribution
The holding distribution chart reflects the concentration of token ownership across different wallet addresses, serving as a crucial indicator of decentralization and market structure stability. By analyzing the percentage of total supply controlled by top holders, investors can assess the risk of price manipulation and the overall health of the token's distribution pattern.
According to the current data, VELVET exhibits a highly concentrated holding structure. The top address controls 577.95 million tokens, accounting for 57.79% of the total supply, while the top five addresses collectively hold 854.92 million tokens, representing 85.47% of the circulating supply. Such concentration suggests that a small number of entities possess significant influence over market dynamics. The remaining 145.08 million tokens (14.53%) are distributed among other addresses, indicating limited participation from the broader holder base.
This centralized distribution pattern presents notable implications for market stability and price volatility. Large holders possess substantial power to impact market sentiment and liquidity through their trading decisions. In scenarios where major addresses execute significant sell-offs, the token price could experience sharp downward pressure due to supply imbalances. Furthermore, the high concentration ratio raises concerns about potential market manipulation risks, as coordinated actions by top holders could artificially influence price movements. From a long-term perspective, this distribution structure may hinder the development of a robust, decentralized ecosystem, potentially affecting investor confidence and the project's overall credibility in the market.
Click to view current VELVET Holding Distribution
| Top |
Address |
Holding Qty |
Holding (%) |
| 1 |
0x6e0b...bed395 |
577947.32K |
57.79% |
| 2 |
0xd19d...72b56c |
110193.85K |
11.01% |
| 3 |
0x6bff...f8f36a |
72666.67K |
7.26% |
| 4 |
0x75e7...b094bb |
59115.67K |
5.91% |
| 5 |
0xcd57...3e14ee |
35000.00K |
3.50% |
| - |
Others |
145076.48K |
14.53% |
II. Core Factors Influencing VELVET's Future Price
Based on the available information, there is insufficient data to provide a comprehensive analysis of the core factors that may influence VELVET's future price. The provided materials do not contain specific information regarding supply mechanisms, institutional holdings, macroeconomic positioning, or technical development roadmaps for VELVET.
To conduct a thorough price factor analysis, the following categories would typically be examined:
- Supply-side dynamics and tokenomics structure
- Institutional adoption patterns and major holder activities
- Broader economic conditions and their correlation with digital asset performance
- Technical upgrades and ecosystem expansion initiatives
However, without concrete data on these aspects for VELVET, it would be inappropriate to speculate or extrapolate conclusions. Investors interested in understanding VELVET's price drivers should seek primary sources including official project documentation, on-chain analytics, and verified market research reports.
III. 2026-2031 VELVET Price Prediction
2026 Outlook
- Conservative Prediction: $0.1158 - $0.1363
- Neutral Prediction: Around $0.1363
- Optimistic Prediction: Up to $0.1417 (requires favorable market conditions and increased adoption)
2027-2029 Mid-term Outlook
- Market Stage Expectation: The token may experience gradual growth as the project develops its ecosystem and expands its user base. Market conditions and broader cryptocurrency trends will play a significant role in determining actual performance.
- Price Range Prediction:
- 2027: $0.0848 - $0.1487
- 2028: $0.1007 - $0.1726
- 2029: $0.0981 - $0.2121
- Key Catalysts: Technology development, partnership expansion, market sentiment improvement, and increased platform utility could serve as primary drivers for potential price appreciation.
2030-2031 Long-term Outlook
- Baseline Scenario: $0.1407 - $0.1852 (assuming steady project development and stable market conditions)
- Optimistic Scenario: $0.1245 - $0.2913 (assuming significant ecosystem expansion and favorable regulatory environment)
- Transformational Scenario: Potential to reach $0.2913 by 2031 (requires exceptional adoption rates, major partnerships, and sustained bull market conditions)
- 2026-01-21: VELVET trading range expected between $0.1158 and $0.1417 (early-stage consolidation period)
| Year |
Predicted High Price |
Predicted Average Price |
Predicted Low Price |
Price Change |
| 2026 |
0.14173 |
0.13628 |
0.11584 |
0 |
| 2027 |
0.14874 |
0.13901 |
0.08479 |
1 |
| 2028 |
0.17264 |
0.14387 |
0.10071 |
4 |
| 2029 |
0.21207 |
0.15826 |
0.09812 |
15 |
| 2030 |
0.21664 |
0.18516 |
0.14072 |
34 |
| 2031 |
0.29131 |
0.2009 |
0.12456 |
46 |
IV. VELVET Professional Investment Strategy and Risk Management
VELVET Investment Methodology
(1) Long-term Holding Strategy
- Suitable for: Long-term DeFi believers and strategic portfolio investors
- Operational recommendations:
- Monitor the development of Velvet's DeFAI operating system and user growth on BNB Chain, Base, Solana, Ethereum, and Sonic
- Track the expansion of vault creations and adoption by KOLs, traders, and crypto hedge funds
- Utilize Gate Web3 Wallet for secure storage with multi-chain compatibility
(2) Active Trading Strategy
- Technical analysis tools:
- Volume analysis: Monitor 24-hour trading volume ($964,390.85) relative to market cap trends
- Support and resistance levels: Current support around $0.135 (24H low), resistance at $0.145 (24H high)
- Swing trading considerations:
- Track circulating supply ratio (24.83%) and potential supply expansion impact
- Monitor holder count growth (28,762 holders) as adoption indicator
VELVET Risk Management Framework
(1) Asset Allocation Principles
- Conservative investors: 2-5% of crypto portfolio
- Active investors: 5-10% of crypto portfolio
- Professional investors: 10-15% with dynamic position sizing
(2) Risk Hedging Approaches
- Portfolio diversification: Balance VELVET with established DeFi tokens
- Position sizing: Adjust exposure based on market volatility and project developments
(3) Secure Storage Solutions
- Multi-chain wallet recommendation: Gate Web3 Wallet supporting BEP-20 and multi-chain assets
- Hardware wallet integration: For holdings exceeding $10,000
- Security considerations: Verify contract address (0x8b194370825e37b33373e74a41009161808c1488) on BSC, enable 2FA, and avoid sharing private keys
V. VELVET Potential Risks and Challenges
VELVET Market Risks
- Price volatility: Recent 30-day decline of 29.86% indicates significant short-term volatility
- Liquidity concerns: Relatively low 24H volume compared to circulating market cap may impact large order execution
- Market share: 0.0043% market dominance suggests exposure to broader market sentiment shifts
VELVET Regulatory Risks
- DeFi regulatory uncertainty: Evolving global regulatory frameworks may impact DeFAI platforms
- Multi-chain compliance: Operations across BNB Chain, Base, Solana, Ethereum, and Sonic involve multiple regulatory jurisdictions
- Tokenized strategy offerings: Vault creation features may face increased scrutiny under securities regulations
VELVET Technical Risks
- Smart contract vulnerabilities: Multi-chain deployment increases potential attack surface
- AI Co-Pilot dependency: Integration of multi-agent AI systems introduces technical complexity
- Infrastructure scalability: Supporting 100,000+ users and 10,000+ vaults requires robust technical architecture
VI. Conclusion and Action Recommendations
VELVET Investment Value Assessment
Velvet presents an innovative DeFAI operating system with notable user adoption (100,000+ users) and ecosystem development (10,000+ vaults). The platform's multi-chain presence and AI integration position it within emerging DeFi trends. However, recent price performance (down 29.86% over 30 days) and low circulating supply ratio (24.83%) suggest elevated short-term volatility. Long-term value depends on sustained user growth, technological advancement, and competitive differentiation in the DeFAI space.
VELVET Investment Recommendations
✅ Beginners: Start with small allocations (1-3% of crypto portfolio), focus on understanding DeFi and AI integration concepts before increasing exposure
✅ Experienced investors: Consider moderate positions (5-8%) with active monitoring of platform metrics, user growth, and vault creation trends
✅ Institutional investors: Evaluate strategic allocation (up to 10%) with thorough due diligence on technology stack, competitive positioning, and regulatory landscape
VELVET Trading Participation Methods
- Spot trading: Available on 16 exchanges including Gate.com with active BEP-20 trading pairs
- DeFi participation: Engage with Velvet's native platform for strategy creation and vault management
- Dollar-cost averaging: Systematic accumulation to mitigate timing risk given current volatility patterns
Cryptocurrency investment carries extremely high risk, and this article does not constitute investment advice. Investors should make prudent decisions based on their own risk tolerance and are advised to consult professional financial advisors. Never invest more than you can afford to lose.
FAQ
What is the historical price trend of VELVET tokens?
VELVET has shown volatile price movements since launch. Early phases saw steady growth, followed by market-driven corrections. Recent momentum indicates bullish recovery with increasing trading volume. Long-term trajectory reflects growing ecosystem adoption and community expansion.
What are the main factors affecting VELVET price?
VELVET price is influenced by market demand, trading volume, project developments, tokenomics, overall crypto market sentiment, adoption rate, and competition within the ecosystem.
What is the VELVET price prediction for 2024?
Based on market analysis, VELVET demonstrated strong growth potential in 2024. Analysts projected prices ranging from $0.15 to $0.35, driven by increasing adoption and ecosystem expansion. However, actual performance varied based on market conditions and project developments.
What are the advantages of VELVET compared to similar tokens?
VELVET offers superior tokenomics with deflationary mechanisms, robust liquidity infrastructure, and innovative yield farming features. Its governance model empowers community participation, ensuring sustainable long-term value creation and market resilience against volatility.
What are the main risks of investing in VELVET tokens?
VELVET token risks include market volatility, regulatory uncertainty in crypto sectors, liquidity fluctuations, and project execution risks. Token value depends on market demand, adoption rates, and broader cryptocurrency market conditions. Early-stage projects face higher uncertainty.
What is the basic fundamentals and development prospects of the VELVET project?
VELVET demonstrates strong fundamentals with innovative blockchain technology and expanding ecosystem partnerships. The project shows promising growth trajectory through increased transaction volume and community engagement, positioning itself for substantial long-term appreciation potential in the Web3 sector.
* The information is not intended to be and does not constitute financial advice or any other recommendation of any sort offered or endorsed by Gate.