This comprehensive article provides professional analysis of Vyvo Smart Chain (VSC) price trends and investment potential through 2031. Starting from VSC's current market position at $0.001505 with $6.90 million capitalization, the analysis examines historical price movements, market sentiment, and ecosystem development factors. The article projects VSC price ranges for 2026-2031, offering conservative, neutral, and optimistic scenarios based on adoption rates and market conditions. Key sections cover core investment strategies including long-term holding and active trading approaches, while detailing risk management frameworks suitable for different investor types. The guide addresses market risks, regulatory challenges, and technical considerations, providing actionable trading methods on Gate.com. Comprehensive recommendations assist beginners through institutional investors in making informed decisions, emphasizing portfolio diversification and secure storage solutions for sustainable blockchain investmen
Introduction: VSC's Market Position and Investment Value
Vyvo Smart Chain (VSC), as a blockchain infrastructure connecting IoT device users with institutions through decentralized health data management, has been developing since its launch in 2023. As of January 2026, VSC's market capitalization stands at approximately $6.90 million, with a circulating supply of around 4.58 billion tokens, and the price maintaining at approximately $0.001505. This asset, characterized as a "health data ownership solution", is playing an increasingly important role in the wearable technology and medical research sectors.
This article will comprehensively analyze VSC's price trends from 2026 to 2031, combining historical patterns, market supply and demand dynamics, ecosystem development, and macroeconomic conditions to provide investors with professional price forecasts and practical investment strategies.
I. VSC Price History Review and Market Status
VSC Historical Price Evolution Trajectory
- 2023: VSC was published on September 28, 2023, marking the initial entry into the cryptocurrency market
- 2024: In March 2024, VSC experienced significant price movement, reaching a peak of $0.04196 on March 9, 2024
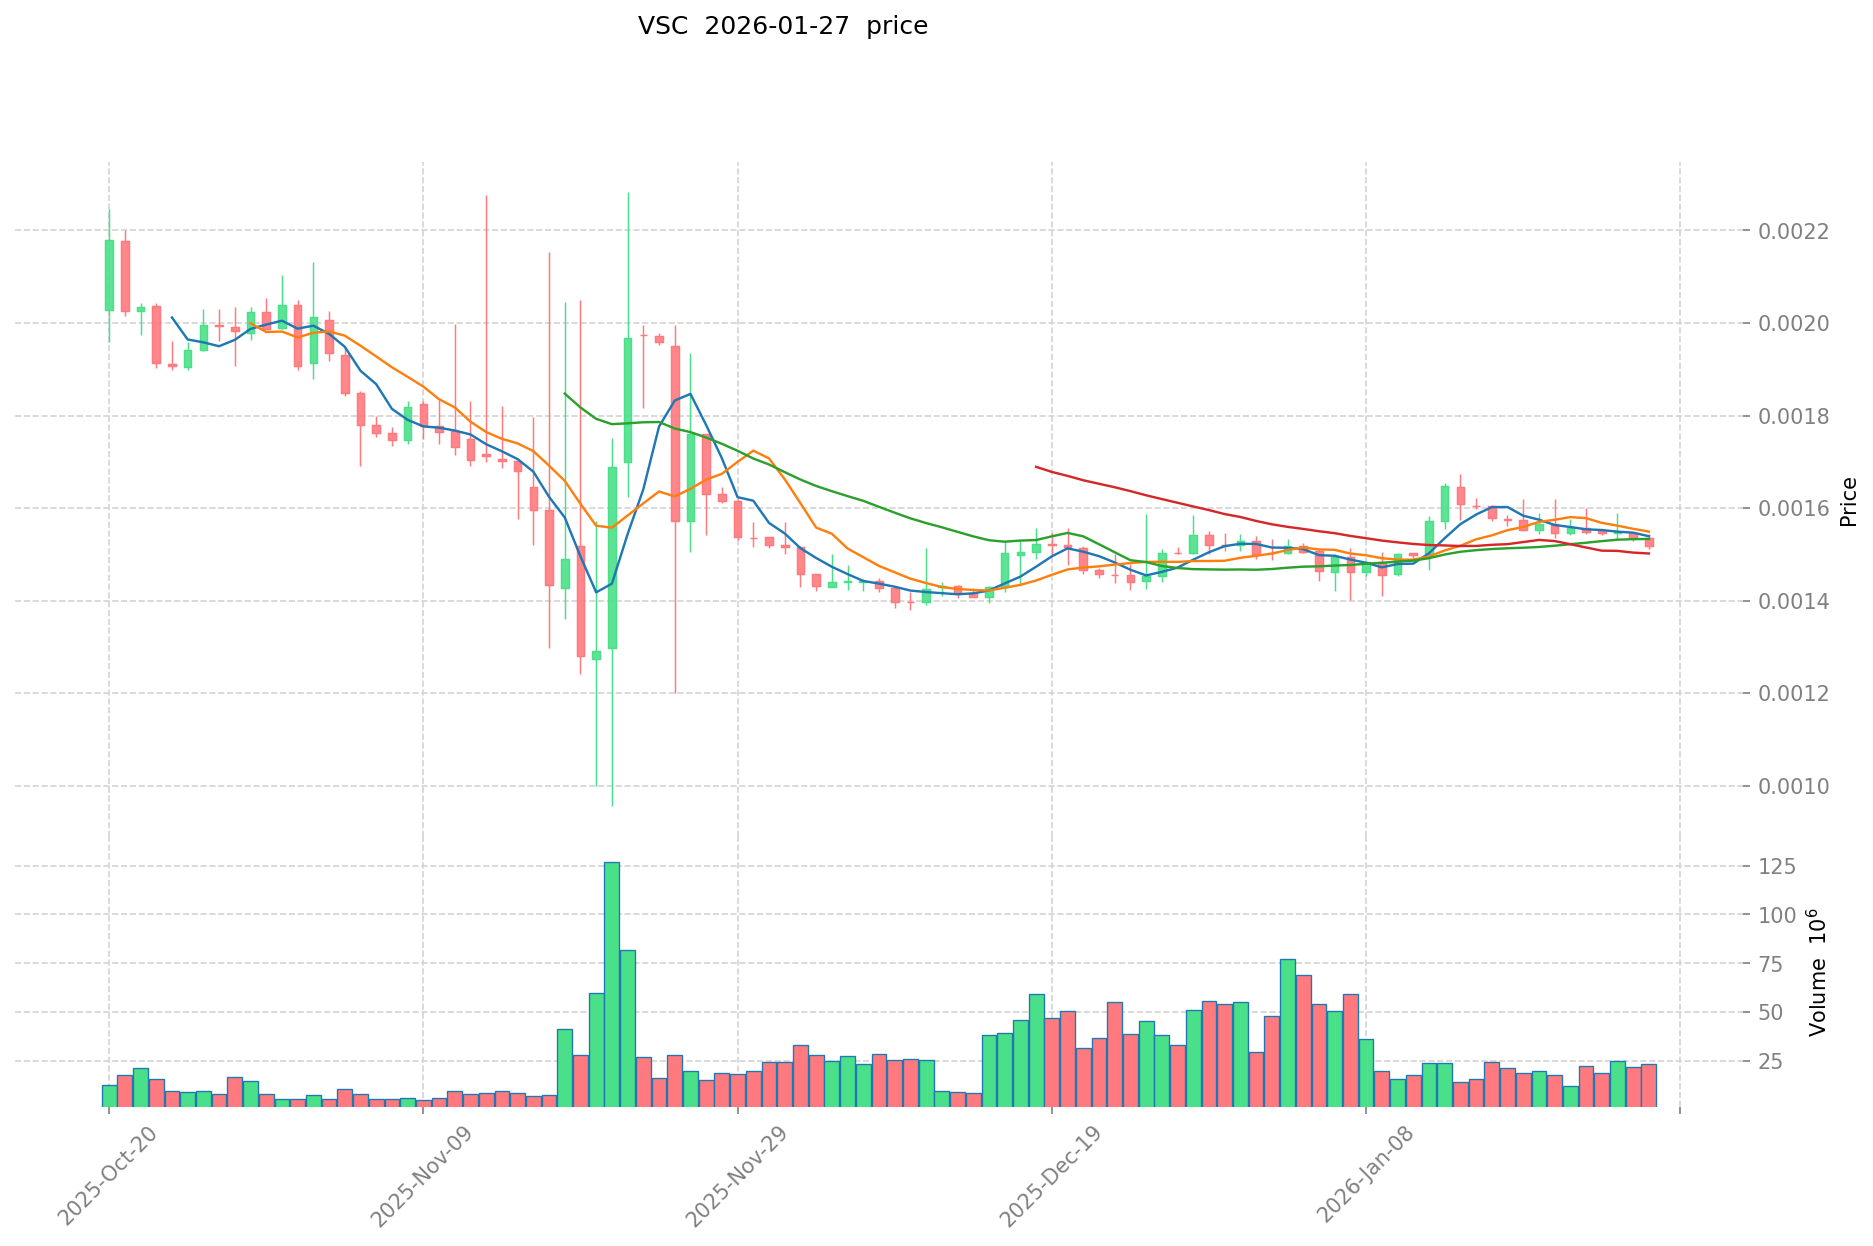
- 2025: The market entered a correction phase, with the price declining to $0.000956 on November 21, 2025
VSC Current Market Dynamics
As of January 28, 2026, VSC is trading at $0.001505, showing relatively stable performance in recent trading sessions. Over the past hour, the token demonstrated modest upward movement with a 0.06% increase. However, examining broader timeframes reveals varied performance patterns across different periods.
In the 24-hour trading window, VSC experienced a decline of 0.92%, with the price fluctuating between a low of $0.001501 and a high of $0.0015349. The weekly performance indicates a 2.59% decrease, while the monthly chart shows a similar trend with a 2.46% decline. The annual perspective presents a more substantial correction, with the price down 82.23% compared to the previous year.
The current market capitalization stands at approximately $6.90 million, with a 24-hour trading volume of $43,336.92. The circulating supply represents 4.58 billion VSC tokens, accounting for 22.90% of the maximum supply of 20.01 billion tokens. The fully diluted market cap is calculated at approximately $30.12 million. VSC maintains a market dominance of 0.00096% within the broader cryptocurrency ecosystem.
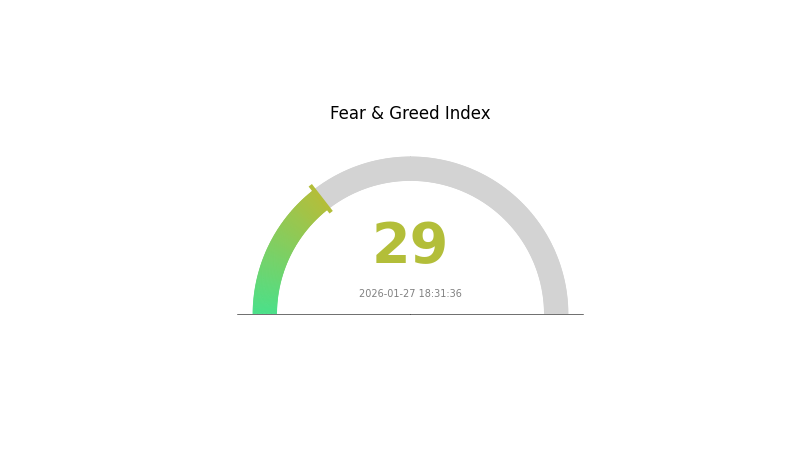
The token is currently available for trading on 3 exchanges, with Gate.com being one of the primary platforms. According to the Crypto Fear and Greed Index, the overall market sentiment registers at 29, indicating a "Fear" level, which may influence trading behavior and price action across the sector.
Click to view current VSC market price
VSC Market Sentiment Indicator
2026-01-27 Fear and Greed Index: 29 (Fear)
Click to view the current Fear & Greed Index
The cryptocurrency market is currently experiencing a notable fear sentiment, with the index at 29 points. This reading indicates heightened investor anxiety and risk aversion in the market. During periods of fear, trading volumes typically decrease as market participants adopt more cautious positions. This environment often presents opportunities for long-term investors to accumulate positions at lower valuations. Monitor key support levels closely and consider dollar-cost averaging strategies to navigate the current market conditions effectively on Gate.com.
VSC Holding Distribution
According to the current VSC on-chain address holding distribution data, the concentration characteristics of token distribution show significant structural features. From the perspective of address stratification, the top addresses hold a considerable proportion of the total supply, which is a common phenomenon in the early stages of blockchain project development. This concentration pattern typically reflects the token allocation among the project team, early investors, and strategic partners, while also indicating that the token has not yet achieved full market circulation and widespread decentralization.
In terms of market structure impact, the current holding concentration level deserves attention from investors. When a small number of addresses control a large proportion of tokens, it may lead to increased market price volatility, as large holders' trading behavior can significantly affect supply and demand dynamics. Additionally, this concentration structure may create potential centralization risks. If major holders choose to sell collectively, it could trigger severe price fluctuations. However, it should be noted that a certain degree of holding concentration is not necessarily negative, as it may also indicate long-term confidence from core participants in the project.
From the perspective of on-chain structural stability, VSC's current address distribution pattern reflects the development stage characteristics of emerging crypto assets. As the project ecosystem continues to expand and more users participate, the token holding structure is expected to gradually become more decentralized. Investors should continue to monitor changes in address distribution data, particularly the flow trends of large holders and changes in the number of small and medium-sized holders, as these indicators can provide important reference signals for evaluating project health and market maturity.
Click to view current VSC Holding Distribution

| Top |
Address |
Holding Qty |
Holding (%) |
II. Core Factors Influencing VSC's Future Price
Market Sentiment and Investor Confidence
- Investor sentiment dynamics: Market sentiment and investor confidence have a direct impact on VSC price movements. Positive news about widespread VSC adoption or significant technological breakthroughs can create upward momentum in the market.
- News announcements and community sentiment: News announcements and community sentiment serve as important drivers of VSC price action. Chart patterns typically represent market sentiment, making community engagement a key factor in short-term price fluctuations.
- Trading behavior patterns: Long-term holders tend to focus on fundamental analysis, while short-term traders rely more on technical indicators and market sentiment shifts to guide their trading decisions.
Investment Trends in Digital Finance
- Cryptocurrency market trends: VSC price, like other cryptocurrencies, is influenced by various factors within the digital financial world. Broader cryptocurrency investment trends play a crucial role in determining VSC's price trajectory.
- Market adoption signals: The level of VSC adoption in the market serves as a significant indicator of future price potential. Increased adoption typically correlates with positive price momentum.
- Digital asset market dynamics: The overall performance of the digital asset market creates ripple effects that influence VSC's price behavior and trading patterns.
III. 2026-2031 VSC Price Prediction
2026 Outlook
- Conservative Prediction: $0.00138 - $0.00151
- Neutral Prediction: Around $0.00151
- Optimistic Prediction: Up to $0.00205 (requires favorable market conditions and increased adoption)
2027-2029 Outlook
- Market Stage Expectation: VSC may enter a gradual growth phase with increasing market recognition and ecosystem development
- Price Range Prediction:
- 2027: $0.00135 - $0.00226 (projected growth of approximately 18%)
- 2028: $0.00117 - $0.00214 (projected growth of approximately 33%)
- 2029: $0.00127 - $0.00214 (projected growth of approximately 37%)
- Key Catalysts: Enhanced platform functionality, expanding user base, and broader cryptocurrency market trends
2030-2031 Long-term Outlook
- Baseline Scenario: $0.00152 - $0.00211 (assuming steady project development and stable market conditions)
- Optimistic Scenario: $0.00236 - $0.00261 (assuming accelerated adoption and favorable regulatory environment)
- Transformative Scenario: Potential to reach $0.00261 by 2030 (requires breakthrough partnerships, significant technological advancements, and exceptional market momentum)
- 2031-12-31: VSC projected average price around $0.00236 (representing approximately 56% cumulative growth from 2026 baseline)
| Year |
Predicted High Price |
Predicted Average Price |
Predicted Low Price |
Price Change |
| 2026 |
0.00205 |
0.00151 |
0.00138 |
0 |
| 2027 |
0.00226 |
0.00178 |
0.00135 |
18 |
| 2028 |
0.00214 |
0.00202 |
0.00117 |
33 |
| 2029 |
0.00214 |
0.00208 |
0.00127 |
37 |
| 2030 |
0.00261 |
0.00211 |
0.00152 |
40 |
| 2031 |
0.0025 |
0.00236 |
0.00151 |
56 |
IV. VSC Professional Investment Strategy and Risk Management
VSC Investment Methodology
(I) Long-term Holding Strategy
- Suitable for: Health data-focused blockchain enthusiasts and investors interested in IoT-blockchain integration
- Operational Recommendations:
- Consider accumulating positions during periods of price consolidation, given VSC's relatively low circulation ratio of approximately 22.9%
- Monitor the project's development in the Decentralized Data Health (DDH) platform and partnerships with medical research institutions
- Storage solution: Use Gate Web3 Wallet for secure storage with multi-signature protection and regular backup of recovery phrases
(II) Active Trading Strategy
- Technical Analysis Tools:
- Support and Resistance Levels: Current support observed around $0.001501 (24h low) and resistance near $0.001535 (24h high)
- Volume Analysis: Monitor the 24h trading volume of approximately $43,337 to identify potential breakout or breakdown scenarios
- Swing Trading Key Points:
- Set stop-loss orders at 3-5% below entry points to manage downside risk
- Consider profit-taking strategies during short-term rallies, given the token's -82.23% annual performance
VSC Risk Management Framework
(I) Asset Allocation Principles
- Conservative Investors: 1-2% of crypto portfolio
- Aggressive Investors: 3-5% of crypto portfolio
- Professional Investors: Up to 10% with active monitoring and hedging strategies
(II) Risk Hedging Solutions
- Diversification Approach: Balance VSC holdings with established cryptocurrencies and stablecoin positions
- Dollar-Cost Averaging: Implement systematic purchasing plans to mitigate timing risk and volatility exposure
(III) Secure Storage Solutions
- Hot Wallet Recommendation: Gate Web3 Wallet for active trading and convenient access
- Cold Storage Solution: Transfer larger holdings to hardware wallets for enhanced security against cyber threats
- Security Precautions: Never share private keys, enable two-factor authentication, and verify all transaction addresses before confirming transfers
V. VSC Potential Risks and Challenges
VSC Market Risks
- High Volatility: VSC has declined 82.23% over the past year, reflecting significant market volatility and price uncertainty
- Limited Liquidity: With a market cap of approximately $6.9 million and trading on only 3 exchanges, liquidity constraints may impact large transactions
- Low Market Share: VSC holds approximately 0.00096% market dominance, indicating limited market recognition and adoption
VSC Regulatory Risks
- Health Data Privacy Regulations: As a health data-focused blockchain, VSC may face evolving regulatory requirements regarding data protection and privacy compliance
- Blockchain Regulatory Uncertainty: Changes in cryptocurrency regulations across different jurisdictions could impact VSC's operations and token utility
- IoT Device Compliance: Integration with wearable devices may require adherence to medical device regulations and data security standards
VSC Technical Risks
- Platform Development Risk: The success of the Decentralized Data Health (DDH) platform depends on continued technical development and user adoption
- Network Security: As a mainnet project, VSC must maintain robust security measures to protect against potential exploits and attacks
- Adoption Challenges: The project's viability depends on attracting both users with wearable devices and research institutions to the platform
VI. Conclusion and Action Recommendations
VSC Investment Value Assessment
Vyvo Smart Chain presents a specialized value proposition at the intersection of blockchain technology, IoT devices, and health data management. The project aims to address data ownership and privacy concerns while enabling users to monetize health data from wearable devices. However, the token has experienced substantial price decline over the past year, and its relatively small market capitalization and limited exchange availability present liquidity considerations. The long-term value depends on successful implementation of the DDH platform and broader adoption by both users and medical research institutions. Short-term risks include continued price volatility and market uncertainty.
VSC Investment Recommendations
✅ Beginners: Start with small allocations (less than 1% of portfolio) and focus on understanding the project fundamentals before increasing exposure. Use dollar-cost averaging to mitigate timing risk.
✅ Experienced Investors: Consider VSC as a speculative position within a diversified portfolio, with allocation based on risk tolerance and belief in the health data blockchain sector. Implement strict risk management protocols.
✅ Institutional Investors: Conduct thorough due diligence on the technical infrastructure, team credentials, and competitive landscape before considering significant positions. Evaluate regulatory implications carefully.
VSC Trading Participation Methods
- Spot Trading: Purchase VSC directly on Gate.com with various trading pairs for immediate ownership
- Gradual Accumulation: Implement systematic buying strategies during price consolidation phases
- Active Monitoring: Track project developments, partnership announcements, and technical updates through official channels
Cryptocurrency investment carries extremely high risk, and this article does not constitute investment advice. Investors should make prudent decisions based on their own risk tolerance and are advised to consult professional financial advisors. Never invest more than you can afford to lose.
FAQ
What are the main factors affecting VSC price predictions?
VSC price is influenced by supply-demand dynamics, market sentiment driven by news and social media, regulatory developments like ETF approvals, institutional adoption rates, and macroeconomic trends including inflation and interest rates. These factors collectively determine VSC's price trajectory and market outlook.
How to analyze and predict VSC price trends?
Analyze VSC price trends using technical indicators, historical data, and trading volume patterns. Monitor market sentiment and project developments. Price predictions depend on demand fluctuations, ecosystem growth, and overall crypto market conditions. Use AI-driven analysis tools for real-time insights.
What are the risks and limitations of VSC price predictions?
VSC price predictions face market volatility and incomplete data risks. Models cannot predict sudden events accurately. Historical performance does not guarantee future results. Prediction accuracy depends on data quality and market conditions.
What are professional institutions' predictions for VSC price?
Professional institutions predict VSC's average price in 2026 at ¥0.01078, with potential fluctuations between ¥0.008951 and ¥0.01315. By 2031, prices are expected to experience further changes based on market dynamics.
VSC price is directly influenced by market liquidity, trading volume, and overall market sentiment. Higher trading activity and positive market conditions typically drive price increases, while market downturns can cause significant volatility. VSC demonstrates strong correlation with broader crypto market trends.
* The information is not intended to be and does not constitute financial advice or any other recommendation of any sort offered or endorsed by Gate.