WET (HumidiFi), Solana's leading DEX by trading volume with $1B+ daily activity and 35% market share, presents a comprehensive investment analysis framework through January 2026. Trading at $0.11412 with a $26.25M market cap, WET exhibits extreme volatility—declining 53.32% monthly while maintaining strong platform fundamentals. This analysis examines WET's market position, historical price trajectory from December 2025 lows of $0.105 to highs of $0.34, and provides multi-scenario price ranges through 2031 spanning $0.07951 to $0.35406. The article delivers professional investment strategies tailored to beginner, experienced, and institutional investors, incorporating position sizing, risk management protocols, and secure custody solutions via Gate. Critical considerations include WET's concentrated holder distribution (77% held by top 3 addresses), 23% circulating supply ratio, and DeFi regulatory uncertainties, while emphasizing that cryptocurrency investment carries substantial risks requiring independent
Introduction: WET's Market Position and Investment Value
HumidiFi (WET), positioned as Solana's leading decentralized exchange by trading volume, has emerged as a significant player in the DeFi ecosystem since its launch in 2024. The platform processes over $1 billion in daily trading volume, accounting for approximately 35% of all spot DEX activity on-chain. As of January 22, 2026, WET maintains a market capitalization of $26.25 million with a circulating supply of 230 million tokens, trading at approximately $0.11. This asset, recognized as an innovative "proprietary AMM" solution, is playing an increasingly vital role in decentralized finance by combining on-chain execution with institutional-grade market-making capabilities.
This article will comprehensively analyze WET's price trajectory from 2026 to 2031, incorporating historical patterns, market supply-demand dynamics, ecosystem developments, and macroeconomic factors to provide investors with professional price forecasts and practical investment strategies.
I. WET Price History Review and Market Status
WET Historical Price Evolution Trajectory
- December 2025: WET reached a notable price level of $0.34 on December 10, marking a significant milestone in its early trading period
- January 2026: Price experienced a substantial correction, declining to $0.105 on January 21, reflecting broader market volatility
WET Current Market Situation
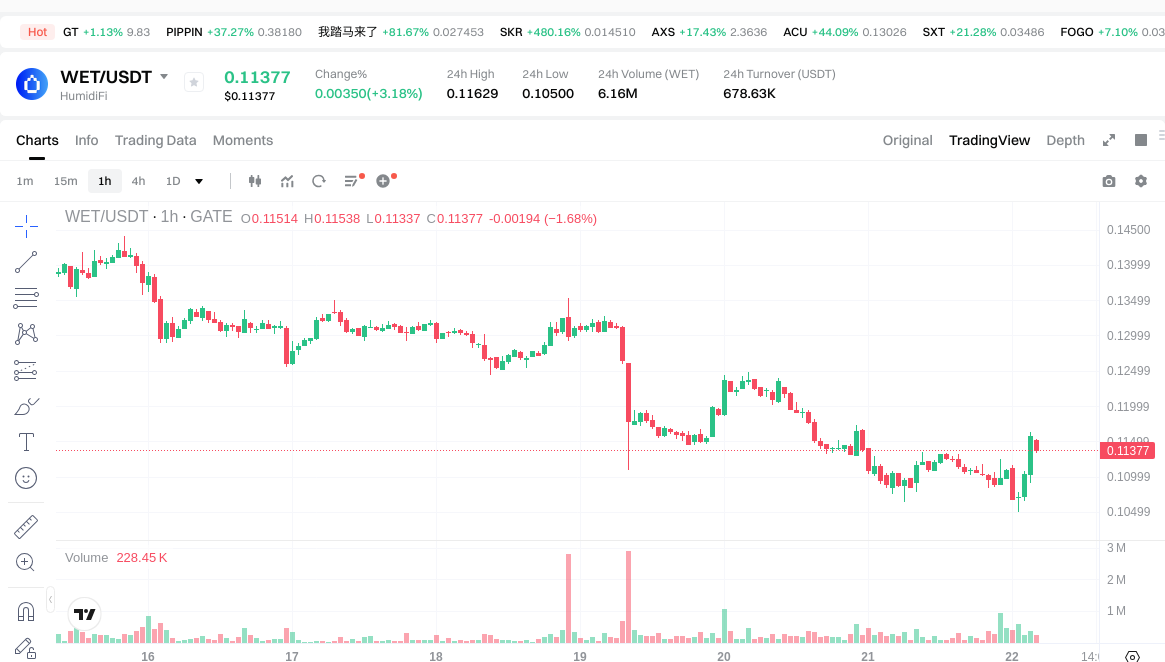
As of January 22, 2026, WET is trading at $0.11412, showing a 24-hour increase of 4.57% and a 1-hour gain of 3.15%. The token's 24-hour trading range spans from $0.105 to $0.11629, with total trading volume reaching $676,692.
The current market capitalization stands at $26.25 million, with 230 million WET tokens in circulation out of a maximum supply of 1 billion tokens, representing a 23% circulation ratio. The fully diluted market cap is calculated at $114.12 million. WET ranks #761 in the overall cryptocurrency market and maintains a market dominance of 0.0035%.
Recent performance shows mixed signals: while short-term indicators demonstrate positive momentum with gains over 1-hour and 24-hour periods, medium-term metrics reveal a 7-day decline of 18.63% and a 30-day decrease of 53.32%. The year-to-date performance shows a modest increase of 2.55%.
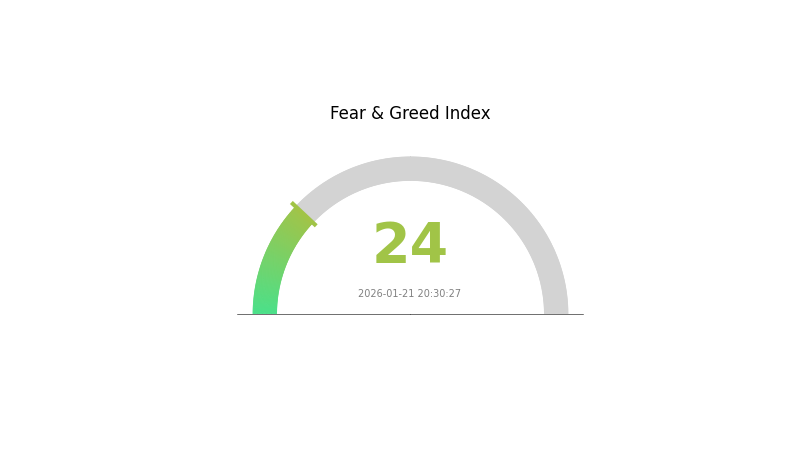
The token is currently trading approximately 66.4% below its previous high of $0.34 recorded in December 2025, and 8.7% above its recent low of $0.105. Market sentiment indicators reflect an "Extreme Fear" reading of 24 on the VIX scale, suggesting heightened caution among market participants.
Click to view current WET market price
WET Market Sentiment Indicator
2026-01-21 Fear and Greed Index: 24 (Extreme Fear)
Click to view current Fear & Greed Index
The crypto market is currently experiencing extreme fear, with the index plummeting to 24. This represents a significant shift in market psychology, indicating widespread investor anxiety and pessimism. When the index reaches such low levels, it typically suggests capitulation selling and heightened market volatility. Experienced traders often view extreme fear as a potential contrarian signal, where oversold conditions may create buying opportunities for long-term investors. However, caution remains warranted as downward momentum could continue. Monitor key support levels closely and consider dollar-cost averaging strategies during this period of heightened uncertainty.
WET Holding Distribution
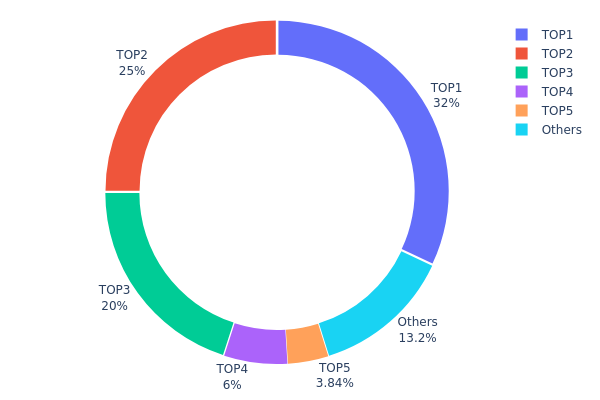
The holding distribution chart illustrates the concentration of token ownership across different wallet addresses, providing insights into the decentralization level and potential market control by major holders. This metric serves as a crucial indicator of on-chain structural stability and the degree of power distribution within the token ecosystem.
Based on the current data, WET exhibits a notably high concentration pattern. The top three addresses collectively control 77.00% of the total supply, with the largest single holder possessing 32.00% (320,000K tokens), followed by 25.00% and 20.00% respectively. The fourth and fifth positions hold 6.00% and 3.83%, while all remaining addresses combined account for only 13.17% of the circulating supply.
This level of concentration presents significant structural risks to market stability. Such a distribution pattern indicates limited decentralization and creates conditions where major holders could exert substantial influence over price movements through coordinated or individual actions. The dominance of the top three addresses suggests a potentially fragile liquidity structure, where large-scale sell-offs could trigger dramatic price volatility. Furthermore, this concentration may discourage broader community participation and institutional interest, as it raises concerns about fair market dynamics and potential manipulation risks inherent in such an asymmetric ownership structure.
Click to view current WET Holding Distribution
| Top |
Address |
Holding Qty |
Holding (%) |
| 1 |
BtZ8jP...sjVH3Q |
320000.00K |
32.00% |
| 2 |
AsEVCx...yZZ4uy |
250000.00K |
25.00% |
| 3 |
7w7tTB...kXpXyz |
200000.00K |
20.00% |
| 4 |
A8t1fd...Kzxznj |
59999.99K |
6.00% |
| 5 |
7zRoQf...WASTJL |
38398.65K |
3.83% |
| - |
Others |
131601.21K |
13.17% |
II. Core Factors Influencing WET's Future Price
Based on the available information, we are unable to provide a comprehensive analysis of the core factors that may influence WET's future price at this time. The specific details regarding supply mechanisms, institutional dynamics, macroeconomic environments, and technical developments for WET are not sufficiently documented in the current materials.
Investors and stakeholders interested in WET should conduct independent research and consult multiple sources to understand the potential price drivers and risks associated with this digital asset. As with any cryptocurrency investment, market conditions can change rapidly, and thorough due diligence is essential.
III. 2026-2031 WET Price Forecast
2026 Outlook
- Conservative forecast: $0.07951 - $0.11358
- Neutral forecast: $0.11358
- Optimistic forecast: $0.15788 (requires favorable market conditions and increased adoption)
2027-2029 Outlook
- Market stage expectation: Progressive growth phase with gradual market maturation
- Price range forecast:
- 2027: $0.11537 - $0.19681
- 2028: $0.10974 - $0.21615
- 2029: $0.16061 - $0.2696
- Key catalysts: Market expansion, potential ecosystem developments, and broader cryptocurrency market trends
2030-2031 Long-term Outlook
- Baseline scenario: $0.11981 - $0.2304 (assuming steady market growth and sustained project development)
- Optimistic scenario: $0.26764 - $0.32717 (contingent on significant technological advancements and increased market adoption)
- Transformational scenario: $0.35406 (under exceptionally favorable market conditions with widespread adoption)
- 2026-01-22: WET shows potential for gradual appreciation over the forecast period
| Year |
Predicted High Price |
Predicted Average Price |
Predicted Low Price |
Price Change |
| 2026 |
0.15788 |
0.11358 |
0.07951 |
0 |
| 2027 |
0.19681 |
0.13573 |
0.11537 |
18 |
| 2028 |
0.21615 |
0.16627 |
0.10974 |
45 |
| 2029 |
0.2696 |
0.19121 |
0.16061 |
67 |
| 2030 |
0.32717 |
0.2304 |
0.11981 |
101 |
| 2031 |
0.35406 |
0.27879 |
0.26764 |
144 |
IV. WET Professional Investment Strategies and Risk Management
WET Investment Methodology
(1) Long-term Holding Strategy
- Suitable for: Investors seeking exposure to Solana DeFi ecosystem growth and those who believe in the long-term viability of decentralized exchanges with institutional-grade execution
- Operational Recommendations:
- Consider accumulating positions during market pullbacks, as WET has experienced a 53.32% decline over the past 30 days
- Monitor HumidiFi's daily trading volume performance (currently processing over $1B daily, representing approximately 35% of all spot DEX activity on Solana) as a key indicator of platform adoption
- Implement secure storage solutions using Gate Web3 Wallet for self-custody, ensuring private key protection and regular security audits
(2) Active Trading Strategy
- Technical Analysis Tools:
- Volume Analysis: Track the correlation between WET price movements and HumidiFi's platform trading volume, as increased DEX activity may drive token demand
- Volatility Indicators: Given the recent 18.63% decline over 7 days, consider using Bollinger Bands and ATR (Average True Range) to identify potential entry and exit points
- Swing Trading Key Points:
- Recent price range between $0.105 (24-hour low) and $0.11629 (24-hour high) provides reference points for short-term trading boundaries
- Monitor the 23% circulating supply ratio, as token unlocks or increased circulation could impact price volatility
WET Risk Management Framework
(1) Asset Allocation Principles
- Conservative Investors: 1-3% of crypto portfolio allocation, prioritizing capital preservation
- Aggressive Investors: 5-10% allocation for those with higher risk tolerance and longer time horizons
- Professional Investors: Up to 15% for those with deep understanding of DeFi protocols and active portfolio management capabilities
(2) Risk Hedging Solutions
- Portfolio Diversification: Balance WET holdings with established cryptocurrencies and stablecoins to reduce overall portfolio volatility
- Position Sizing: Given the 53.32% monthly decline, implement strict position limits and avoid over-concentration in a single DeFi token
(3) Secure Storage Solutions
- Self-Custody Wallet Recommendation: Gate Web3 Wallet supports Solana SPL tokens and provides secure key management with multi-chain compatibility
- Multi-Signature Solutions: For larger holdings, consider implementing multi-signature wallets to enhance security and reduce single-point-of-failure risks
- Security Precautions: Never share private keys or seed phrases, enable two-factor authentication, and regularly verify transaction addresses before confirming transfers
V. WET Potential Risks and Challenges
WET Market Risks
- High Volatility: WET has declined 53.32% over the past 30 days, demonstrating significant price instability that may challenge risk-averse investors
- Low Circulating Supply: With only 23% of total supply in circulation (230M out of 1B tokens), future token unlocks could create substantial selling pressure
- Liquidity Concerns: Despite daily trading volume of approximately $676,692, the relatively modest market capitalization of $26.25M may limit liquidity during market stress periods
WET Regulatory Risks
- DeFi Protocol Scrutiny: As regulatory frameworks evolve globally, decentralized exchanges and their associated tokens may face increased compliance requirements that could impact operations
- Token Classification Uncertainty: The regulatory status of DEX governance and utility tokens remains unclear in many jurisdictions, potentially affecting trading availability and investor access
- Cross-Border Compliance: Operating across multiple jurisdictions while maintaining decentralized architecture presents ongoing regulatory challenges
WET Technical Risks
- Smart Contract Vulnerabilities: As with all DeFi protocols, potential smart contract bugs or exploits could compromise platform security and token value
- Solana Network Dependency: WET's performance is tied to Solana blockchain stability; network outages or congestion could impact trading functionality and investor confidence
- Competition Risk: The DEX landscape remains highly competitive, with established platforms and new entrants potentially eroding HumidiFi's current 35% market share of Solana spot DEX activity
VI. Conclusion and Action Recommendations
WET Investment Value Assessment
WET presents a mixed investment profile. While HumidiFi demonstrates strong market position as Solana's largest DEX by volume with over $1B in daily trading activity, representing approximately 35% of chain-wide spot DEX volume, the token faces significant headwinds. The 53.32% decline over the past 30 days and the low 23% circulating supply ratio suggest potential near-term volatility. The platform's proprietary AMM technology offers differentiation through tighter spreads and institutional-grade execution, which could support long-term value if adoption continues. However, investors must weigh these positives against substantial technical, regulatory, and market risks inherent in early-stage DeFi protocols.
WET Investment Recommendations
✅ Beginners: Approach with extreme caution; limit exposure to 1-2% of total crypto portfolio and prioritize learning about DeFi mechanics before investing. Consider starting with smaller position sizes to understand price volatility patterns.
✅ Experienced Investors: May consider 3-7% allocation as part of a diversified DeFi strategy, actively monitoring HumidiFi's volume metrics and competitive positioning within the Solana ecosystem. Implement strict stop-loss orders given recent price instability.
✅ Institutional Investors: Conduct thorough due diligence on smart contract audits and tokenomics structure before position sizing. Consider the low circulating supply as a significant risk factor and establish clear risk management protocols including position limits and drawdown thresholds.
WET Trading Participation Methods
- Spot Trading on Gate.com: Access WET trading pairs with competitive fees and deep liquidity through Gate.com's comprehensive trading platform
- Self-Custody via Gate Web3 Wallet: Transfer WET tokens to Gate Web3 Wallet for secure self-custody while maintaining full control over private keys
- DCA Strategy Implementation: Consider dollar-cost averaging to mitigate timing risk, particularly given the recent 30-day decline, allowing gradual position building at various price levels
Cryptocurrency investment carries extremely high risk, and this article does not constitute investment advice. Investors should make prudent decisions based on their own risk tolerance and are advised to consult professional financial advisors. Never invest more than you can afford to lose.
FAQ
What is WET token? What are its uses and value?
WET is a utility token designed for the Web3 ecosystem, enabling governance participation, transaction fees, and access to decentralized services. Its value derives from network utility, adoption rate, and ecosystem development, with strong growth potential as Web3 infrastructure expands.
What are the main factors influencing WET price predictions?
WET price is primarily influenced by market demand and trading volume, project development progress, overall cryptocurrency market sentiment, regulatory changes, and ecosystem adoption rate. These factors collectively determine price movements and trend directions.
How to conduct WET price technical analysis and prediction?
Analyze WET price trends using key indicators like moving averages, RSI, and MACD. Monitor trading volume, market sentiment, and historical support/resistance levels. WET shows strong growth potential through resistance breakouts and bullish chart patterns. Track on-chain metrics and community activity for predictive insights.
What are the main risks of WET investment?
WET investment carries market volatility risk, liquidity risk, regulatory uncertainty, and technology risk. Price fluctuations can be significant due to market sentiment changes. Limited trading volume may affect position entry and exit. Regulatory changes in crypto markets could impact value. Smart contract vulnerabilities pose potential security risks.
What advantages does WET have compared to other mainstream tokens?
WET offers superior scalability, lower transaction costs, and faster settlement speeds. With innovative tokenomics and strong community governance, WET provides better utility and long-term value potential than traditional mainstream tokens.
WET未来的发展前景和价格趋势如何?
WET token展现强劲增长潜力。随着生态扩展和用户增长,交易额持续上升,项目基本面不断完善。预计未来12个月价格将稳步上升,长期看好其在web3领域的应用前景和价值释放。
* The information is not intended to be and does not constitute financial advice or any other recommendation of any sort offered or endorsed by Gate.