This comprehensive analysis examines WNXM's market position and investment potential through 2031, providing expert price forecasts for Nexus Mutual's wrapped token. Currently trading at $72.96 with a market cap of $33.94 million, WNXM serves as a critical bridge in DeFi insurance risk management. The article combines historical price evolution, present market sentiment analysis, and technical indicators to forecast price ranges across multiple scenarios, from conservative to optimistic outlooks. Professional investment strategies—including long-term holding and active trading approaches—are detailed alongside comprehensive risk management frameworks covering asset allocation, portfolio diversification, and secure storage solutions on Gate. Key catalysts for growth include expanding DeFi insurance adoption, protocol upgrades, and institutional recognition, while investors must carefully monitor regulatory developments, liquidity constraints, and smart contract vulnerabilities before making trading decisions.
Introduction: WNXM's Market Position and Investment Value
WNXM (WNXM), as a wrapped token representing Nexus Mutual's decentralized insurance platform, has been facilitating risk-sharing mechanisms on the Ethereum blockchain since its launch in 2020. As of 2026, WNXM maintains a market capitalization of approximately $33.94 million, with a circulating supply of around 465,162 tokens, and the price hovering at $72.96. This asset, serving as a bridge between traditional insurance concepts and decentralized finance, is playing an increasingly important role in the DeFi risk management sector.
This article will comprehensively analyze WNXM's price trajectory from 2026 to 2031, combining historical patterns, market supply-demand dynamics, ecosystem development, and macroeconomic factors to provide investors with professional price forecasts and practical investment strategies.
I. WNXM Price History Review and Market Status
WNXM Historical Price Evolution Trajectory
- 2020: WNXM was published in July with an initial price of $10.8445, establishing its market presence as a wrapped version of NXM
- 2021: In May, WNXM reached an all-time high of $130.82, reflecting strong market sentiment during the DeFi boom period
- 2022: During the market downturn at the end of December, WNXM dropped to its historical low of $7.78
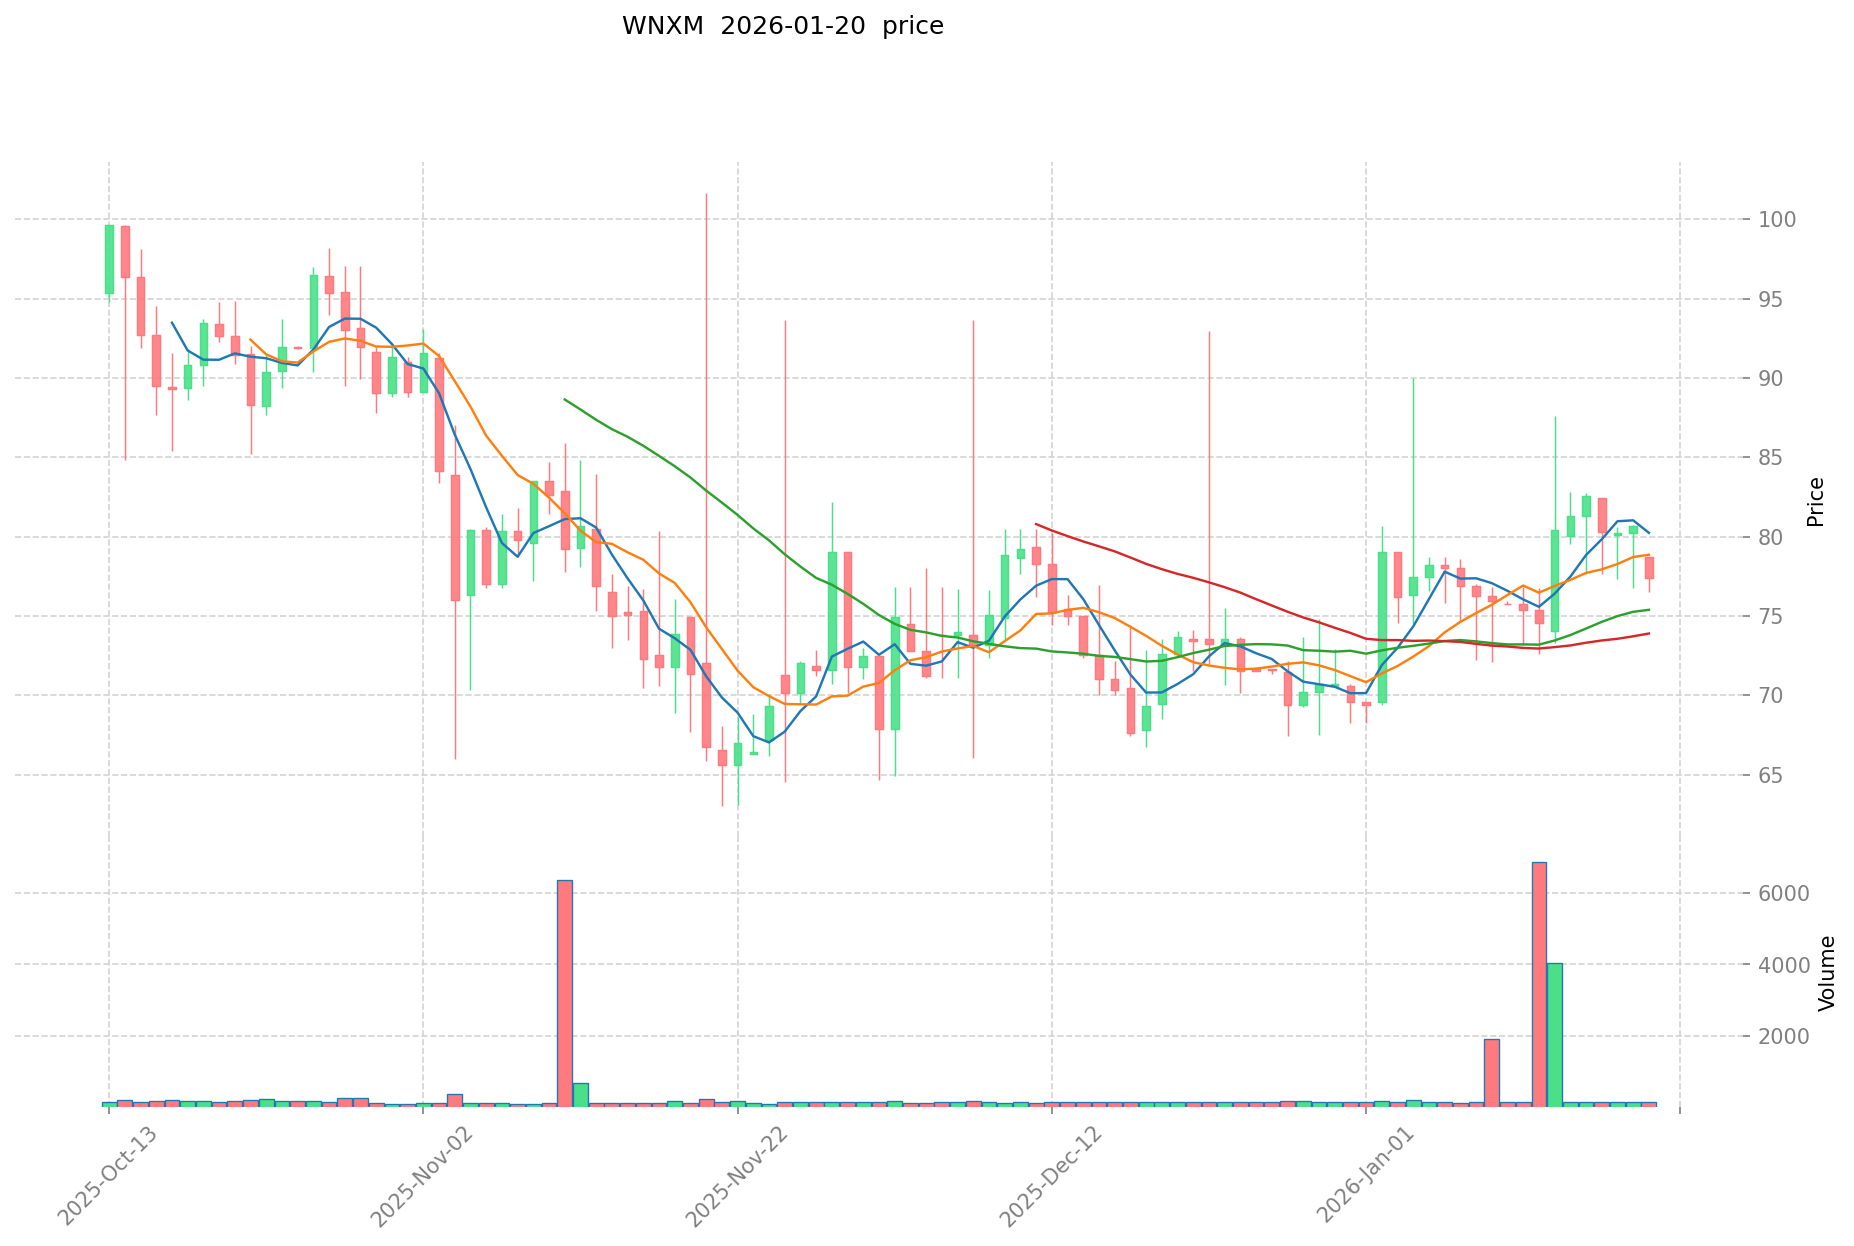
WNXM Current Market Situation
WNXM is currently trading at $72.96, with a 24-hour trading volume of $12,456.10. The token has experienced a price decline of 6.91% over the past 24 hours, with the daily price range between $71.76 and $78.37. Over the past hour, WNXM showed a 1.58% decrease, while the 7-day performance indicates a 5.14% decline.
The market capitalization stands at approximately $33.94 million, with a circulating supply of 465,162.08 WNXM tokens out of a maximum supply of 985,555 tokens, representing a circulation ratio of 47.2%. The fully diluted market cap is valued at $71.91 million, and WNXM holds a market dominance of 0.0022%.
Over the past 30 days, WNXM has shown relatively stable performance with a modest decline of 1.02%. However, the 1-year performance reflects a positive trend with a 7.23% increase, demonstrating recovery from previous market lows.
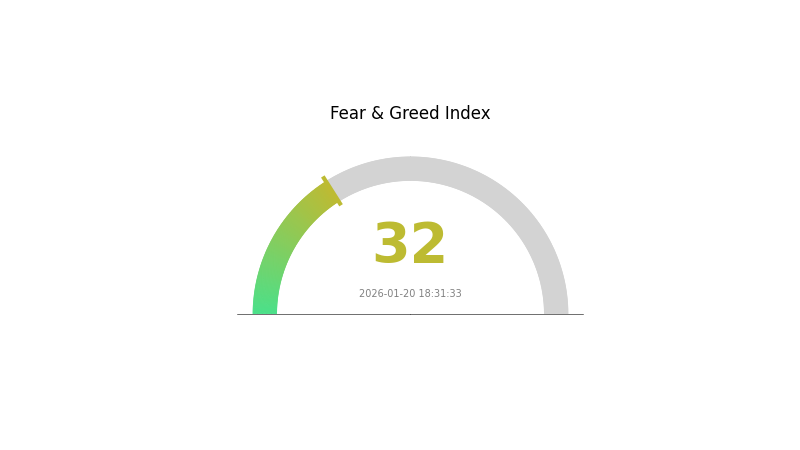
WNXM is currently listed on 2 exchanges and has a holder count of 4,956 addresses. The current market sentiment index indicates a fear level of 32.
Click to view current WNXM market price
WNXM Market Sentiment Index
2026-01-20 Fear and Greed Index: 32 (Fear)
Click to view the current Fear & Greed Index
The cryptocurrency market is currently experiencing a fear sentiment with an index reading of 32. This indicates heightened market anxiety and increased risk aversion among investors. During such periods, market volatility typically increases as traders become more cautious with their positions. This fear-driven environment often presents opportunities for long-term investors to accumulate assets at lower valuations. Monitor market developments closely and consider your risk tolerance when making investment decisions. Understanding market sentiment through the Fear and Greed Index can help inform your trading strategy during volatile market conditions.
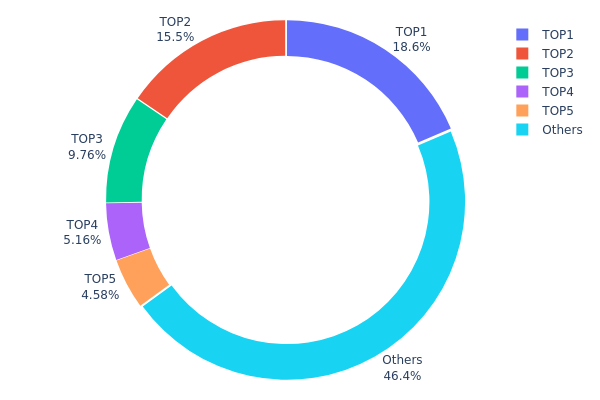
WNXM Holding Distribution
The holding distribution chart reflects the concentration of token ownership across different wallet addresses, serving as a key indicator of decentralization and market structure stability. By analyzing the proportion of tokens held by top addresses, we can assess potential risks related to market manipulation and price volatility.
According to current data, WNXM exhibits a moderate concentration pattern. The top address holds 86.40K tokens (18.57%), while the top 5 addresses collectively control approximately 53.57% of the circulating supply. This indicates that more than half of WNXM tokens are concentrated among a relatively small number of major holders. The "Others" category accounts for 46.43%, suggesting a substantial portion of tokens remains distributed among smaller holders and retail investors.
From a market structure perspective, this concentration level presents both opportunities and risks. On one hand, major holders typically include institutional investors, project treasury reserves, and long-term strategic partners, which can provide price stability and reduce extreme volatility. On the other hand, excessive concentration may create single-point risks, where large-scale selling by top holders could trigger significant price fluctuations. The current distribution pattern suggests that WNXM maintains reasonable decentralization while still bearing concentration risks that warrant close monitoring of on-chain transaction activities among major addresses.
Click to view current WNXM Holding Distribution
| Top |
Address |
Holding Qty |
Holding (%) |
| 1 |
0x741a...4131f3 |
86.40K |
18.57% |
| 2 |
0x963d...e4e12e |
72.12K |
15.50% |
| 3 |
0x95ab...6d904a |
45.41K |
9.76% |
| 4 |
0x28a5...38a6b0 |
24.02K |
5.16% |
| 5 |
0x586b...5e86e9 |
21.32K |
4.58% |
| - |
Others |
215.94K |
46.43% |
II. Core Factors Influencing WNXM's Future Price
Based on the available materials, there is insufficient structured data to comprehensively analyze the core factors affecting WNXM's price trajectory. The following sections would typically cover supply mechanisms, institutional dynamics, macroeconomic environment, and technical developments, but cannot be populated without relevant source information.
For a thorough analysis of WNXM price determinants, additional data regarding token economics, institutional adoption patterns, technical roadmap updates, and ecosystem developments would be necessary.
III. 2026-2031 WNXM Price Forecast
2026 Outlook
- Conservative Forecast: $39.40 - $72.96
- Neutral Forecast: $72.96
- Optimistic Forecast: $103.60 (requires favorable market conditions and increased protocol adoption)
2027-2029 Mid-term Outlook
- Market Phase Expectation: The token may experience gradual appreciation as the DeFi insurance sector matures and protocol coverage expands
- Price Range Forecast:
- 2027: $48.55 - $113.00 (approximately 21% increase from 2026 baseline)
- 2028: $57.37 - $110.71 (approximately 37% increase from 2026 baseline)
- 2029: $73.97 - $146.89 (approximately 44% increase from 2026 baseline)
- Key Catalysts: Expanding decentralized insurance demand, protocol upgrades, and broader institutional recognition of crypto risk management solutions
2030-2031 Long-term Outlook
- Baseline Scenario: $84.61 - $126.28 (assumes steady protocol growth and sustained DeFi ecosystem expansion)
- Optimistic Scenario: $126.28 - $157.85 (assumes accelerated adoption and enhanced protocol utility)
- Transformative Scenario: $157.85 - $186.10 (requires breakthrough in decentralized insurance adoption and significant protocol developments)
- 2026-01-21: WNXM baseline average forecast stands at $72.96 (reflecting current market positioning)
| Year |
Predicted High Price |
Predicted Average Price |
Predicted Low Price |
Price Change |
| 2026 |
103.6 |
72.96 |
39.3984 |
0 |
| 2027 |
113 |
88.2816 |
48.55488 |
21 |
| 2028 |
110.71 |
100.64 |
57.36538 |
37 |
| 2029 |
146.89 |
105.67 |
73.97115 |
44 |
| 2030 |
157.85 |
126.28 |
84.60715 |
73 |
| 2031 |
186.1 |
142.06 |
90.92111 |
94 |
IV. WNXM Professional Investment Strategies and Risk Management
WNXM Investment Methodology
(1) Long-term Holding Strategy
- Suitable for: Investors who believe in the DeFi insurance sector's long-term growth potential and are willing to hold through market volatility
- Operational Recommendations:
- Consider dollar-cost averaging to build positions gradually, spreading purchases over time to reduce timing risk
- Monitor Nexus Mutual's protocol development and insurance pool performance metrics quarterly
- Store WNXM tokens securely using Gate Web3 Wallet or hardware wallet solutions with proper backup procedures
(2) Active Trading Strategy
- Technical Analysis Tools:
- Moving Averages: Use 50-day and 200-day moving averages to identify potential trend changes and support/resistance levels
- Volume Analysis: Monitor trading volume patterns on Gate.com to gauge market interest and potential price movements
- Swing Trading Key Points:
- Watch for correlation between WNXM price movements and broader DeFi insurance sector trends
- Set clear profit targets and stop-loss levels before entering positions to maintain trading discipline
WNXM Risk Management Framework
(1) Asset Allocation Principles
- Conservative Investors: 1-3% of crypto portfolio allocation
- Aggressive Investors: 5-8% of crypto portfolio allocation
- Professional Investors: Up to 10-15% with active monitoring and hedging strategies
(2) Risk Hedging Solutions
- Portfolio Diversification: Balance WNXM holdings with exposure to major cryptocurrencies and other DeFi sectors to reduce sector-specific risk
- Position Sizing: Never allocate more than a predefined percentage of total portfolio to any single asset
(3) Secure Storage Solutions
- Hot Wallet Recommendation: Gate Web3 Wallet for convenient access and trading flexibility
- Cold Storage Solution: Hardware wallets for long-term holdings, keeping private keys offline
- Security Precautions: Enable two-factor authentication, verify contract addresses before transactions, and never share private keys or seed phrases
V. WNXM Potential Risks and Challenges
WNXM Market Risks
- High Volatility: WNXM has experienced significant price fluctuations, with 24-hour changes reaching -6.91% and a historical range from $7.78 to $130.82
- Limited Liquidity: With a 24-hour trading volume of approximately $12,456 and trading available on only 2 exchanges, liquidity constraints may impact execution prices
- Market Cap Ranking: Currently ranked #658 with 0.0022% market dominance, indicating relatively smaller market presence compared to major cryptocurrencies
WNXM Regulatory Risks
- DeFi Insurance Regulation: Evolving regulatory frameworks for decentralized insurance protocols may impact operational models and token utility
- Token Classification Uncertainty: Regulatory authorities in different jurisdictions may classify WNXM differently, potentially affecting trading and taxation
- Smart Contract Compliance: Regulatory scrutiny of DeFi protocols may require protocol adjustments that could affect token mechanics
WNXM Technical Risks
- Smart Contract Vulnerabilities: As an Ethereum-based token, WNXM depends on smart contract security and potential bugs could affect token functionality
- Ethereum Network Dependency: Technical issues, congestion, or changes to the Ethereum network may impact WNXM transactions and associated costs
- Wrapping Mechanism Risk: As WNXM is a 1:1 wrapped version of NXM, any issues with the wrapping/unwrapping mechanism could affect token value
VI. Conclusion and Action Recommendations
WNXM Investment Value Assessment
WNXM represents exposure to the emerging DeFi insurance sector through its connection to Nexus Mutual's risk-sharing model. The token's long-term value proposition depends on the growth of decentralized insurance adoption and the protocol's ability to maintain its risk pool effectively. Short-term risks include high price volatility, with the token currently trading approximately 44% below its historical high of $130.82, limited liquidity across exchanges, and broader market sentiment affecting DeFi tokens. The circulating supply represents 47.2% of maximum supply, which may influence future price dynamics.
WNXM Investment Recommendations
✅ Beginners: Start with minimal allocation (under 2% of crypto portfolio) to understand DeFi insurance mechanics. Use Gate.com's trading interface to execute small test transactions before committing larger amounts.
✅ Experienced Investors: Consider WNXM as a specialized DeFi insurance sector play, allocating 3-5% of crypto portfolio. Monitor Nexus Mutual governance decisions and insurance pool performance metrics regularly.
✅ Institutional Investors: Evaluate WNXM within a broader DeFi sector allocation strategy, considering liquidity constraints for larger positions. Conduct thorough due diligence on Nexus Mutual's protocol economics and risk management framework.
WNXM Trading Participation Methods
- Spot Trading: Execute buy and sell orders on Gate.com, which offers WNXM trading pairs with transparent pricing and order book depth
- Gradual Accumulation: Implement dollar-cost averaging strategies by making regular smaller purchases to reduce timing risk in volatile markets
- Secure Storage: Transfer tokens to Gate Web3 Wallet for self-custody, maintaining control of private keys while retaining flexibility for future trading
Cryptocurrency investment carries extremely high risks, and this article does not constitute investment advice. Investors should make prudent decisions based on their own risk tolerance and are advised to consult professional financial advisors. Never invest more than you can afford to lose.
FAQ
What is WNXM? What is the difference between WNXM and NXM?
WNXM is the wrapped version of NXM token on Ethereum. NXM is the native governance token of Nexus Mutual protocol. WNXM enables NXM holders to trade on DEXs and use in DeFi protocols while maintaining value parity with NXM.
What are the main factors affecting WNXM price?
WNXM price is primarily influenced by market demand and supply dynamics, NXM token performance, Nexus Mutual protocol adoption, trading volume, market sentiment, and broader cryptocurrency market trends.
How to predict the future price of WNXM?
Analyze WNXM's trading volume, market trends, and network adoption metrics. Monitor NXM token fundamentals, insurance protocol developments, and broader crypto market sentiment. Combine technical analysis with on-chain data to forecast potential price movements.
What technical and fundamental indicators should be monitored for WNXM price prediction?
Monitor WNXM technical indicators: support/resistance levels, moving averages, RSI, MACD, and trading volume. For fundamentals, track NXM protocol adoption, insurance underwriting capacity, governance activity, and market sentiment. Combine these signals for comprehensive analysis.
What are the risks of investing in WNXM for price prediction trading?
WNXM price prediction trading carries market volatility risk, liquidity risk, and potential loss of capital. Price fluctuations can be rapid and unpredictable. Smart contract risks and trading amount fluctuations may impact returns. Always research thoroughly before trading.
* The information is not intended to be and does not constitute financial advice or any other recommendation of any sort offered or endorsed by Gate.