This comprehensive analysis examines XCV's market position and price trajectory from 2026 to 2031. XCarnival, as a metaverse asset lending platform, currently trades at $0.0003804 with extreme market fear sentiment. The article evaluates historical price patterns, institutional dynamics, and macroeconomic factors influencing XCV's value. Price forecasts range from conservative estimates of $0.00031-$0.00038 in 2026 to optimistic projections exceeding $0.00075 by 2031. Investors receive detailed strategies including long-term holding and active trading approaches, asset allocation guidelines, and comprehensive risk management frameworks. Critical considerations include XCV's high volatility, limited liquidity on Gate exchange, regulatory uncertainties in DeFi lending, and smart contract risks. This guide equips beginners through institutional investors with professional analysis for informed decision-making.
Introduction: XCV's Market Position and Investment Value
XCarnival (XCV), as a collateral lending platform for metaverse assets, has been serving the NFT and long-tail asset liquidity market since its launch in October 2021. As of February 2026, XCV maintains a market capitalization of approximately $300,760, with a circulating supply of around 790.64 million tokens, and the price hovering around $0.0003804. This asset, known as "infrastructure for metaverse asset liquidity," is playing an increasingly relevant role in NFT-backed lending and synthetic asset creation.
This article will comprehensively analyze XCV's price trends from 2026 to 2031, combining historical patterns, market supply-demand dynamics, ecosystem development, and macroeconomic environment to provide investors with professional price forecasts and practical investment strategies.
I. XCV Price History Review and Market Status
XCV Historical Price Evolution
- 2021: XCV reached its price peak on November 18, recording $1.95
- 2025: Price declined significantly, hitting the low point of $0.00026481 on February 4
- Recent period: Price recovered from the low, showing a one-year increase of 42.47%
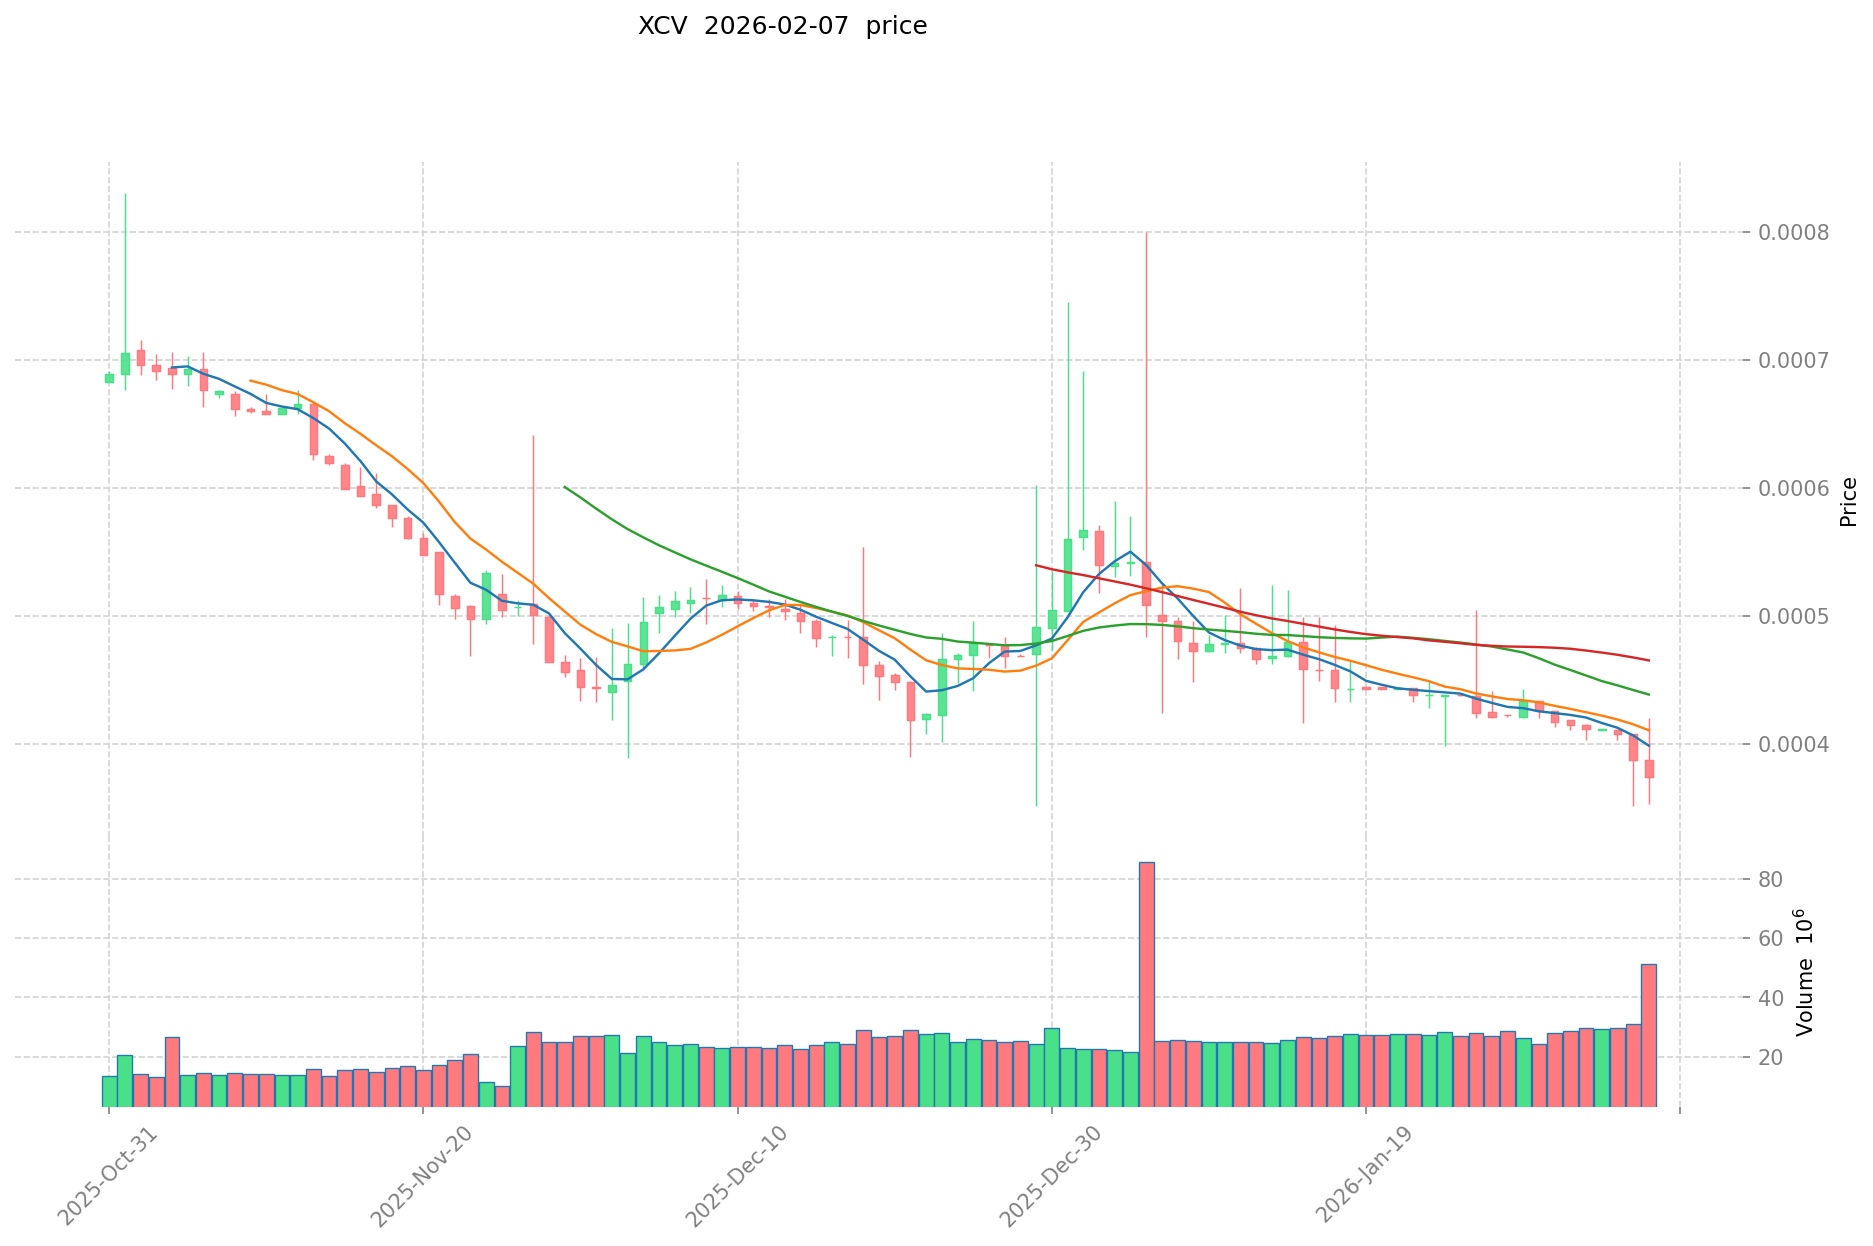
XCV Current Market Situation
As of February 07, 2026, XCV is trading at $0.0003804. The token has experienced a 1.79% increase over the past hour, while showing a decline of 2.21% in the 24-hour period. Over the past week, XCV has decreased by 10.68%, and the 30-day performance indicates a decline of 19.3%.
The 24-hour trading volume stands at $19,978.33, with the price ranging between $0.0003554 and $0.0003899 during this period. The current market capitalization is approximately $300,759.69, with a circulating supply of 790,640,622 XCV tokens, representing 79.06% of the total supply of 1,000,000,000 tokens. The market capitalization to fully diluted valuation ratio is 79.06%, and the market dominance is 0.000015%.
The current market sentiment index shows a reading of 6, indicating extreme fear in the broader market.
Click to view the current XCV market price
XCV Market Sentiment Index
2026-02-07 Fear and Greed Index: 6 (Extreme Fear)
Click to view current Fear & Greed Index
The crypto market is experiencing extreme fear sentiment. An index reading of 6 indicates severe market pessimism and panic selling. Investors are demonstrating heightened anxiety about market conditions. During such extreme fear periods, contrarian traders often see opportunities to accumulate assets at depressed prices. However, cautious risk management remains essential. Monitor market developments closely and consider your investment strategy carefully before making any trading decisions on Gate.com.

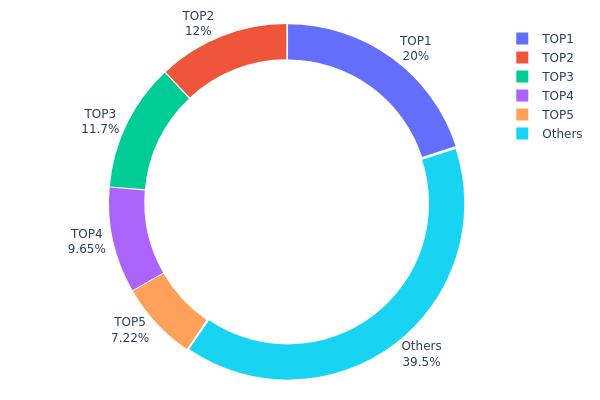
XCV Token Holder Distribution
Token holder distribution reflects the allocation pattern of XCV tokens across different addresses on the blockchain. This metric is crucial for assessing the degree of decentralization and potential concentration risks within the XCV ecosystem. By analyzing the proportion of tokens held by top addresses versus smaller holders, we can evaluate the project's structural health and susceptibility to price manipulation.
Based on current on-chain data, XCV exhibits a moderately concentrated holder structure. The top address controls 20.00% of the total supply (200,000K tokens), while the top five addresses collectively hold approximately 60.5% of the circulating supply. This concentration level suggests that a relatively small number of entities possess significant influence over the token's market dynamics. The remaining 39.5% is distributed among other holders, indicating some degree of token dispersion beyond the major stakeholders.
This distribution pattern presents both opportunities and risks for the XCV market. On one hand, the 39.5% held by smaller addresses demonstrates a foundation for broader community participation and organic market activity. On the other hand, the substantial holdings concentrated in the top five addresses could potentially lead to heightened price volatility if these major holders decide to liquidate positions. Such concentration may also raise concerns about governance centralization and the potential for coordinated market influence. Investors should monitor whether this distribution evolves toward greater decentralization over time, which would typically signal improved market maturity and reduced systemic risk.
Click to view current XCV Token Holder Distribution
| Top |
Address |
Holding Qty |
Holding (%) |
| 1 |
0xf037...841f0d |
200000.00K |
20.00% |
| 2 |
0x4edf...dc65e4 |
120000.00K |
12.00% |
| 3 |
0x1c1d...7a53f1 |
116568.09K |
11.65% |
| 4 |
0x53f7...f3fa23 |
96479.65K |
9.64% |
| 5 |
0x4982...6e89cb |
72171.76K |
7.21% |
| - |
Others |
394780.51K |
39.5% |
II. Core Factors Influencing XCV's Future Price
Supply Mechanism
- Market Demand and Adoption Trends: XCV's price outlook is influenced by market demand and adoption trends. As adoption expands and more users engage with XCV, increased demand may put upward pressure on prices.
- Historical Pattern: Historical data suggests that when prices rise above intrinsic value, subsequent corrections tend to occur. Price trends often demonstrate momentum that can persist for extended periods, though this momentum may weaken as valuations stretch.
- Current Impact: Short-term price trends remain relevant for investors monitoring exchange activities. Current market dynamics suggest that price movements continue to be affected by the interplay between actual value and market pricing.
Institutional and Major Holder Dynamics
- Institutional Participation: The price prospects of XCV are influenced by institutional participation and broader economic factors. Institutional engagement represents a significant factor in establishing price stability and long-term market confidence.
Macroeconomic Environment
- Monetary Policy Impact: Broader economic factors, including monetary conditions and investor sentiment, continue to shape XCV's price trajectory. The cryptocurrency market remains sensitive to shifts in global economic policy.
- Economic Considerations: Market participants need to consider how macroeconomic conditions affect risk appetite and investment flows into digital assets. Economic uncertainty can influence both short-term trading patterns and longer-term holding strategies.
III. 2026-2031 XCV Price Forecast
2026 Outlook
- Conservative Forecast: $0.00031 - $0.00038
- Neutral Forecast: $0.00038 (average price target)
- Optimistic Forecast: $0.00042 (requiring favorable market sentiment and adoption momentum)
2027-2029 Outlook
- Market Stage Expectation: Gradual accumulation phase with moderate volatility, transitioning toward potential breakout territory by late 2028
- Price Range Forecast:
- 2027: $0.00032 - $0.00042 (projected 5% year-over-year change)
- 2028: $0.00030 - $0.00058 (projected 8% year-over-year change with expanded volatility)
- 2029: $0.00036 - $0.00073 (projected 30% year-over-year change indicating accelerated growth phase)
- Key Catalysts: Ecosystem expansion, potential partnership announcements, broader crypto market recovery cycles, and increased utility adoption
2030-2031 Long-term Outlook
- Baseline Scenario: $0.00047 - $0.00065 (assuming steady ecosystem development and maintained market interest)
- Optimistic Scenario: $0.00061 - $0.00075 (contingent upon successful technology implementations and sustained demand growth)
- Transformative Scenario: Exceeding $0.00075 threshold by 2031 (requiring breakthrough partnerships, significant protocol upgrades, or exceptional market conditions driving 65% cumulative growth from 2026 baseline)
- 2026-02-07: XCV consolidating near $0.00038 average range (establishing foundation for potential multi-year appreciation trajectory)
| Year |
Predicted High Price |
Predicted Average Price |
Predicted Low Price |
Price Change |
| 2026 |
0.00042 |
0.00038 |
0.00031 |
0 |
| 2027 |
0.00042 |
0.0004 |
0.00032 |
5 |
| 2028 |
0.00058 |
0.00041 |
0.0003 |
8 |
| 2029 |
0.00073 |
0.0005 |
0.00036 |
30 |
| 2030 |
0.00065 |
0.00061 |
0.00047 |
61 |
| 2031 |
0.00075 |
0.00063 |
0.00037 |
65 |
IV. XCV Professional Investment Strategy and Risk Management
XCV Investment Methodology
(1) Long-term Holding Strategy
- Suitable for: Investors interested in DeFi and metaverse infrastructure with moderate to high risk tolerance
- Operational Recommendations:
- Consider accumulating positions during market corrections, given XCV's significant volatility
- Monitor developments in XCarnival's multi-chain deployment plans and protocol adoption metrics
- Utilize Gate Web3 Wallet for secure storage of XCV tokens with enhanced security features
(2) Active Trading Strategy
- Technical Analysis Tools:
- Volume Analysis: Monitor the relatively low 24-hour trading volume ($19,978) to identify potential liquidity constraints and volatility patterns
- Support and Resistance Levels: Track the 24-hour range ($0.0003554 - $0.0003899) to identify short-term trading opportunities
- Swing Trading Considerations:
- Be aware of the token's high volatility, with 7-day and 30-day declines of 10.68% and 19.3% respectively
- Set strict stop-loss orders due to limited liquidity and price fluctuations
XCV Risk Management Framework
(1) Asset Allocation Principles
- Conservative Investors: 1-2% of crypto portfolio
- Aggressive Investors: 3-5% of crypto portfolio
- Professional Investors: Up to 5-8% with active management and hedging strategies
(2) Risk Hedging Solutions
- Portfolio Diversification: Combine XCV with more established DeFi and metaverse tokens to balance risk exposure
- Position Sizing: Limit individual position size due to the token's lower market capitalization and ranking (3522)
(3) Security Storage Solutions
- Recommended: Gate Web3 Wallet for convenient access and enhanced security features
- Alternative Solution: Hardware wallet storage for larger holdings intended for long-term retention
- Security Precautions: Never share private keys or seed phrases; enable two-factor authentication; regularly update wallet software; be cautious of phishing attempts
V. XCV Potential Risks and Challenges
XCV Market Risks
- High Volatility: XCV has experienced significant price fluctuations, with a 30-day decline of 19.3% and historical price ranging from an all-time high of $1.95 to an all-time low of $0.00026481
- Limited Liquidity: With 24-hour trading volume of approximately $19,978 and trading available on only 1 exchange, liquidity constraints may impact price execution and increase slippage
- Market Cap Concerns: The relatively small market capitalization ($300,759) and ranking (3522) indicate limited market adoption and higher susceptibility to price manipulation
XCV Regulatory Risks
- DeFi Regulatory Uncertainty: As a lending platform for NFT and long-tail assets, XCarnival may face evolving regulatory scrutiny regarding asset-backed lending and DeFi operations
- Multi-chain Compliance: The protocol's planned deployment across BSC, Ethereum Layer 2, Polygon, and Solana may encounter varying regulatory requirements across different jurisdictions
- NFT Lending Regulations: Emerging regulatory frameworks for NFT-collateralized lending could impact XCarnival's core business model and operations
XCV Technical Risks
- Smart Contract Vulnerabilities: As a lending protocol with complex mechanisms like time-limited auction liquidation, smart contract bugs or exploits could result in significant losses
- Cross-chain Implementation: The multi-chain deployment strategy introduces technical complexity and potential security vulnerabilities during bridge operations
- Platform Adoption: The success of XCarnival depends on sustained adoption of its XBroker and Megabox modules, which face competition from established DeFi lending platforms
VI. Conclusion and Action Recommendations
XCV Investment Value Assessment
XCV presents a speculative opportunity in the NFT and metaverse lending infrastructure space, offering innovative solutions for illiquid asset collateralization. However, the token faces significant challenges including limited liquidity, substantial recent price declines, and a relatively small market presence. The long-term value proposition depends on successful execution of the multi-chain deployment strategy and meaningful adoption of the protocol's unique features. Short-term risks remain elevated due to market volatility, limited trading volume, and broader uncertainties in the DeFi and NFT sectors.
XCV Investment Recommendations
✅ Beginners: Exercise extreme caution; if considering exposure, allocate only a minimal portion (under 1%) of your crypto portfolio and prioritize learning about DeFi lending mechanisms before investing
✅ Experienced Investors: Consider XCV as a speculative position with strict risk management; monitor protocol development milestones and user adoption metrics; maintain position sizes of 2-3% maximum
✅ Institutional Investors: Conduct comprehensive due diligence on smart contract audits and team credentials; evaluate as part of a diversified DeFi infrastructure thesis; implement sophisticated risk management and hedging strategies
XCV Trading Participation Methods
- Spot Trading: Purchase XCV on Gate.com with various trading pairs for immediate ownership and flexibility
- Dollar-Cost Averaging: Implement systematic purchases to mitigate timing risk in the volatile crypto market
- Portfolio Allocation: Include XCV as part of a broader DeFi and metaverse-focused investment strategy with appropriate diversification
Cryptocurrency investment carries extremely high risks, and this article does not constitute investment advice. Investors should make prudent decisions based on their own risk tolerance and are advised to consult professional financial advisors. Never invest more than you can afford to lose.
FAQ
XCV experienced significant volatility over the past year, fluctuating between US$0.00044 and US$0.00045. Historically, XCV reached an all-time high of US$1.95 in November 2021. Current price levels remain substantially lower than previous peaks.
What is the XCV price prediction for 2024? What is the analyst's target price?
XCV price prediction for 2024 was approximately 100 USD, with analyst target price around 120 USD. The forecast was based on market demand dynamics and global trade trends.
What are the main factors affecting XCV price?
XCV price is primarily influenced by market demand and trading volume, blockchain adoption rates, regulatory developments, macroeconomic conditions, and investor sentiment in the crypto market. Technical factors like network activity and token utility also play significant roles in price movements.
What are the price advantages of XCV compared to other similar assets?
XCV offers compelling price advantages through its low transaction fees and efficient trading speed. At $0.000413, XCV provides exceptional value entry point with high liquidity and faster transaction processing compared to competing assets in its category.
What are the risks of XCV price fluctuations? What should investors pay attention to?
XCV price volatility is influenced by market dynamics, trading volume, regulatory changes, and sentiment shifts. Investors should monitor market trends, diversify portfolios, and set risk management strategies like stop-loss orders to protect investments effectively.
How will XCV's technical and fundamental analysis indicate price development?
XCV technical and fundamental analysis suggests potential upward price movement, driven by growing investor optimism and strategic accumulation during market dips, supported by strengthening network metrics and increasing trading volume.
* The information is not intended to be and does not constitute financial advice or any other recommendation of any sort offered or endorsed by Gate.