XL1, the utility token of XYO Layer One network, currently trades at $0.0003854 with a market cap of $2.20 million as of February 2026. This comprehensive analysis examines XL1's market dynamics, price history, and investment potential across multiple timeframes. The article evaluates core price drivers including supply mechanisms, institutional participation, macroeconomic conditions, and market sentiment, while presenting detailed price scenarios from 2026 through 2031. Professional investment strategies are outlined for different investor types, encompassing long-term holding approaches and active trading tactics with emphasis on risk management and secure storage solutions. Key challenges addressed include high volatility (68.56% annual decline), low liquidity with only $7,173 daily trading volume, and extreme token concentration with top five holders controlling 88.53% of supply. The analysis provides actionable recommendations for beginners, experienced traders, and institutional investors, combined wit
Introduction: XL1's Market Position and Investment Value
XL1, the utility token of the XYO Layer One network, serves as the gas and transaction fee mechanism for the first scalable data blockchain designed to bring verifiable information on-chain. Since its launch in 2025, XL1 has established itself within the decentralized physical infrastructure network (DePIN) ecosystem, supporting a contributor network of over 10 million nodes. As of February 2026, XL1 maintains a market capitalization of approximately $2.20 million, with a circulating supply of 5.7 billion tokens and a current price around $0.0003854. This asset, operating within a dual-token ecosystem alongside XYO, plays a role in powering smart contracts, validator rewards, and cross-chain bridging functionality while supporting applications in artificial intelligence, real-world assets, geospatial intelligence, and location-based gaming.
This article will comprehensively analyze XL1's price trajectory from 2026 through 2031, examining historical patterns, market supply and demand dynamics, ecosystem development, and macroeconomic conditions to provide investors with professional price forecasts and practical investment strategies.
I. XL1 Price History Review and Current Market Status
XL1 Historical Price Evolution Trajectory
Due to limited historical data availability, comprehensive yearly price evolution cannot be documented at this time. The available records indicate:
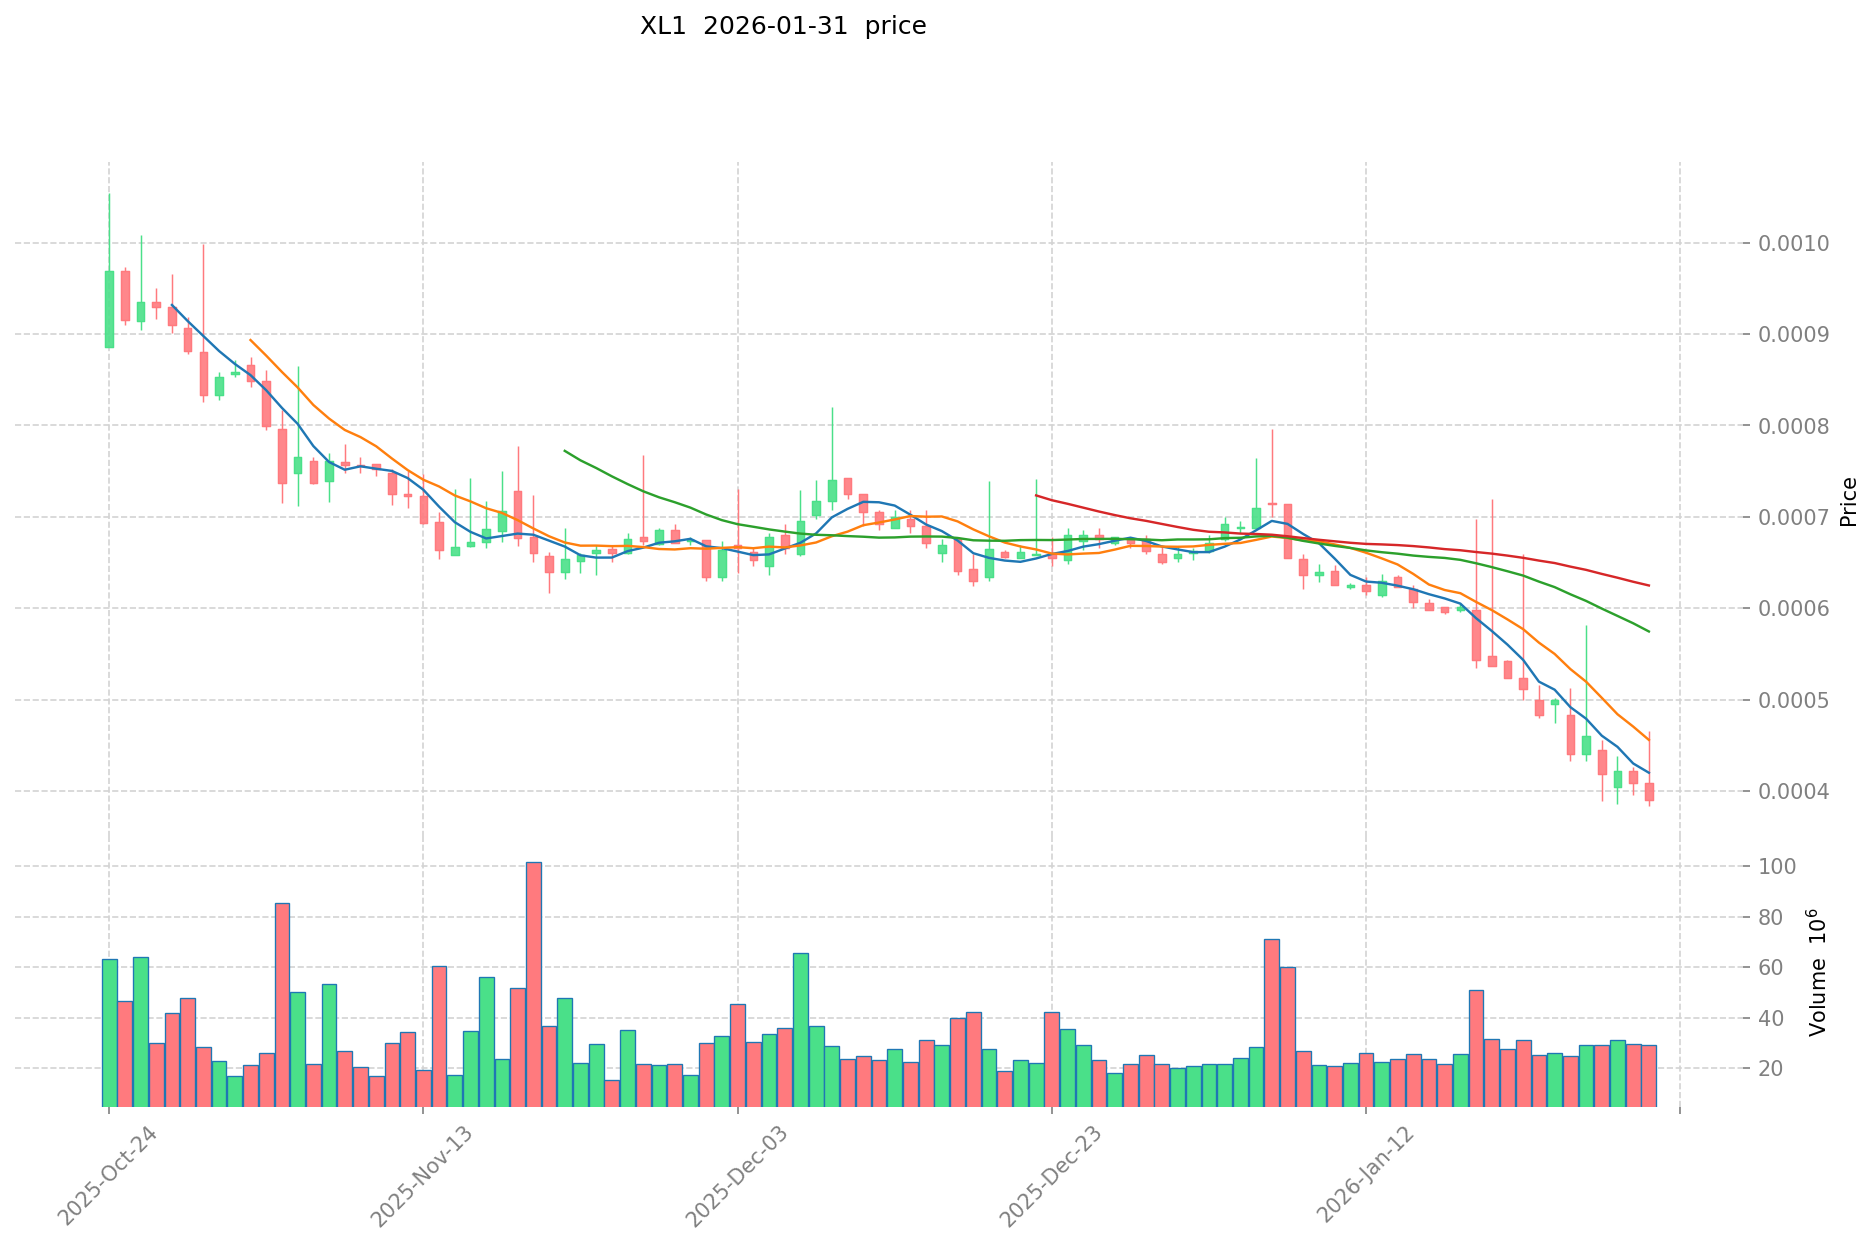
- September 2025: XL1 reached a notable price level of $0.0027985, marking a significant point in its trading history
- January 2026: The token experienced downward pressure, touching $0.0003677, representing a substantial decline from previous levels
XL1 Current Market Dynamics
As of February 1, 2026, XL1 is trading at $0.0003854, reflecting recent market activity. The token ranks #1981 by market capitalization, with a circulating supply of 5.7 billion tokens out of a total supply of 38 billion and a maximum supply of 48 billion tokens.
The 24-hour trading volume stands at $7,173.23, while the market capitalization reaches approximately $2.20 million. The fully diluted valuation is calculated at $14.65 million, with the current market cap representing 15% of the FDV. XL1's market dominance remains at 0.00053% of the overall cryptocurrency market.
Recent price performance shows mixed signals across different timeframes. Over the past hour, XL1 has gained 0.1%. However, the 24-hour period reflects a decline of 0.82%, with the price ranging between $0.0003677 and $0.0004123. The weekly performance indicates a decrease of 19.73%, while the monthly chart shows a decline of 41.26%. The annual performance reveals a decrease of 68.56% from price levels observed a year prior.
The token currently has 1,284 holders and is listed on 4 exchanges. As a utility token for the XYO Layer One network, XL1 serves multiple functions within the ecosystem, including payment for gas fees and transaction costs, with a portion being burned through network activity. The token powers smart contracts, decentralized applications, validator rewards, and supports cross-chain bridging functionality.
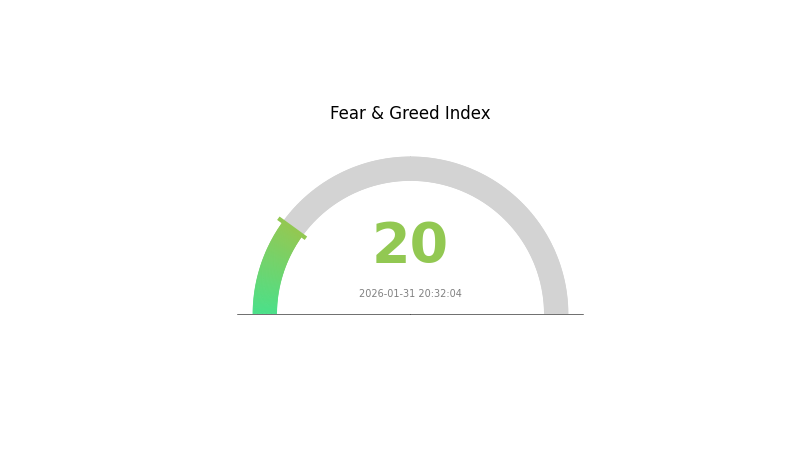
The broader market sentiment, as indicated by the Volatility Index, stands at 20, corresponding to a state of extreme fear. This metric suggests heightened caution among market participants, which may influence short-term trading patterns and price action for XL1 and other digital assets.
Click to view current XL1 market price
XL1 Market Sentiment Index
2026-01-31 Fear and Greed Index: 20 (Extreme Fear)
Click to view current Fear & Greed Index
The XL1 market is currently experiencing extreme fear with an index reading of 20. This exceptionally low sentiment indicates heightened market anxiety and pessimism among investors. During periods of extreme fear, opportunities often emerge as asset prices reach discounted levels. Experienced traders typically view such conditions as potential entry points, while risk-averse investors may exercise caution. Market participants should monitor key support levels and remain vigilant of significant news developments that could trigger further volatility.
XL1 Holdings Distribution
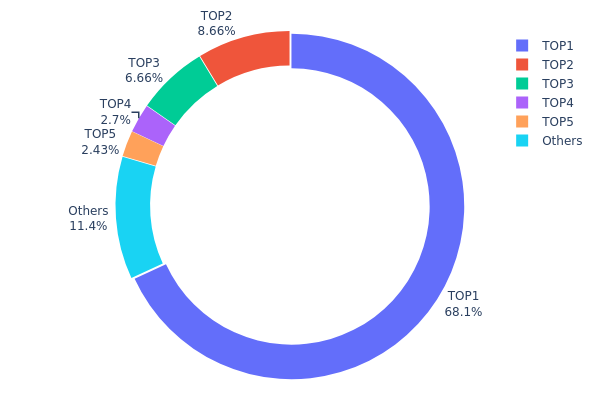
The holdings distribution chart illustrates how XL1 tokens are allocated across different wallet addresses, providing crucial insights into the token's decentralization level and potential market control dynamics. This metric is fundamental for assessing the concentration risk and overall health of token distribution across the network.
Based on current on-chain data, XL1 exhibits a notably high concentration pattern. The top-ranked address holds approximately 12.26 billion tokens, representing 68.11% of the total supply—a remarkably dominant position. The second and third largest holders control 8.66% and 6.65% respectively, while addresses ranked fourth and fifth maintain 2.69% and 2.42% of the supply. Combined, the top five addresses account for 88.53% of total circulation, with the remaining 11.47% distributed among other market participants.
This extreme concentration presents significant structural implications for market behavior. The dominant position of the largest holder creates substantial downside risk, as any liquidation activity could trigger severe price volatility. Furthermore, such concentrated ownership raises concerns about potential market manipulation capabilities and limits organic price discovery mechanisms. The current distribution pattern suggests limited decentralization, indicating a market structure vulnerable to single-party decisions and restricted participation depth. From a liquidity perspective, this concentration may constrain trading activity and amplify price swings during periods of market stress, particularly if large holders execute substantial transactions.
Click to view current XL1 Holdings Distribution
| Top |
Address |
Holding Qty |
Holding (%) |
| 1 |
0xc551...c06562 |
12260763.06K |
68.11% |
| 2 |
0x00a6...546af3 |
1559103.77K |
8.66% |
| 3 |
0x2349...41bf0b |
1198406.12K |
6.65% |
| 4 |
0x0000...e08a90 |
485816.79K |
2.69% |
| 5 |
0x7daf...706f83 |
436934.13K |
2.42% |
| - |
Others |
2058976.13K |
11.47% |
II. Core Factors Influencing XL1's Future Price
Supply Mechanism
- Growth Rate Projection: Market analysis suggests an expected annual growth rate of approximately 5%, which may influence token circulation and availability over time.
- Current Impact: The supply dynamics are anticipated to interact with broader market demand patterns, potentially affecting price volatility in response to adoption trends.
Institutional and Major Holder Dynamics
- Institutional Participation: The price outlook is influenced by the level of institutional engagement, which plays a role in market stability and liquidity.
- Adoption Trends: Wider adoption patterns contribute to demand factors that may support price movements over the medium to long term.
Macroeconomic Environment
- Monetary Policy Impact: Broader economic factors, including central bank policies and macroeconomic conditions, have been identified as significant influences on cryptocurrency market sentiment.
- Regulatory Policy: Clear and supportive regulatory frameworks can enhance investor confidence and promote market growth, potentially supporting price appreciation. Conversely, ambiguous or overly restrictive regulations may hinder development and affect valuations.
- Geopolitical Factors: International economic conditions and geopolitical developments continue to shape the overall cryptocurrency market environment.
Market Sentiment and Investor Confidence
- Investor Sentiment: Market psychology and investor confidence directly impact price movements. Positive news regarding widespread adoption or significant developments can influence trading behavior.
- Market Emotion: The emotional response of market participants to news, developments, and market trends plays a considerable role in short-term price fluctuations.
III. 2026-2031 XL1 Price Prediction
2026 Outlook
- Conservative Prediction: $0.00036 - $0.00039
- Neutral Prediction: Around $0.00039
- Optimistic Prediction: Up to $0.00042 (requires favorable market conditions and increased adoption)
2027-2029 Mid-Term Outlook
- Market Stage Expectation: XL1 may enter a gradual growth phase as the project continues to develop its ecosystem and expand its user base. The cryptocurrency market's overall trend and broader adoption of blockchain technology could play significant roles during this period.
- Price Range Predictions:
- 2027: $0.00032 - $0.0005
- 2028: $0.00027 - $0.00055
- 2029: $0.00047 - $0.00061
- Key Catalysts: Potential drivers include technological upgrades, strategic partnerships, increased trading volume on platforms like Gate.com, and growing interest in the project's underlying use case.
2030-2031 Long-Term Outlook
- Baseline Scenario: $0.00034 - $0.00066 (assuming steady market development and moderate adoption rates)
- Optimistic Scenario: $0.00045 - $0.00081 (contingent on significant ecosystem expansion and favorable regulatory environment)
- Transformative Scenario: Potential to approach or exceed $0.00081 (requires exceptional market conditions, widespread adoption, and breakthrough developments in the project's technology or partnerships)
- 2026-02-01: XL1 is positioned at the beginning of its predicted growth trajectory, with an estimated average price around $0.00039
| Year |
Predicted High Price |
Predicted Average Price |
Predicted Low Price |
Price Change |
| 2026 |
0.00042 |
0.00039 |
0.00036 |
0 |
| 2027 |
0.0005 |
0.0004 |
0.00032 |
4 |
| 2028 |
0.00055 |
0.00045 |
0.00027 |
16 |
| 2029 |
0.00061 |
0.0005 |
0.00047 |
29 |
| 2030 |
0.00066 |
0.00056 |
0.00034 |
44 |
| 2031 |
0.00081 |
0.00061 |
0.00045 |
57 |
IV. XL1 Professional Investment Strategy and Risk Management
XL1 Investment Methodology
(1) Long-Term Holding Strategy
- Suitable for: Investors who believe in the long-term potential of decentralized oracle networks and DePIN infrastructure, particularly those interested in location-based data verification and real-world asset integration.
- Operational Recommendations:
- Consider accumulating XL1 during market corrections, given the token's significant price decline of 68.56% over the past year, which may present potential entry opportunities for risk-tolerant investors.
- Monitor the development progress of XYO Layer One's scalable data blockchain and its adoption in AI, geospatial intelligence, and location-based gaming sectors.
- Storage Solution: Utilize Gate Web3 Wallet for secure storage of XL1 tokens, ensuring proper backup of recovery phrases and enabling two-factor authentication for enhanced security.
(2) Active Trading Strategy
- Technical Analysis Tools:
- Volume Analysis: With a 24-hour trading volume of approximately $7,173, traders should be aware of relatively lower liquidity, which may result in higher price volatility and slippage during larger trades.
- Price Range Monitoring: Current 24-hour range shows volatility between $0.0003677 (also the all-time low) and $0.0004123, providing insights for short-term trading opportunities.
- Swing Trading Key Points:
- Monitor the token's proximity to its all-time low of $0.0003677 (reached on January 31, 2026) as potential support levels.
- Consider the significant distance from the all-time high of $0.0027985 (reached on September 16, 2025) when evaluating potential upside and risk-reward ratios.
XL1 Risk Management Framework
(1) Asset Allocation Principles
- Conservative Investors: 1-2% of crypto portfolio, given the token's high volatility and relatively small market capitalization of approximately $2.2 million.
- Aggressive Investors: 3-5% of crypto portfolio, suitable for those with higher risk tolerance and belief in the DePIN sector's growth potential.
- Professional Investors: 5-10% of crypto portfolio, applicable to those with deep understanding of oracle networks and ability to actively manage positions during volatile periods.
(2) Risk Hedging Solutions
- Portfolio Diversification: Balance XL1 holdings with more established cryptocurrencies and traditional assets to mitigate project-specific risks.
- Position Sizing Strategy: Given the 15% circulating supply ratio (5.7 billion out of 48 billion max supply), investors should be aware of potential future token unlock events that may impact price dynamics.
(3) Secure Storage Solutions
- Hot Wallet Recommendation: Gate Web3 Wallet for convenient trading and staking access, with appropriate security measures enabled.
- Cold Storage Solution: For larger holdings intended for long-term storage, consider hardware wallet solutions to minimize exposure to online security threats.
- Security Precautions: Never share private keys or recovery phrases; verify all transaction addresses before confirming transfers; be cautious of phishing attempts targeting XL1 holders.
V. XL1 Potential Risks and Challenges
XL1 Market Risks
- High Volatility: XL1 has experienced significant price declines, with a 68.56% decrease over the past year and 41.26% drop over the past 30 days, indicating substantial market volatility and downside risk.
- Low Liquidity: With a 24-hour trading volume of approximately $7,173 and listing on only 4 exchanges, the token faces liquidity constraints that may result in difficulty executing large orders without significant price impact.
- Market Cap Positioning: Ranked at #1981 with a market capitalization of approximately $2.2 million, XL1 remains a micro-cap cryptocurrency with inherent risks associated with smaller projects, including potential delisting risks and reduced market attention.
XL1 Regulatory Risks
- Oracle Network Regulation: As decentralized oracle networks become more prominent, regulatory frameworks may evolve to address data verification services, potentially impacting XYO's operational model.
- Location Data Privacy: The project's focus on Proof of Location and geospatial intelligence may face increased scrutiny regarding data privacy regulations, particularly in jurisdictions with strict data protection laws.
- Token Classification Uncertainty: Dual-token economic models (XL1 and XYO) may face regulatory examination regarding their classification and compliance requirements across different jurisdictions.
XL1 Technical Risks
- Network Scalability: As the first scalable data blockchain in the XYO ecosystem, XL1's infrastructure must successfully handle increasing transaction volumes while maintaining decentralization and security.
- Smart Contract Vulnerabilities: The token operates on Ethereum (ERC-20 standard) and powers smart contracts within the XYO Layer One network, exposing it to potential smart contract bugs or exploitation risks.
- Token Supply Dynamics: With only 15% of the maximum supply currently circulating (5.7 billion out of 48 billion tokens), future token releases could create significant selling pressure and impact price stability.
VI. Conclusion and Action Recommendations
XL1 Investment Value Assessment
XL1 represents a high-risk, speculative investment opportunity within the decentralized oracle and DePIN infrastructure sector. The token serves as the utility layer for XYO Layer One, supporting gas fees, smart contracts, and validator rewards while enabling cross-chain functionality. The project's focus on verifiable location data for AI, real-world assets, and geospatial intelligence addresses emerging market needs. However, investors must carefully weigh the significant challenges: the token has declined 68.56% over the past year, currently trades near its all-time low, maintains a micro-cap market position with limited liquidity, and faces substantial token supply expansion risks with only 15% of maximum supply currently circulating. The success of XL1 depends heavily on the adoption of XYO's oracle network and the broader growth of location-based blockchain applications.
XL1 Investment Recommendations
✅ Beginners: Exercise extreme caution with XL1 investment. If considering participation, allocate no more than 1% of your crypto portfolio and view it as a highly speculative position. Prioritize understanding the fundamentals of oracle networks and DePIN infrastructure before investing. Consider paper trading or observing price action for several weeks to understand volatility patterns.
✅ Experienced Investors: XL1 may be suitable for a small speculative allocation (2-5% of crypto portfolio) if you have conviction in the DePIN sector's growth and XYO's competitive positioning. Implement strict stop-loss orders given the high volatility. Monitor the project's development milestones, adoption metrics for the oracle network, and token unlock schedules. Consider dollar-cost averaging to mitigate timing risk in this volatile asset.
✅ Institutional Investors: Conduct thorough due diligence on XYO's technology stack, competitive advantages in the oracle market, and token economics before considering any allocation. Evaluate liquidity constraints carefully, as the low trading volume may restrict position sizing. Consider XL1 only as part of a broader DePIN or oracle infrastructure thesis, with appropriate risk management frameworks and position limits in place.
XL1 Trading Participation Methods
- Spot Trading on Gate.com: Access XL1 spot markets for direct token purchases and sales, suitable for building long-term positions or executing swing trading strategies based on technical analysis.
- Staking Participation: Explore staking opportunities within the XYO ecosystem to earn rewards, as mentioned in the project's step-based reward mechanism, though investors should verify current staking terms and lock-up periods.
- Portfolio Integration: Incorporate XL1 as part of a diversified DePIN or oracle network investment strategy, balancing exposure across multiple projects in the sector to mitigate single-project risk.
Cryptocurrency investment carries extremely high risk, and this article does not constitute investment advice. Investors should make prudent decisions based on their own risk tolerance and are advised to consult professional financial advisors. Never invest more than you can afford to lose.
FAQ
What is XL1 and what is its current price?
XL1 is a cryptocurrency token with current price of $0.00039818. Its market capitalization is $2.27 million, reflecting its position in the crypto market as an emerging digital asset.
What factors influence XL1 price prediction and market trends?
XL1 price prediction is influenced by supply and demand dynamics, market sentiment driven by news events, trading volume, investor behavior, and macroeconomic conditions. These factors collectively shape price trends and market movements.
Is XL1 a good investment for 2024-2025, and what are the risks?
XL1 showed strong potential during 2024-2025 with increasing adoption and market momentum. Key risks include market volatility, regulatory changes, and competition. Success depends on your risk tolerance and investment horizon.
How does XL1 compare to similar projects or assets in the market?
XL1 trades below $0.001, offering competitive pricing versus similar tokens. With unique utility in the XYO Layer One ecosystem and strong development focus, XL1 demonstrates potential for outperformance as market adoption accelerates and investor interest grows.
What are the historical price movements and technical analysis indicators for XL1?
XL1 employs MACD, RSI, and Bollinger Bands for technical analysis. Historical data shows volatile price movements with identifiable trend patterns. Current technical indicators suggest positive short-term momentum in the market.
* The information is not intended to be and does not constitute financial advice or any other recommendation of any sort offered or endorsed by Gate.


