This comprehensive analysis evaluates XTTA's investment potential through 2031, examining the TrendX AI-powered trading platform's market position, historical price evolution, and ecosystem development. Currently trading at $0.10314 with a $4.08 million market cap, XTTA demonstrates significant volatility and concentrated token distribution requiring careful risk assessment. The article projects price ranges from $0.05668-$0.11543 in 2026, potentially reaching $0.18263-$0.23682 by 2031, driven by ecosystem adoption and technological advancement. Key analysis covers supply dynamics, market sentiment indicators, and macroeconomic factors influencing XTTA's trajectory. Professional investment strategies include long-term holding approaches and active trading methodologies tailored to different investor profiles, complemented by robust risk management frameworks. The guide emphasizes trading through Gate's spot markets with dollar-cost averaging strategies while highlighting regulatory, technical, and market liqu
Introduction: XTTA's Market Position and Investment Value
TrendX (XTTA), as an AI and DePIN-powered profit strategy arsenal designed for a tiered net-value user experience, has been processing massive amounts of on-chain and off-chain data since its inception in 2022. As of 2026, XTTA's market capitalization stands at approximately $4.08 million, with a circulating supply of around 39.54 million tokens, and its price maintains at approximately $0.103. This asset, known as a data-driven investment insights platform, is playing an increasingly important role in the field of AI-powered trading and investment solutions.
This article will comprehensively analyze XTTA's price trajectory from 2026 to 2031, combining historical patterns, market supply and demand dynamics, ecosystem development, and macroeconomic environment factors to provide investors with professional price forecasts and practical investment strategies.
I. XTTA Price History Review and Market Status
XTTA Historical Price Evolution Trajectory
- 2025: XTTA launched on January 26, 2025, with a publish price of $0.07, experiencing significant volatility in its early trading days
- 2025: On October 2, 2025, XTTA reached a notable high of $0.52934, marking a substantial increase from its launch price
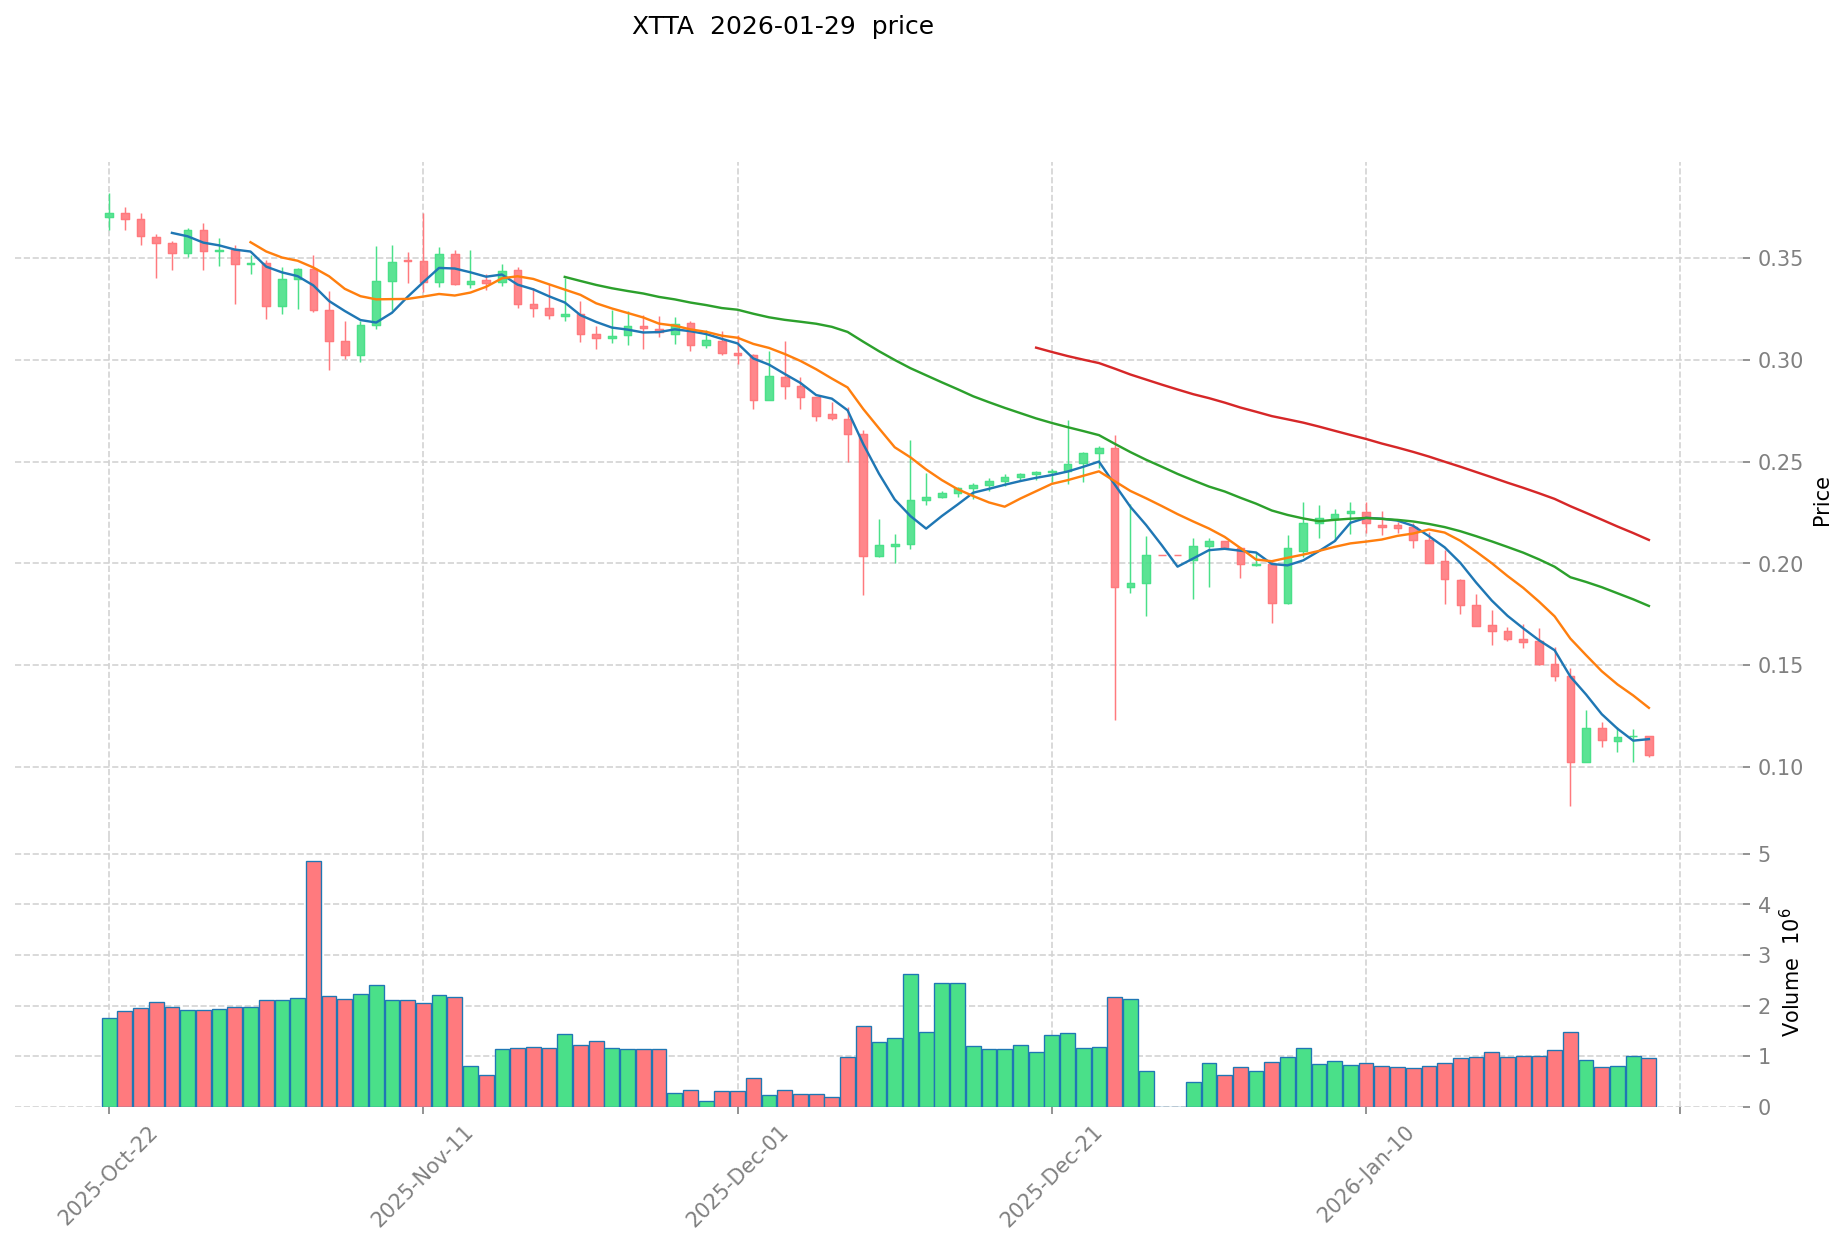
- 2026: As of January 30, 2026, the token has experienced considerable market adjustments, with the price declining to $0.10314
XTTA Current Market Status
As of January 30, 2026, XTTA is trading at $0.10314, representing a 5.98% decrease over the past 24 hours. The token has shown notable price movements across different timeframes, with a 1-hour change of -0.11%, a 7-day decline of 29.099%, and a 30-day decrease of 50.18%. Year-to-date performance indicates a 48.15% decline.
The 24-hour trading range has been between $0.103 (low) and $0.11389 (high), with total trading volume reaching $98,252.64. XTTA currently holds a market ranking of 1633, with a circulating supply of approximately 39.54 million tokens out of a maximum supply of 400 million tokens, representing a circulation ratio of approximately 9.88%.
The token's market capitalization stands at approximately $4.08 million, while the fully diluted market cap is calculated at $41.26 million. XTTA maintains a market dominance of 0.0013% and is held by approximately 2,010 addresses. The token is deployed on the BASE blockchain network with the contract address 0xb4c6458c2e67da23caa4ffadb9b4d3659da98164.
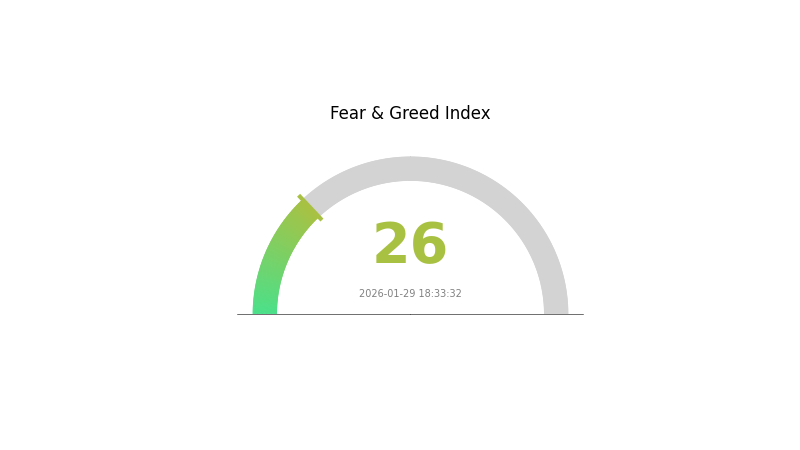
Current market sentiment indicators show a fear level at 26, reflecting cautious investor sentiment in the broader cryptocurrency market environment.
Click to view current XTTA market price
XTTA Market Sentiment Index
2026-01-29 Fear and Greed Index: 26 (Fear)
Click to view current Fear & Greed Index
The cryptocurrency market is currently experiencing a fear sentiment with an index reading of 26. This indicates heightened market anxiety and cautious investor behavior. When the Fear and Greed Index drops into the fear zone, it typically reflects concerns about price volatility and market uncertainty. Investors should exercise prudence during such periods, carefully evaluating their risk tolerance and portfolio strategies. Lower index readings often present opportunities for long-term investors to accumulate assets at potentially favorable prices, though market conditions remain uncertain.
XTTA Token Holding Distribution
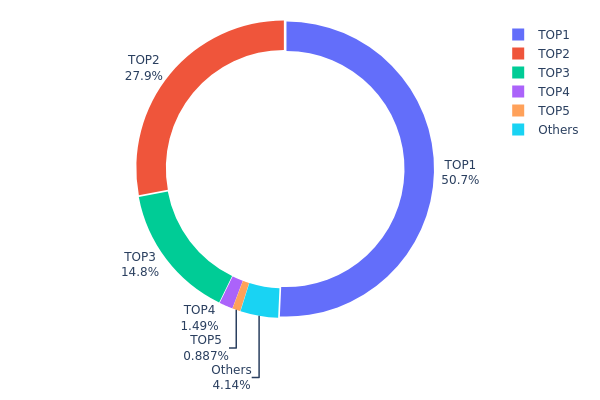
The token holding distribution chart reveals the allocation of XTTA tokens across different wallet addresses, serving as a critical indicator of token concentration and decentralization levels. This metric directly reflects the distribution of market power among holders and provides insights into potential price manipulation risks and market stability.
Based on current on-chain data, XTTA exhibits a notably concentrated holding structure. The top holder controls approximately 50.71% of the total supply (202.85 million tokens), while the second-largest address holds 27.94% (111.76 million tokens). Combined, these two addresses account for 78.65% of the circulating supply. The third-ranked address represents a burn address (0x0000...00dead) holding 14.83%, which effectively removes these tokens from circulation. Beyond the top five addresses, the remaining holders collectively control only 4.16% of the supply, indicating significant centralization.
This high concentration pattern presents substantial market structure risks. The dominant positions held by the top two addresses create potential vulnerabilities to large-scale sell pressure, which could trigger significant price volatility. Such centralization may also raise concerns about governance control and market manipulation possibilities. However, the presence of burned tokens (14.83%) demonstrates a deflationary mechanism that could benefit long-term token economics. The current distribution suggests XTTA operates with limited decentralization, requiring investors to carefully assess concentration risks when evaluating market dynamics and liquidity conditions.
Click to view current XTTA Token Holding Distribution
| Top |
Address |
Holding Qty |
Holding (%) |
| 1 |
0xdc8b...15ee18 |
202851.12K |
50.71% |
| 2 |
0x716e...3632c5 |
111761.26K |
27.94% |
| 3 |
0x0000...00dead |
59342.21K |
14.83% |
| 4 |
0xc882...84f071 |
5952.96K |
1.48% |
| 5 |
0xddf9...1dbf60 |
3549.62K |
0.88% |
| - |
Others |
16542.83K |
4.16% |
II. Core Factors Influencing XTTA's Future Price
Supply Mechanism
- Halving Mechanism: According to industry insiders, the halving event represents a supply-side contraction that is expected to accelerate the formation of XTTA's scarcity and value loop, with XTTA continuing to play a core role in broader applications.
- Historical Pattern: Supply-side contractions have historically been coupled with growth expectations on the demand side.
- Current Impact: The upcoming halving is anticipated to enhance XTTA's scarcity value, potentially driving price appreciation as supply tightens while demand continues to grow.
Market Dynamics and Risk Factors
- Market Volatility: Despite the computing power ecosystem providing a relatively stable return model, investment returns are accompanied by certain risks, including market fluctuations, excessive concentration of computing power, and technical issues that may affect investment stability.
- Investor Considerations: Market participants should conduct thorough research, considering their investment objectives and risk tolerance before making investment decisions.
Macro Environment
- Market Sentiment: Overall market sentiment plays a significant role in cryptocurrency price movements, with XTTA being influenced by broader crypto market trends.
- Acceptance and Adoption: The level of market acceptance and adoption rate continues to be a key factor in XTTA's price trajectory.
Technology Development and Ecosystem Construction
- AI-Driven Analytics: TrendX utilizes artificial intelligence to process large volumes of on-chain and off-chain data, including blockchain activity, market behavior, and social signals, providing real-time trend predictions, strategic recommendations, and alerts.
- Dual-Token System: The platform operates with a dual-token system comprising TTA and XTTA, which serves as a foundational element of its ecosystem architecture.
- Computing Power Ecosystem: The XTTA computing power ecosystem offers potential investment opportunities, with the token positioned to play an increasingly important role as the ecosystem expands.
III. 2026-2031 XTTA Price Prediction
2026 Outlook
- Conservative prediction: $0.05668 - $0.08000
- Neutral prediction: $0.08000 - $0.10306
- Optimistic prediction: $0.10306 - $0.11543 (contingent on favorable market sentiment and ecosystem development)
2027-2029 Outlook
- Market stage expectation: XTTA may transition through an accumulation phase in 2027, potentially entering a growth phase by 2028-2029 as adoption metrics improve and market conditions stabilize.
- Price range predictions:
- 2027: $0.08521 - $0.12563
- 2028: $0.09043 - $0.17263
- 2029: $0.07687 - $0.21175
- Key catalysts: Projected year-over-year growth averaging 5-40% during this period could be driven by technological upgrades, strategic partnerships, and broader cryptocurrency market recovery cycles.
2030-2031 Long-term Outlook
- Base scenario: $0.13915 - $0.22299 (assuming sustained development activity and stable regulatory environment)
- Optimistic scenario: $0.17839 - $0.23682 (contingent on accelerated adoption rates and successful protocol enhancements)
- Transformative scenario: Potential to reach upper bounds of $0.23682 by 2031 (requiring exceptional market conditions, widespread institutional adoption, and significant technological breakthroughs)
- 2031-01-30: XTTA may experience cumulative growth of approximately 94% from 2026 baseline, reflecting maturation of the project ecosystem and enhanced market positioning.
| Year |
Predicted High Price |
Predicted Average Price |
Predicted Low Price |
Price Change |
| 2026 |
0.11543 |
0.10306 |
0.05668 |
0 |
| 2027 |
0.12563 |
0.10924 |
0.08521 |
5 |
| 2028 |
0.17263 |
0.11744 |
0.09043 |
13 |
| 2029 |
0.21175 |
0.14503 |
0.07687 |
40 |
| 2030 |
0.22299 |
0.17839 |
0.13915 |
72 |
| 2031 |
0.23682 |
0.20069 |
0.18263 |
94 |
IV. XTTA Professional Investment Strategies and Risk Management
XTTA Investment Methodology
(1) Long-term Holding Strategy
- Suitable for: Investors seeking exposure to AI-powered trading solutions with a 1-3 year investment horizon
- Operational Recommendations:
- Consider accumulating positions during market consolidation phases when technical indicators suggest oversold conditions
- Monitor project development milestones and data processing capacity expansion as key performance indicators
- Storage Solution: Utilize Gate Web3 Wallet for secure asset custody with multi-signature protection
(2) Active Trading Strategy
- Technical Analysis Tools:
- Moving Averages: Track 50-day and 200-day moving averages to identify trend reversals and momentum shifts
- Volume Analysis: Monitor trading volume patterns relative to the current 24-hour volume of approximately $98,252 to gauge market interest
- Swing Trading Key Points:
- Set stop-loss orders 8-12% below entry points to manage downside risk
- Consider taking partial profits during rallies approaching previous resistance levels
XTTA Risk Management Framework
(1) Asset Allocation Principles
- Conservative Investors: 1-2% of crypto portfolio
- Aggressive Investors: 3-5% of crypto portfolio
- Professional Investors: Up to 8% with active risk monitoring
(2) Risk Hedging Solutions
- Portfolio Diversification: Balance XTTA exposure with established cryptocurrencies and stablecoins
- Position Sizing: Implement dollar-cost averaging to reduce timing risk during volatile periods
(3) Secure Storage Solutions
- Hot Wallet Recommendation: Gate Web3 Wallet for active trading with convenient access
- Cold Storage Solution: Consider hardware wallet solutions for long-term holdings exceeding $10,000
- Security Considerations: Enable two-factor authentication, regularly update security settings, and never share private keys or seed phrases
V. XTTA Potential Risks and Challenges
XTTA Market Risks
- Volatility Risk: Recent price performance shows significant fluctuations with a 30-day decline of over 50%, indicating high volatility potential
- Liquidity Risk: With a current market cap of approximately $4.08 million and limited exchange listings, liquidity constraints may impact large order execution
- Competition Risk: The AI-powered trading solutions sector faces competition from established platforms, potentially affecting market share growth
XTTA Regulatory Risks
- Compliance Evolution: Changes in cryptocurrency regulations across jurisdictions may impact platform operations and token utility
- Data Privacy Regulations: As TrendX processes substantial data volumes, evolving data protection requirements could affect operational frameworks
- Cross-border Restrictions: Potential limitations on AI-driven trading services in certain jurisdictions may constrain user base expansion
XTTA Technical Risks
- Smart Contract Vulnerability: Token deployed on Base network requires ongoing security audits to maintain contract integrity
- Platform Dependency: Technical reliability depends on continuous processing of on-chain and off-chain data streams
- Integration Challenges: Successful execution relies on seamless integration between AI analytics and blockchain transaction layers
VI. Conclusion and Action Recommendations
XTTA Investment Value Assessment
TrendX presents an innovative approach to AI-powered trading strategies, having processed over 20TB of data since 2022. The platform's one-click trading execution and real-time analysis capabilities address genuine market needs. However, the token faces considerable challenges including limited circulating supply (approximately 9.88% of total supply), substantial recent price corrections, and early-stage market positioning. The long-term value proposition depends on the platform's ability to demonstrate consistent performance, expand its user base, and establish sustainable competitive advantages in the evolving AI trading solutions landscape.
XTTA Investment Recommendations
✅ Beginners: Consider waiting for market stabilization and clearer project trajectory before entry; if interested, limit allocation to less than 1% of total portfolio
✅ Experienced Investors: May consider small speculative positions with strict risk parameters, focusing on project development milestones and user adoption metrics
✅ Institutional Investors: Conduct comprehensive due diligence on platform performance data, security audits, and regulatory compliance before considering allocation
XTTA Trading Participation Methods
- Spot Trading: Access XTTA through Gate.com spot markets for direct token purchase and sale
- Dollar-Cost Averaging: Implement systematic purchasing strategies to mitigate timing risk and reduce average entry cost
- Research-Based Approach: Monitor platform updates, user growth metrics, and AI performance indicators before making investment decisions
Cryptocurrency investment carries extremely high risks, and this article does not constitute investment advice. Investors should make prudent decisions based on their own risk tolerance and are advised to consult professional financial advisors. Never invest more than you can afford to lose.
FAQ
What is XTTA? What are its uses and value?
XTTA is the core token of the TrendX computing power ecosystem. It powers mining operations and attracts miners and investors through expanding application scenarios. As adoption grows, XTTA demonstrates strong market momentum and increasing utility value.
How to predict the future price trend of XTTA tokens?
XTTA price trends can be predicted by analyzing market sentiment, trading volume, blockchain activity, and overall crypto market conditions. Monitor historical price patterns and community adoption rates. Combined technical and fundamental analysis provides more reliable forecasts for XTTA's future performance.
What are the main factors affecting XTTA price?
XTTA price is influenced by supply and demand dynamics, market sentiment driven by news and social media, regulatory developments like ETF approvals, institutional investment flows, and overall crypto market trends.
What advantages does XTTA have compared to similar tokens?
XTTA offers competitive trading rewards and generous BGB airdrop incentives through promotional events. It features strong community engagement, active trading volume, and distinctive tokenomics that differentiate it from comparable tokens in the market.
What risks should I be aware of when investing in XTTA?
XTTA investment carries market volatility risks. Conduct thorough research on project fundamentals, team credentials, and tokenomics. Assess your risk tolerance and investment capacity carefully before participating. Only invest what you can afford to lose.
* The information is not intended to be and does not constitute financial advice or any other recommendation of any sort offered or endorsed by Gate.