This comprehensive analysis examines YieldBasis (YB) token's market position and price trajectory from 2026 to 2031, providing investors with professional forecasts and actionable strategies. YB currently trades at $0.2474 with a $21.75 million market cap, following a significant correction from its October 2025 launch peak of $0.8424. The article combines historical price patterns, market dynamics, and ecosystem development to deliver conservative ($0.1667-$0.2488), neutral, and optimistic ($0.2687) 2026 forecasts, alongside detailed long-term projections through 2031. Investment strategies span long-term holding and active trading approaches, complemented by comprehensive risk management frameworks addressing volatility, liquidity constraints, and concentrated token distribution. Essential guidance addresses market risks, regulatory uncertainties, and security best practices for storing YB tokens on Gate's Web3 Wallet, enabling informed decision-making for beginners, experienced, and institutional investors
Introduction: YB's Market Position and Investment Value
YieldBasis (YB), positioned as a DeFi protocol leveraging Curve's crvUSD to enhance yields for BTC and ETH holders while addressing impermanent loss, has established its presence in the decentralized finance landscape since its launch in 2025. As of January 2026, YB maintains a market capitalization of approximately $21.75 million, with a circulating supply of around 87.92 million tokens and a current price hovering near $0.2474. This asset, designed to optimize yield generation through leveraged liquidity mechanisms, is playing an increasingly significant role in the DeFi yield optimization sector.
This article will comprehensively analyze YB's price trajectory from 2026 to 2031, combining historical patterns, market supply-demand dynamics, ecosystem development, and macroeconomic factors to provide investors with professional price forecasts and practical investment strategies.
I. YB Price History Review and Market Status
YB Historical Price Evolution Trajectory
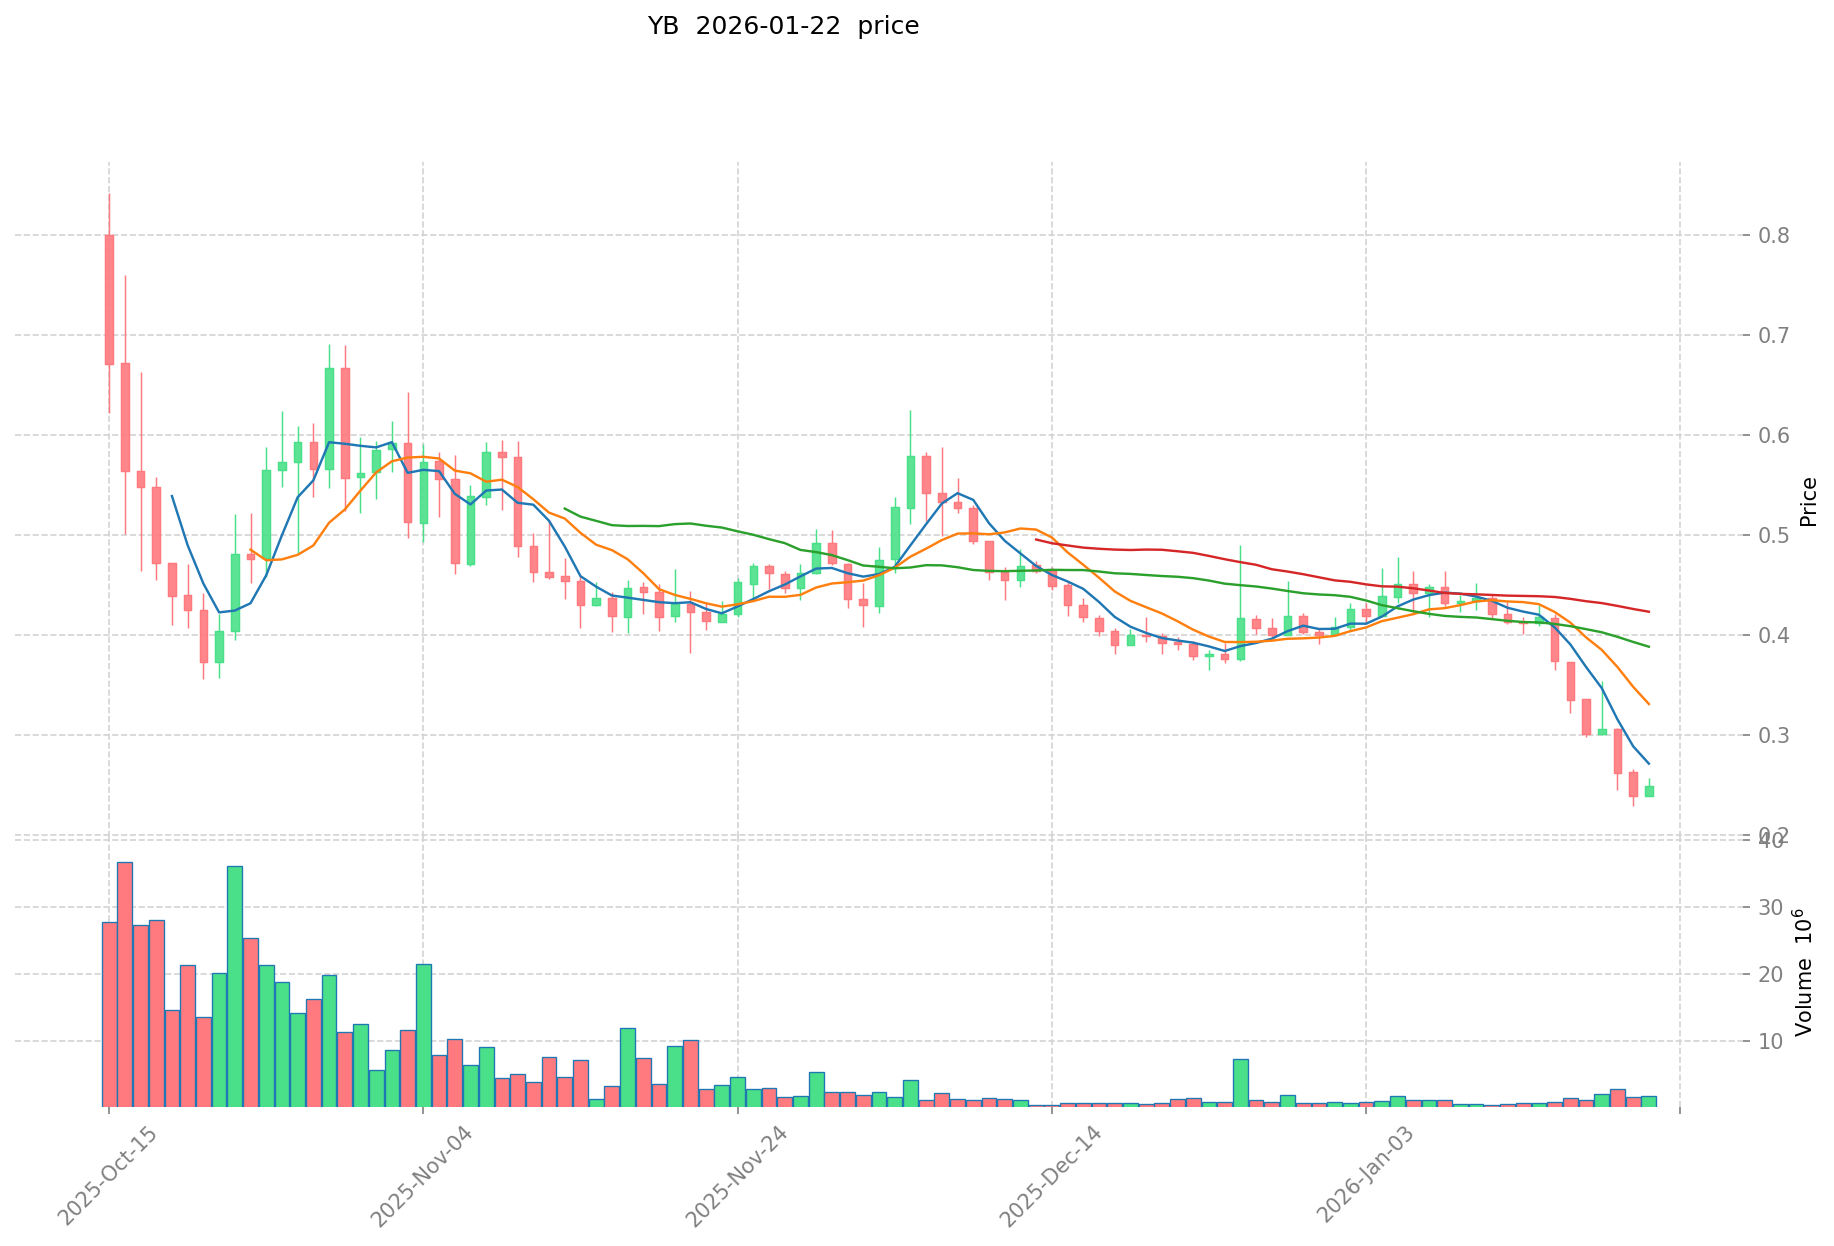
- October 2025: YB launched on Gate.com at $0.8424, reaching its all-time high on October 15, 2025, demonstrating initial strong market interest in the protocol
- Late 2025 to Early 2026: Price entered a significant correction phase, declining substantially from the October peak as market conditions shifted
- January 2026: Price reached its all-time low of $0.2288 on January 20, 2026, representing a notable retracement from launch levels
YB Current Market Status
As of January 23, 2026, YB is trading at $0.2474, showing a slight recovery from its recent low point. The token has experienced a 1.099% increase over the past hour, though it declined 2.52% in the last 24 hours. The broader trend remains challenging, with a 34.48% decline over the past 7 days and a 34.72% decrease over 30 days.
YB currently holds a market ranking of 839 with a circulating market capitalization of approximately $21.75 million. The circulating supply stands at 87.92 million tokens out of a total supply of 700 million, representing an 8.79% circulation rate. The fully diluted valuation reaches $173.18 million based on the maximum supply of 1 billion tokens.
The 24-hour trading volume amounts to $342,238, while the token's market dominance stands at 0.0054%. With 7,087 holders and availability on 35 exchanges, YB maintains a presence in the DeFi ecosystem. The current market sentiment indicator shows an Extreme Fear reading of 20, reflecting cautious investor sentiment in the broader cryptocurrency market.
The price range over the past 24 hours has fluctuated between $0.2423 and $0.2575, indicating relatively contained volatility in recent trading sessions.
Click to view current YB market price
YB Market Sentiment Index
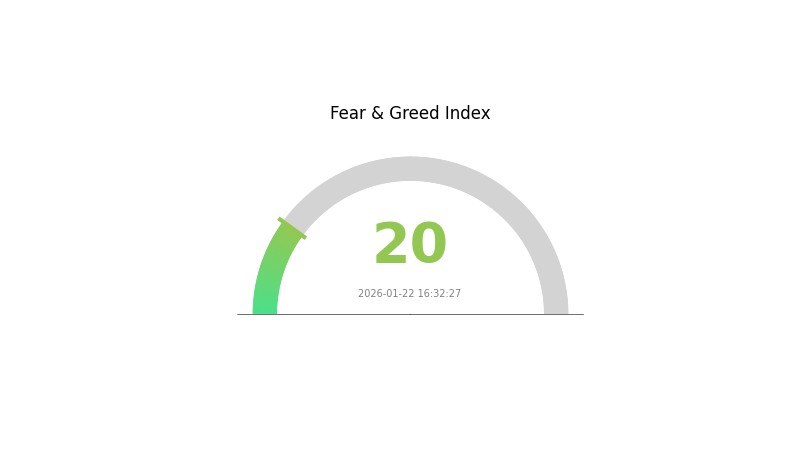
2026-01-22 Fear and Greed Index: 20 (Extreme Fear)
Click to view current Fear & Greed Index
The crypto market is currently experiencing extreme fear, with the index reading at 20. This indicates that market participants are deeply pessimistic about near-term price movements. Extreme fear periods often present contrarian opportunities for long-term investors, as assets may be oversold. However, cautious risk management remains essential. Monitor key support levels and consider dollar-cost averaging during such market conditions on Gate.com to build positions strategically.
YB Holding Distribution
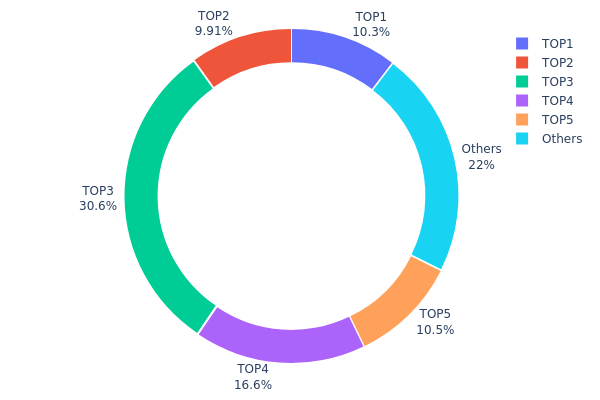
The holding distribution chart illustrates the concentration of token ownership across different wallet addresses, providing insights into the degree of centralization within the token's ecosystem. By examining the percentage of total supply held by top addresses, analysts can assess potential market manipulation risks and the overall health of token distribution.
Based on the current data, YB exhibits a moderate to high concentration pattern. The top 5 addresses collectively control approximately 77.94% of the total supply, with the largest single address (0x93eb...2785e3) holding 30.62% of all tokens. The second and fourth largest holders possess 16.64% and 10.46% respectively, while the remaining addresses in the top 5 each control around 10% of the supply. Only 22.06% of tokens are distributed among other addresses, indicating a significantly concentrated ownership structure.
This concentration level presents notable implications for market dynamics. The substantial holdings concentrated in a few addresses could lead to increased price volatility, as large-scale transactions from these major holders may significantly impact market liquidity and price stability. Such centralization also raises concerns about potential coordinated market manipulation and creates vulnerability to sudden sell-offs. From a decentralization perspective, this distribution pattern suggests that decision-making power and market influence remain heavily concentrated, which may affect the token's long-term resilience and community-driven governance capabilities. The relatively small portion held by "Others" indicates limited broad-based adoption and suggests that the token's on-chain structure may benefit from more diverse distribution to enhance market stability.
Click to view current YB Holding Distribution
| Top |
Address |
Holding Qty |
Holding (%) |
| 1 |
0x5254...f40065 |
74000.00K |
10.32% |
| 2 |
0x36e3...b206a8 |
70984.73K |
9.90% |
| 3 |
0x93eb...2785e3 |
219432.97K |
30.62% |
| 4 |
0x1198...84602e |
119250.86K |
16.64% |
| 5 |
0x7ac5...052cf2 |
75000.00K |
10.46% |
| - |
Others |
157808.26K |
22.06% |
II. Core Factors Influencing YB's Future Price
Based on the currently available information, we are unable to provide a comprehensive analysis of the core factors that may influence YB's future price movements. The absence of detailed data regarding supply mechanisms, institutional holdings, macroeconomic correlations, and technical developments prevents us from forming substantiated insights at this time.
As more information becomes available through official announcements, on-chain analytics, and market developments, a more thorough assessment of YB's price dynamics will become possible. Investors are advised to conduct their own research and monitor multiple reliable sources before making investment decisions related to YB.
III. 2026-2031 YB Price Prediction
2026 Outlook
- Conservative forecast: $0.1667 - $0.2488
- Neutral forecast: $0.2488 (average trading range)
- Optimistic forecast: $0.2687 (requires favorable market conditions and increased adoption)
2027-2029 Outlook
- Market stage expectation: The token may experience gradual growth with moderate volatility as the project develops its ecosystem and expands its user base
- Price range predictions:
- 2027: $0.19924 - $0.30274, with an estimated 4% increase
- 2028: $0.20214 - $0.38181, potentially seeing a 13% rise
- 2029: $0.20871 - $0.37103, could reach up to 33% growth
- Key catalysts: Enhanced platform utility, strategic partnerships, broader market recovery, and increased institutional interest in the sector
2030-2031 Long-term Outlook
- Baseline scenario: $0.18962 - $0.40383 (assuming steady market conditions and continued project development)
- Optimistic scenario: $0.36239 - $0.46432 (with accelerated adoption and favorable regulatory environment)
- Transformative scenario: Potential to exceed $0.46432 (contingent on breakthrough technological implementations, mass adoption, or significant market shifts)
- 2026-01-23: YB trading within the predicted range of $0.1667 - $0.2687 (establishing baseline for future growth trajectory)
| Year |
Predicted High Price |
Predicted Average Price |
Predicted Low Price |
Price Change |
| 2026 |
0.2687 |
0.2488 |
0.1667 |
0 |
| 2027 |
0.30274 |
0.25875 |
0.19924 |
4 |
| 2028 |
0.38181 |
0.28075 |
0.20214 |
13 |
| 2029 |
0.37103 |
0.33128 |
0.20871 |
33 |
| 2030 |
0.40383 |
0.35116 |
0.18962 |
41 |
| 2031 |
0.46432 |
0.37749 |
0.36239 |
52 |
IV. YB Professional Investment Strategies and Risk Management
YB Investment Methodology
(1) Long-Term Holding Strategy
- Target Investors: Investors who believe in the long-term potential of DeFi protocols and seek exposure to leveraged liquidity mechanisms
- Operational Recommendations:
- Consider accumulating YB tokens during market corrections when the price approaches historical support levels
- Monitor the protocol's Total Value Locked (TVL) and user growth metrics as indicators of fundamental strength
- Storage Solution: Store YB tokens securely using Gate Web3 Wallet, which supports ERC-20 tokens and provides enhanced security features for long-term holdings
(2) Active Trading Strategy
- Technical Analysis Tools:
- Moving Averages: Utilize 20-day and 50-day moving averages to identify short-term trend reversals, particularly relevant given YB's 34.48% decline over the past 7 days
- Volume Analysis: Monitor the 24-hour trading volume of approximately $342,238 relative to market cap to assess liquidity and potential breakout opportunities
- Swing Trading Key Points:
- Watch for price action near the recent low of $0.2288 (recorded on January 20, 2026) as a potential support level
- Set stop-loss orders below key support levels to manage downside risk in volatile market conditions
YB Risk Management Framework
(1) Asset Allocation Principles
- Conservative Investors: 1-3% of total crypto portfolio
- Aggressive Investors: 5-10% of total crypto portfolio
- Professional Investors: Up to 15% with active hedging strategies
(2) Risk Hedging Solutions
- Portfolio Diversification: Balance YB holdings with established assets like BTC and ETH to offset protocol-specific risks
- Position Sizing: Given YB's relatively small market cap of approximately $21.75 million, limit individual position sizes to manage liquidity risk
(3) Security Storage Solutions
- Hot Wallet Recommendation: Gate Web3 Wallet offers user-friendly interface and supports ERC-20 tokens including YB
- Cold Storage Solution: For larger holdings, consider transferring YB tokens to hardware wallets after verifying the ERC-20 contract address (0x01791f726b4103694969820be083196cc7c045ff)
- Security Precautions: Never share private keys or seed phrases, verify contract addresses before transactions, and be cautious of phishing attempts targeting DeFi protocol users
V. YB Potential Risks and Challenges
YB Market Risks
- High Volatility: YB has experienced a 34.72% decline over the past 30 days and 74.75% decline over the past year, indicating significant price volatility that may result in substantial losses
- Low Liquidity: With a circulating market cap of approximately $21.75 million and 24-hour trading volume around $342,238, the relatively low liquidity may lead to increased price slippage during large transactions
- Limited Market Share: YB represents only 0.0054% of the total cryptocurrency market, suggesting limited market recognition and potential difficulty in price recovery during adverse market conditions
YB Regulatory Risks
- DeFi Protocol Scrutiny: Leveraged DeFi protocols may face increased regulatory attention from financial authorities concerned about systemic risks and consumer protection
- Jurisdictional Uncertainty: Regulatory treatment of yield-generating protocols varies across jurisdictions, potentially impacting YB's operational capabilities and token accessibility
- Compliance Evolution: Future regulatory frameworks for DeFi protocols may require adjustments to YB's operational model, potentially affecting token utility and value proposition
YB Technical Risks
- Smart Contract Vulnerabilities: As with any DeFi protocol, YB's smart contracts may contain undiscovered vulnerabilities that could be exploited, potentially resulting in loss of user funds
- Integration Dependencies: YB's reliance on Curve's crvUSD and other external protocols creates dependency risks where issues in integrated systems could impact YB's functionality
- Market Concentration: With only 7,087 holders and relatively low circulating supply (approximately 8.79% of fully diluted valuation), the token distribution may be concentrated among few holders, increasing manipulation risks
VI. Conclusion and Action Recommendations
YB Investment Value Assessment
YieldBasis presents a specialized value proposition within the DeFi ecosystem through its leveraged liquidity mechanism aimed at enhancing yields for BTC and ETH holders while addressing impermanent loss. However, the token has experienced considerable price depreciation, declining 74.75% over the past year and trading significantly below its all-time high of $0.8424. The current market cap of $21.75 million and limited trading volume suggest the project is in an early stage with substantial volatility. Long-term value depends on the protocol's ability to demonstrate sustainable yield generation, attract increased Total Value Locked, and expand its user base beyond the current 7,087 holders. Short-term risks remain elevated due to ongoing market weakness, low liquidity, and the broader challenges facing leveraged DeFi protocols.
YB Investment Recommendations
✅ Beginners: Approach YB with extreme caution due to its high volatility and complex DeFi mechanisms. If interested, allocate no more than 1-2% of total crypto portfolio and focus on learning about leveraged liquidity protocols before investing. Consider starting with established assets before exploring niche DeFi tokens.
✅ Experienced Investors: Consider YB as a speculative allocation within a diversified DeFi portfolio, limiting exposure to 3-5% of total holdings. Monitor protocol metrics such as TVL growth, user adoption, and partnership developments. Be prepared for continued volatility and implement strict stop-loss strategies.
✅ Institutional Investors: Conduct thorough due diligence on YB's smart contract security, team credentials, and competitive positioning within the leveraged liquidity space. Consider YB as part of a broader DeFi research allocation with appropriate risk controls, and evaluate the protocol's potential for institutional yield strategies.
YB Trading Participation Methods
- Spot Trading: Purchase YB tokens through Gate.com, which supports YB trading and offers competitive liquidity for this asset. Always verify the ERC-20 contract address before transactions.
- DCA Strategy: Implement a dollar-cost averaging approach to gradually accumulate YB tokens over time, potentially reducing the impact of short-term price volatility.
- Protocol Participation: Consider utilizing YB tokens directly within the YieldBasis protocol to access leveraged liquidity strategies, though this requires understanding of the protocol's risk parameters and mechanics.
Cryptocurrency investment carries extreme risk, and this article does not constitute investment advice. Investors should make prudent decisions based on their own risk tolerance and are advised to consult professional financial advisors. Never invest more than you can afford to lose.
FAQ
What is the current price of YB? What are the historical high and low prices?
YB's current price is $0.0847 as of January 2026. The historical all-time high reached $0.3562, while the all-time low stood at $0.0012. Price movements reflect market dynamics and trading volume fluctuations throughout YB's lifecycle.
What are the main factors affecting YB price?
YB price is primarily influenced by market demand and supply dynamics, trading volume, broader crypto market sentiment, technological developments, regulatory announcements, adoption rates, and macroeconomic factors. Strong community engagement and ecosystem growth also drive price movements significantly.
What are professional analysts' predictions for YB's future price?
Professional analysts project YB could reach $0.50-$1.20 by 2026 year-end, driven by increasing adoption and network growth. Long-term forecasts suggest potential for $2-$5 as the ecosystem matures. However, market volatility and regulatory factors remain significant variables.
What are the common technical analysis methods used in YB price prediction?
Common methods include moving averages, RSI, MACD, Bollinger Bands, support/resistance levels, candlestick patterns, and volume analysis. These indicators help identify trends, momentum, and potential entry/exit points for YB trading decisions.
What risks should I consider when investing in YB?
YB investment involves market volatility, liquidity risks, and regulatory uncertainties. Monitor price fluctuations, trading volume, and project developments. Diversify your portfolio and only invest what you can afford to lose. Stay updated on market conditions and technology changes.
How does YB perform compared to other mainstream cryptocurrencies?
YB demonstrates strong market performance with high trading volume and robust network activity. Compared to mainstream cryptocurrencies, YB offers competitive transaction speeds, lower fees, and innovative features that position it advantageously in the market.
* The information is not intended to be and does not constitute financial advice or any other recommendation of any sort offered or endorsed by Gate.