This comprehensive analysis examines ZND token's market dynamics and price outlook from 2026-2031. ZND, a regulated financial ecosystem token launched on Gate in January 2025, currently trades at $0.008793 with extreme market fear sentiment. The article reviews historical price evolution, analyzes core factors influencing ZND including supply mechanisms, macroeconomic environment, and ecosystem development, and provides detailed price predictions across conservative, neutral, and optimistic scenarios. Professional investment strategies cover long-term holding and active trading approaches, with risk management frameworks for different investor profiles. The analysis highlights significant risks including extreme volatility, limited liquidity, concentrated token distribution (73.52% held by top address), and regulatory uncertainties. Readers gain actionable insights for informed decision-making on Gate trading platform.
Introduction: ZND's Market Position and Investment Value
ZND, as a fully regulated financial ecosystem token serving Central European crypto market infrastructure, has been establishing its presence since its platform launch in December 2023. As of February 2026, ZND maintains a market capitalization of approximately $1.61 million, with a circulating supply of around 183.63 million tokens, and the price remains at approximately $0.008793. This asset, recognized as a "settlement and utility token within the zondacrypto ecosystem", is playing an increasingly important role in facilitating cryptocurrency payments, trading, and DeFi services through its integrated platform network.
This article will comprehensively analyze ZND's price trajectory from 2026 to 2031, combining historical patterns, market supply-demand dynamics, ecosystem development, and macroeconomic conditions to provide professional price forecasts and practical investment strategies for investors.
I. ZND Price History Review and Market Status
ZND Historical Price Evolution Trajectory
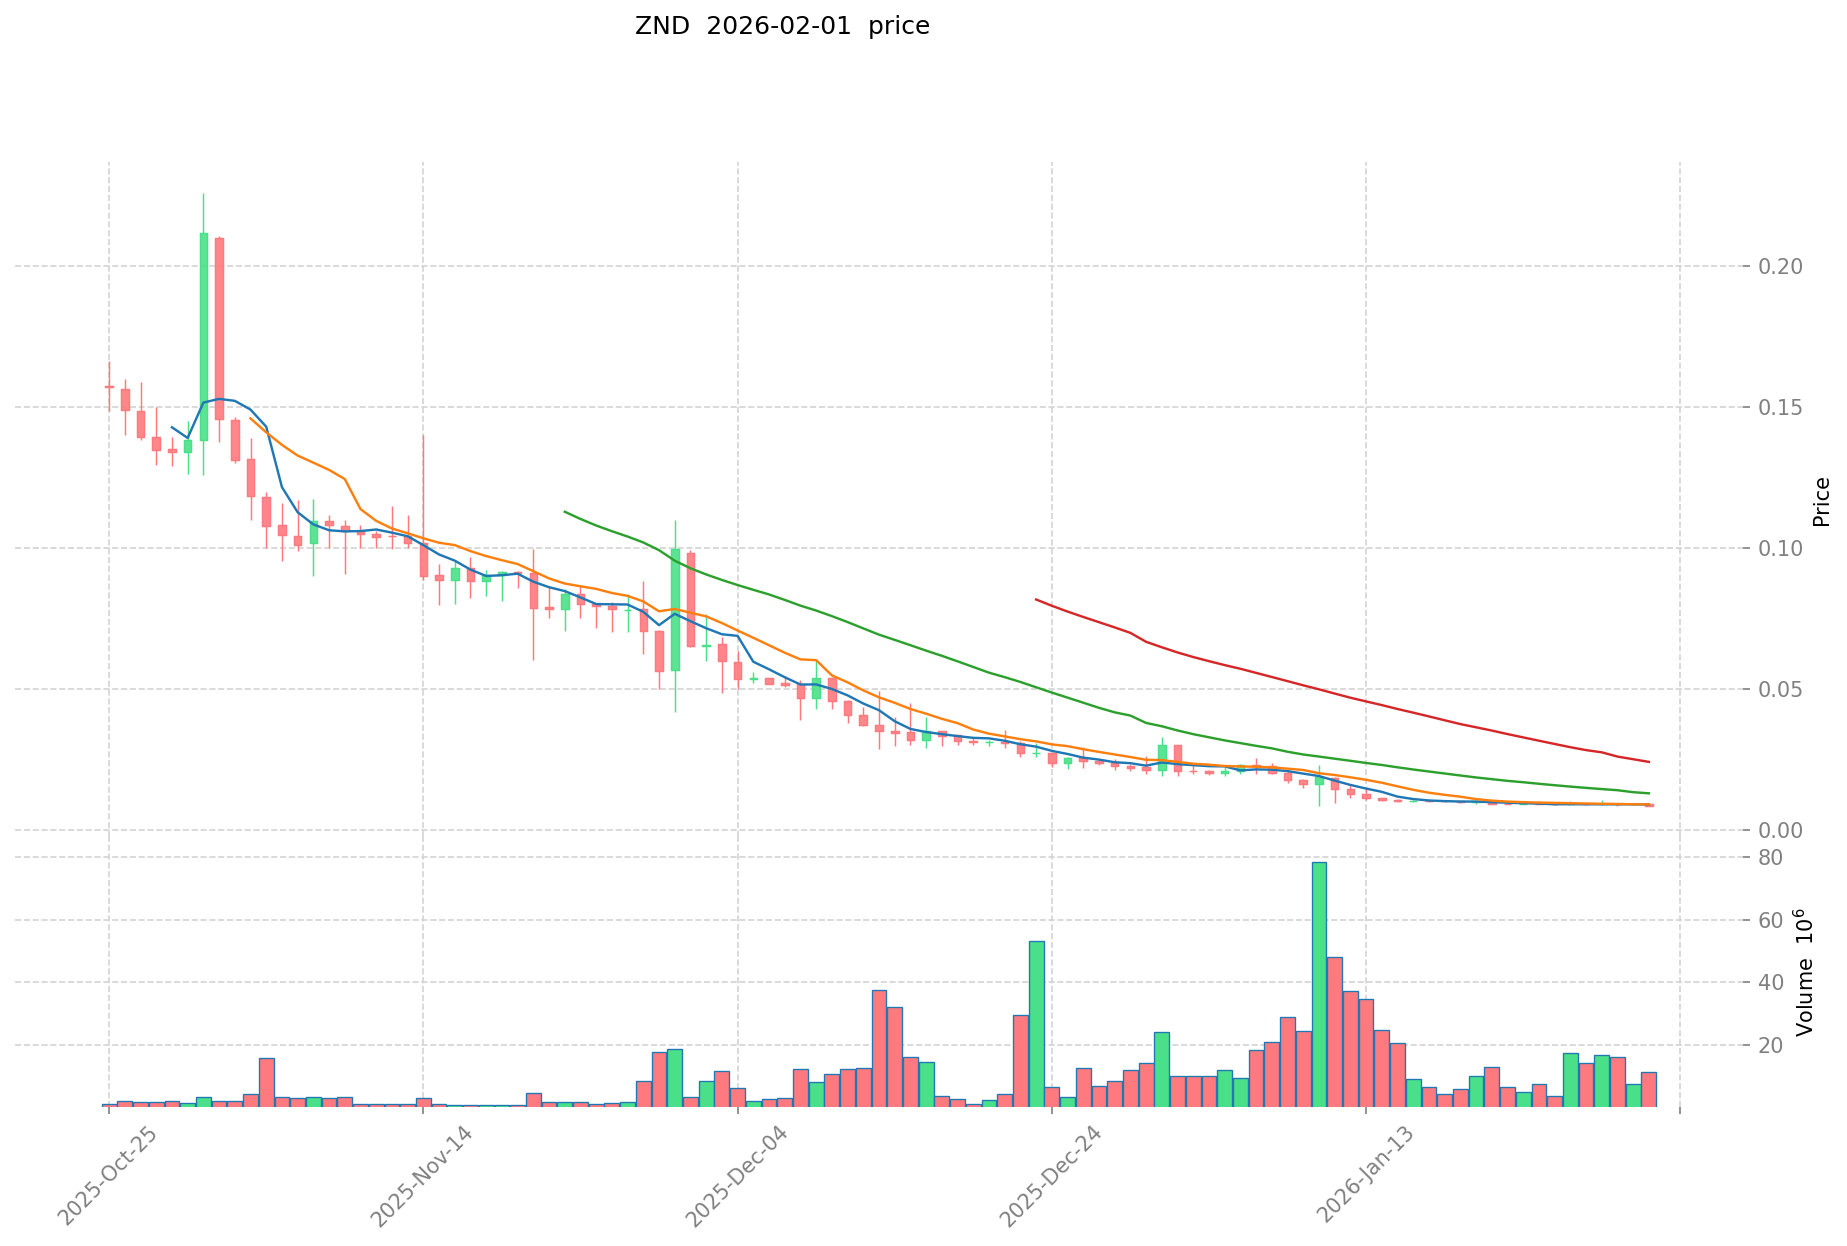
- 2025: ZND launched on Gate.com in January, reaching a peak price of $0.55 in March 2025
- 2025-2026: The token experienced significant volatility, with price declining from the March high
- 2026: Price reached an all-time low of $0.007473 on February 1, 2026, representing a substantial correction from previous levels
ZND Current Market Situation
As of February 2, 2026, ZND is trading at $0.008793, showing a modest recovery from its recent low point. The token's market capitalization stands at approximately $1.61 million, with a circulating supply of 183.63 million tokens representing 12.63% of the maximum supply of 694.35 million tokens.
The 24-hour trading volume is recorded at $103,261.42, while the fully diluted market cap reaches $6.11 million. Recent price trends indicate a 0.43% decline over the past hour and a 1.11% decrease over the past week. The 30-day performance shows a 56.69% decline, with the one-year change reflecting a 98.056% decrease from previous levels.
ZND maintains a market dominance of 0.00022% and is currently listed on 5 exchanges, with Gate.com being a primary trading venue. The token's algorithm follows the ERC-20 standard, with 2,205 holders recorded. The current market sentiment indicator shows a reading of 14, classified as extreme fear.
The token's 24-hour price range has fluctuated between $0.007473 and $0.0093. The market cap to fully diluted valuation ratio stands at 12.63%, indicating that a significant portion of the total supply remains locked or unvested.
Click to view the current ZND market price
ZND Market Sentiment Indicator
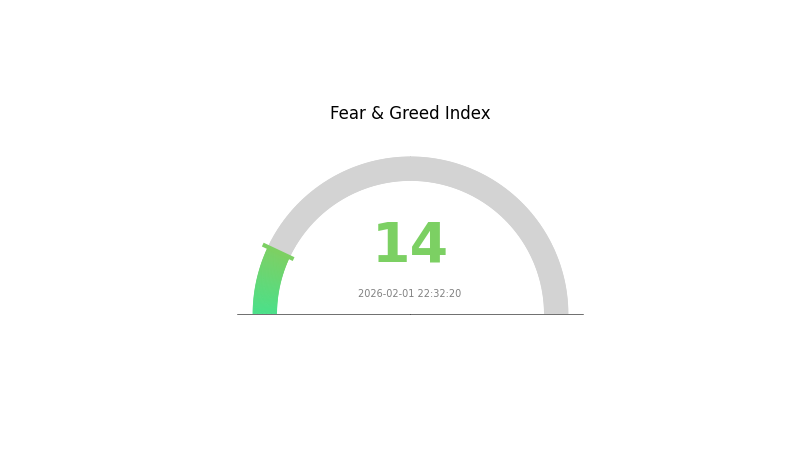
2026-02-01 Fear and Greed Index: 14 (Extreme Fear)
Click to view current Fear & Greed Index
The crypto market is currently experiencing extreme fear with an index reading of just 14. This exceptionally low sentiment suggests investors are highly pessimistic about market conditions. Such levels historically indicate potential buying opportunities for contrarian investors, as excessive fear often precedes market reversals. However, traders should exercise caution and conduct thorough analysis before making investment decisions. Monitor market developments closely on Gate.com to stay informed about shifting sentiment and opportunities.
ZND Token Holding Distribution
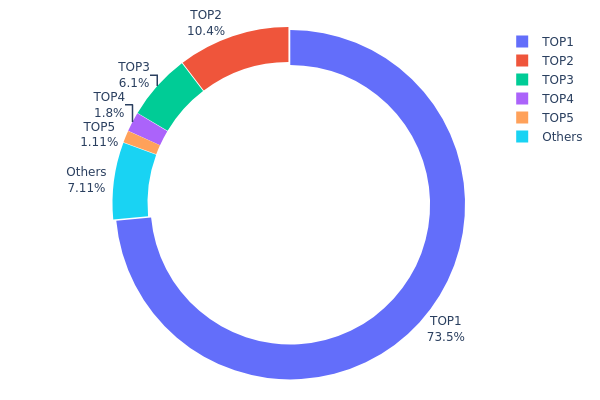
The holding distribution chart reveals the allocation of ZND tokens across different blockchain addresses, serving as a key indicator of market concentration and decentralization. This metric helps assess the degree of control major holders exert over the circulating supply and provides insights into potential market dynamics and stability.
According to current on-chain data, ZND exhibits extremely high concentration characteristics. The top holder controls 510,083.22K tokens, accounting for 73.52% of the total supply, while the second-largest address holds 71,801.02K tokens (10.35%). The top three addresses collectively control nearly 90% of the circulating supply, with the top five addresses commanding 92.86% of all tokens. This distribution pattern indicates that ZND operates under a highly centralized structure, with a small number of addresses wielding significant influence over the token's market behavior.
Such extreme concentration poses substantial risks to market stability and price discovery mechanisms. Major holders possess considerable power to influence price movements through large-scale transactions, potentially creating amplified volatility during periods of buying or selling pressure. The limited distribution among smaller holders suggests constrained liquidity and reduced market depth, making the token more susceptible to manipulation. From a decentralization perspective, this structure contradicts the fundamental principles of distributed blockchain networks, as decision-making power and market control remain concentrated in very few hands. This concentration level warrants careful consideration by potential investors regarding liquidity risks and the potential for coordinated market actions by major stakeholders.
Click to view current ZND Holding Distribution
| Top |
Address |
Holding Qty |
Holding (%) |
| 1 |
0xcb3d...dba792 |
510083.22K |
73.52% |
| 2 |
0x7812...d657fc |
71801.02K |
10.35% |
| 3 |
0x6edf...1c5048 |
42301.99K |
6.09% |
| 4 |
0x0d07...b492fe |
12515.60K |
1.80% |
| 5 |
0xfdf5...c4ecf2 |
7682.48K |
1.10% |
| - |
Others |
49333.86K |
7.14% |
II. Core Factors Influencing ZND's Future Price
Supply Mechanism
- Dollar Index Correlation: ZND's price movement shows sensitivity to the US Dollar Index fluctuations, as the dollar's strength directly impacts cryptocurrency valuations through capital flow dynamics.
- Historical Pattern: Past episodes of dollar strengthening have typically corresponded with downward pressure on digital asset prices, while dollar weakness has often coincided with crypto market rallies.
- Current Impact: With the Federal Reserve's monetary policy stance and interest rate trajectory remaining key variables, ZND's supply-demand balance may experience volatility based on dollar movements and liquidity conditions in global markets.
Institutional and Major Holder Dynamics
- Institutional Positioning: The cryptocurrency market has witnessed increased institutional participation, though specific institutional holdings in ZND were not detailed in available materials. Broader institutional crypto adoption patterns suggest growing professional investor interest in digital assets.
- Corporate Adoption: While specific corporate adoption of ZND was not mentioned in source materials, the expanding cryptocurrency infrastructure indicates growing acceptance of digital assets in corporate treasury strategies.
- National Policy: Regulatory developments continue to shape market conditions, with government approaches to cryptocurrency regulation remaining a significant factor affecting investor confidence and market accessibility.
Macroeconomic Environment
- Monetary Policy Impact: Federal Reserve policy decisions represent a critical variable for ZND pricing. Interest rate levels, quantitative tightening or easing programs, and the central bank's balance sheet management directly influence risk asset valuations, including cryptocurrencies.
- Inflation Hedge Characteristics: Digital assets have demonstrated mixed performance as inflation hedges. During periods of elevated inflation concerns, some investors view cryptocurrencies as alternative stores of value, though this relationship varies based on broader economic conditions and market sentiment.
- Geopolitical Factors: Global economic uncertainty, geopolitical tensions, and international policy developments can drive capital flows into or out of cryptocurrency markets. Economic instability in traditional financial systems may increase digital asset appeal for some investors seeking portfolio diversification.
Technical Development and Ecosystem Construction
- Market Infrastructure Evolution: The cryptocurrency ecosystem continues developing with improvements in transaction processing, security enhancements, and scalability solutions that may benefit market participants.
- Technology Innovation: Ongoing technological advancements in blockchain infrastructure, including developments in transaction efficiency and network capabilities, contribute to the long-term viability of digital asset markets.
- Ecosystem Applications: The broader cryptocurrency ecosystem supports various decentralized applications and services, though specific ecosystem projects directly related to ZND were not detailed in available materials. Platform development and user adoption metrics remain relevant indicators for assessing long-term value potential.
III. 2026-2031 ZND Price Prediction
2026 Outlook
- Conservative Prediction: $0.0051 - $0.00879
- Neutral Prediction: $0.00879
- Optimistic Prediction: $0.01081 (requires favorable market conditions)
2027-2029 Outlook
- Market Stage Expectation: The token may experience gradual growth as adoption increases and market conditions stabilize
- Price Range Prediction:
- 2027: $0.00941 - $0.01264
- 2028: $0.00976 - $0.01156
- 2029: $0.00991 - $0.0131
- Key Catalysts: Market maturation, potential ecosystem developments, and broader cryptocurrency market trends
2030-2031 Long-term Outlook
- Baseline Scenario: $0.00759 - $0.01445 (assuming steady market conditions)
- Optimistic Scenario: $0.01241 - $0.01895 (assuming strong adoption and favorable regulatory environment)
- Transformative Scenario: Potential price appreciation up to $0.01895 (under exceptionally favorable conditions including significant partnerships and technological advancements)
- 2026-02-02: ZND showing early-stage price formation with projected average of $0.00879
| Year |
Predicted High Price |
Predicted Average Price |
Predicted Low Price |
Price Change |
| 2026 |
0.01081 |
0.00879 |
0.0051 |
0 |
| 2027 |
0.01264 |
0.0098 |
0.00941 |
11 |
| 2028 |
0.01156 |
0.01122 |
0.00976 |
27 |
| 2029 |
0.0131 |
0.01139 |
0.00991 |
29 |
| 2030 |
0.01445 |
0.01224 |
0.00759 |
39 |
| 2031 |
0.01895 |
0.01335 |
0.01241 |
51 |
IV. ZND Professional Investment Strategies and Risk Management
ZND Investment Methodology
(I) Long-term Holding Strategy
- Target Investors: Investors seeking exposure to a regulated European crypto ecosystem with patience for platform development
- Operational Recommendations:
- Consider accumulation during market corrections, given the significant decline from ATH of $0.55 to current levels around $0.0088
- Monitor ecosystem adoption metrics, particularly zondacrypto exchange activity and zondacrypto Pay merchant integration
- Storage Solution: Gate Web3 Wallet for secure ERC-20 token storage with multi-signature protection
(II) Active Trading Strategy
- Technical Analysis Tools:
- Volume Analysis: Monitor 24-hour trading volume (currently $103,261) for liquidity assessment and optimal entry/exit points
- Support/Resistance Levels: Track price movements within the established range between ATL of $0.007473 and recent highs
- Swing Trading Considerations:
- Exercise caution due to limited liquidity with only 5 exchanges listing ZND
- Consider market cap to FDV ratio of 12.63%, indicating significant token unlock potential
ZND Risk Management Framework
(I) Asset Allocation Principles
- Conservative Investors: 1-3% of crypto portfolio allocation given high volatility and early-stage ecosystem
- Aggressive Investors: 5-8% allocation with strict stop-loss discipline
- Professional Investors: Up to 10% with hedging strategies and continuous ecosystem monitoring
(II) Risk Hedging Solutions
- Position Sizing: Implement gradual entry strategies to average down costs during volatility
- Diversification: Balance ZND holdings with established crypto assets to mitigate platform-specific risks
(III) Secure Storage Solutions
- Hot Wallet Recommendation: Gate Web3 Wallet for active trading and ecosystem interaction
- Cold Storage Option: Hardware wallet solutions for long-term holdings exceeding immediate trading needs
- Security Considerations: Always verify contract address (0x2d8ea194902bc55431420bd26be92b0782dce91d) before transactions, enable two-factor authentication, and never share private keys
V. ZND Potential Risks and Challenges
ZND Market Risks
- Extreme Volatility: Price declined approximately 98.06% over one year, demonstrating significant downside potential
- Limited Liquidity: Low 24-hour trading volume and only 5 exchange listings may result in substantial slippage
- Low Market Cap: Total market capitalization of approximately $1.61 million increases susceptibility to price manipulation
ZND Regulatory Risks
- Regional Concentration: Primary focus on Central European markets may limit global adoption potential
- Evolving Compliance Requirements: Changes in European crypto regulations could impact platform operations
- Cross-border Restrictions: Regulatory barriers may affect international expansion of zondacrypto services
ZND Technical Risks
- Token Distribution: Only 12.63% of total supply currently circulating, with potential for significant dilution
- Smart Contract Dependency: As an ERC-20 token, ZND is subject to Ethereum network congestion and gas fee volatility
- Platform Integration: Token utility depends heavily on continued development and adoption of zondacrypto ecosystem services
VI. Conclusion and Action Recommendations
ZND Investment Value Assessment
ZND represents a regulated financial ecosystem centered around the established zondacrypto exchange platform operating since 2014. The token's value proposition relies on ecosystem utility across trading, payment processing, and financial services. However, significant price decline from ATH, limited circulating supply (12.63%), and concentrated liquidity present substantial short-term risks. Long-term value depends on successful user adoption, merchant integration of zondacrypto Pay, and ecosystem expansion beyond Central European markets.
ZND Investment Recommendations
✅ Newcomers: Limit initial exposure to minimal amounts for learning purposes; thoroughly research the zondacrypto ecosystem before significant investment
✅ Experienced Investors: Consider small speculative positions with strict risk parameters; monitor platform development milestones and trading volume trends
✅ Institutional Investors: Conduct comprehensive due diligence on regulatory compliance, token economics, and ecosystem partnerships before portfolio inclusion
ZND Trading Participation Methods
- Spot Trading: Available on Gate.com and 4 other exchanges with appropriate liquidity assessment
- Ecosystem Participation: Utilize ZND tokens within the zondacrypto platform for reduced fees and exclusive benefits
- Gradual Accumulation: Dollar-cost averaging strategy to mitigate entry timing risks in volatile conditions
Cryptocurrency investment carries extreme risks, and this article does not constitute investment advice. Investors should make cautious decisions based on their own risk tolerance and are advised to consult professional financial advisors. Never invest more than you can afford to lose.
FAQ
ZND is the core token of the ZND platform, enabling staking, yield farming, and loyalty programs. Users can stake ZND tokens to earn rewards and participate in platform governance and incentive mechanisms.
What is the ZND price prediction for 2024?
Based on market analysis and trends, ZND price in 2024 was projected to reach between $0.50 to $1.20. The prediction considered market momentum, adoption rates, and overall crypto market conditions during that period.
What are the main factors affecting ZND price?
ZND price is mainly influenced by market demand, trading volume, network adoption, tokenomics, macroeconomic conditions, and overall cryptocurrency market sentiment.
How to analyze ZND price trends? What are the prediction methods?
Analyze ZND price trends using moving averages and returns analysis. Common prediction methods include time series analysis, technical indicators monitoring, and machine learning models based on historical data patterns.
What advantages and risks does ZND have compared to mainstream cryptocurrencies?
ZND offers lower transaction fees and faster throughput than Bitcoin, enabling efficient payments. However, it faces higher volatility and regulatory uncertainty compared to established cryptocurrencies. ZND's institutional adoption remains limited, presenting both growth potential and execution risks in the evolving market.
What technical and fundamental indicators should be monitored for ZND price prediction?
Monitor technical indicators including K-line patterns, moving averages, and trading volume. For fundamentals, focus on token utility, adoption metrics, development progress, market sentiment, and competitive positioning in the crypto ecosystem.
* The information is not intended to be and does not constitute financial advice or any other recommendation of any sort offered or endorsed by Gate.