This comprehensive article analyzes Zenchain (ZTC), a Layer 1 blockchain hybrid platform combining Bitcoin's security with Ethereum's programmability, delivering expert price predictions and investment strategies for 2026-2031. As of January 25, 2026, trading at $0.002468 with a $12.08 million market cap, ZTC presents both significant opportunities and risks for cryptocurrency investors. The analysis covers historical price evolution, current market sentiment, holding distribution patterns, and provides forecasts ranging from conservative to optimistic scenarios. Key investment methodologies include long-term holding strategies and active trading approaches with detailed risk management frameworks. The article identifies critical challenges including high volatility, low liquidity, regulatory uncertainties, and technical risks while offering position-sizing recommendations through Gate exchange. Designed for investors at all levels, this guide balances fundamental analysis with practical trading tactics and s
Introduction: ZTC's Market Position and Investment Value
Zenchain (ZTC), positioned as a Layer 1 blockchain combining Bitcoin's security with Ethereum's programmability, has established its presence in the cryptocurrency market since its launch in 2025. As of January 25, 2026, ZTC maintains a market capitalization of approximately $12.08 million, with a circulating supply of around 4.893 billion tokens, and the price hovering at $0.002468. This asset, characterized by its hybrid consensus mechanism and native AI layer integration, is playing an increasingly significant role in enabling autonomous intelligent decentralized applications with Bitcoin-level security.
This article will comprehensively analyze ZTC's price trends from 2026 to 2031, combining historical patterns, market supply and demand dynamics, ecosystem development, and macroeconomic environment considerations to provide investors with professional price forecasts and practical investment strategies.
I. ZTC Price History Review and Market Status
ZTC Historical Price Evolution Trajectory
- 2026-01-07: Reached all-time high of $0.012675, marking a significant peak in price performance
- 2026-01-25: Touched all-time low of $0.001742, representing a notable decline from previous levels
ZTC Current Market Situation
As of January 25, 2026, ZTC is trading at $0.002468, showing a 24-hour price increase of 27.72%. The token has demonstrated an 11.28% rise over the past hour and a 9.16% gain over the past seven days. However, the 30-day performance indicates a decline of 68.70%.
The current market capitalization stands at approximately $12.08 million, with a 24-hour trading volume of $2.43 million. The circulating supply represents 4.893 billion tokens out of a maximum supply of 21 billion tokens, resulting in a circulation ratio of 23.3%. The fully diluted market cap is calculated at $51.83 million.
ZTC's market dominance is recorded at 0.0016%, ranking at position 1116 in the overall cryptocurrency market. The token has 682 holders and is currently listed on 10 exchanges. The 24-hour price range has fluctuated between $0.001742 and $0.002524.
The current market sentiment index stands at 25, indicating an "Extreme Fear" condition in the broader market environment.
Click to view the current ZTC market price

ZTC Market Sentiment Index
2026-01-25 Fear & Greed Index: 25 (Extreme Fear)
Click to view current Fear & Greed Index
The crypto market is currently experiencing extreme fear sentiment, with the Fear & Greed Index at 25. This indicates significant market anxiety and pessimistic investor outlook. During periods of extreme fear, historically volatile price swings often occur. Conservative investors typically adopt defensive strategies, while experienced traders may view this as a potential buying opportunity. It is crucial to conduct thorough research and risk assessment before making investment decisions. Remember that extreme sentiment levels often precede market reversals, but timing such turns remains challenging and unpredictable.

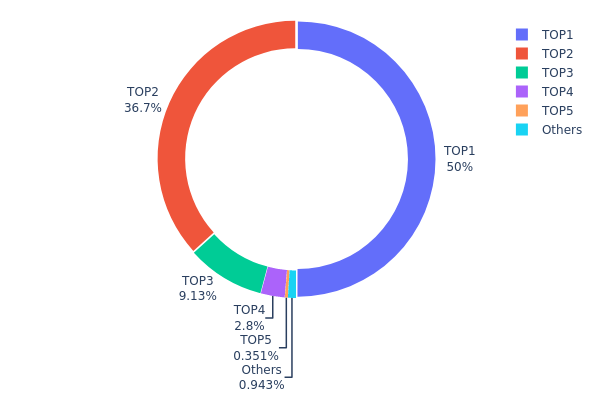
ZTC 持仓分布
Based on the current address holding distribution data, ZTC exhibits an extremely high concentration pattern. The top holder controls 50.04% of the total supply with 10.51 billion tokens, while the second-largest address holds 36.72% with 7.71 billion tokens. These two addresses alone account for 86.76% of the entire token supply, indicating a severely centralized distribution structure. The third through fifth addresses hold 9.13%, 2.79%, and 0.35% respectively, with all remaining addresses collectively holding less than 1% of the supply.
This concentration level presents significant implications for market dynamics and price stability. With nearly 87% of tokens controlled by just two addresses, ZTC's market structure faces substantial vulnerability to large-scale movements or potential manipulation risks. Such concentrated holdings typically result in reduced liquidity depth and heightened price volatility, as decisions by major holders can trigger dramatic market reactions. The limited distribution among smaller holders also suggests weak retail participation and potentially restricted trading activity on secondary markets.
From a decentralization perspective, ZTC's current address distribution reflects a highly centralized ecosystem that deviates considerably from the ideal decentralized token model. This structure may indicate early-stage project development with tokens primarily held by team members, institutional investors, or treasury allocations awaiting future distribution. While concentration itself doesn't necessarily indicate malicious intent, it does create systematic risks and reduces the project's resilience against single-point failures or coordinated sell pressure.
Click to view current ZTC Holding Distribution
| Top |
Address |
Holding Qty |
Holding (%) |
| 1 |
0x8703...f85187 |
10510114.76K |
50.04% |
| 2 |
0x44c6...fa9eca |
7712508.26K |
36.72% |
| 3 |
0xc051...e8140d |
1918166.61K |
9.13% |
| 4 |
0xc5a2...2a1695 |
587491.74K |
2.79% |
| 5 |
0x58ed...a36a51 |
73746.51K |
0.35% |
| - |
Others |
197972.12K |
0.97000000000001% |
II. Core Factors Influencing ZTC's Future Price
Based on the available information, there is currently insufficient data to provide a comprehensive analysis of the core factors that may influence ZTC's future price. The provided materials do not contain specific details regarding ZTC's supply mechanisms, institutional dynamics, macroeconomic positioning, or technological developments.
Investors interested in ZTC should conduct thorough due diligence and seek additional information from official project sources and reputable cryptocurrency research platforms before making investment decisions.
III. 2026-2031 ZTC Price Forecast
2026 Outlook
- Conservative estimate: $0.00126 - $0.00239
- Neutral estimate: $0.00239 (average market performance)
- Optimistic estimate: $0.00327 (requires favorable market conditions and increased adoption)
2027-2029 Mid-term Outlook
- Market stage expectation: Gradual growth phase with potential consolidation periods
- Price range forecast:
- 2027: $0.00181 - $0.00328 (approximately 18% increase from 2026 baseline)
- 2028: $0.00186 - $0.00412 (approximately 28% increase from 2026 baseline)
- 2029: $0.00240 - $0.00524 (approximately 50% increase from 2026 baseline)
- Key catalysts: Market maturation, technological developments, and broader ecosystem integration could drive price appreciation during this period
2030-2031 Long-term Outlook
- Baseline scenario: $0.00291 - $0.00543 (assuming steady market development and sustained project progress)
- Optimistic scenario: $0.00441 - $0.00585 (contingent on favorable regulatory environment and strong adoption metrics)
- Growth scenario: Potential for 85-106% appreciation from 2026 levels by 2031 under highly favorable conditions
- January 25, 2026: ZTC trading within initial forecast range as market participants evaluate long-term potential
| Year |
Predicted High Price |
Predicted Average Price |
Predicted Low Price |
Price Change |
| 2026 |
0.00327 |
0.00239 |
0.00126 |
0 |
| 2027 |
0.00328 |
0.00283 |
0.00181 |
18 |
| 2028 |
0.00412 |
0.00305 |
0.00186 |
28 |
| 2029 |
0.00524 |
0.00359 |
0.0024 |
50 |
| 2030 |
0.00543 |
0.00441 |
0.00291 |
85 |
| 2031 |
0.00585 |
0.00492 |
0.00261 |
106 |
IV. ZTC Professional Investment Strategy and Risk Management
ZTC Investment Methodology
(1) Long-term Holding Strategy
- Target Investors: Believers in Layer 1 blockchain innovation and Bitcoin-Ethereum hybrid architecture
- Operational Recommendations:
- Consider accumulating positions during market corrections, particularly when price approaches historical support levels
- Monitor development milestones including AI layer implementation and dApp ecosystem expansion
- Utilize Gate Web3 Wallet for secure long-term storage with multi-signature protection
(2) Active Trading Strategy
- Technical Analysis Tools:
- Volume Analysis: Monitor the 24-hour trading volume of approximately 2.43 million USDT to identify accumulation or distribution phases
- Support and Resistance Levels: Key levels include recent low at 0.001742 USDT and 24-hour high at 0.002524 USDT
- Swing Trading Points:
- Set stop-loss orders below recent support levels to manage downside risk
- Consider profit-taking strategies when approaching resistance zones, particularly given the 27.72% 24-hour gain
ZTC Risk Management Framework
(1) Asset Allocation Principles
- Conservative Investors: 1-3% of cryptocurrency portfolio
- Aggressive Investors: 5-8% of cryptocurrency portfolio
- Professional Investors: Up to 10% with active hedging strategies
(2) Risk Hedging Solutions
- Portfolio Diversification: Combine ZTC holdings with established Layer 1 assets to balance exposure to emerging blockchain technology
- Position Sizing: Given the 68.70% decline over 30 days, implement scaled entry strategies rather than lump-sum investments
(3) Secure Storage Solutions
- Hot Wallet Recommendation: Gate Web3 Wallet for active trading and staking participation
- Cold Storage Solution: Hardware wallet storage for long-term holdings exceeding trading needs
- Security Precautions: Never share private keys, enable two-factor authentication, and regularly verify contract addresses (0xa6773c4f26c80c86bc04aa6506533693a39d1195 on Ethereum)
V. ZTC Potential Risks and Challenges
ZTC Market Risks
- High Volatility: The token experienced a 68.70% decline over 30 days, indicating substantial price volatility that may continue
- Low Market Capitalization: With a circulating market cap of approximately 12 million USDT, the token is susceptible to large price swings from modest trading volumes
- Limited Liquidity: Trading across only 10 exchanges may result in wider bid-ask spreads and potential slippage during large transactions
ZTC Regulatory Risks
- EVM Compatibility Scrutiny: As regulatory frameworks evolve, smart contract platforms may face increased compliance requirements
- Cross-chain Technology Oversight: Hybrid consensus mechanisms bridging Bitcoin security with Ethereum programmability may attract regulatory examination
- Token Classification Uncertainty: Evolving regulatory definitions for utility tokens across jurisdictions may impact trading availability
ZTC Technical Risks
- Novel Architecture Risk: The hybrid consensus mechanism combining Bitcoin security with Ethereum programmability represents unproven technology at scale
- AI Layer Dependencies: The native protocol-level AI layer for fraud detection and execution optimization introduces additional technical complexity
- Smart Contract Vulnerabilities: As an EVM-compatible platform, the network inherits potential security risks associated with smart contract execution
VI. Conclusion and Action Recommendations
ZTC Investment Value Assessment
Zenchain presents an innovative approach to Layer 1 blockchain architecture, attempting to merge Bitcoin's security model with Ethereum's programmability. The native AI layer for fraud detection and adaptive network management represents a differentiated value proposition in the competitive blockchain landscape. However, the significant 30-day price decline of 68.70% and relatively low circulating supply of 23.3% indicate early-stage market dynamics with substantial volatility. The project's long-term value depends on successful implementation of its hybrid consensus mechanism and ecosystem adoption, while short-term risks include market volatility, limited liquidity, and technical execution challenges.
ZTC Investment Recommendations
✅ Beginners: Start with small position sizes not exceeding 1-2% of your cryptocurrency portfolio, focus on learning about Layer 1 blockchain technology, and avoid making investment decisions based solely on short-term price movements
✅ Experienced Investors: Consider scaled accumulation strategies during market corrections, monitor development progress and ecosystem growth metrics, and implement stop-loss orders to manage downside risk
✅ Institutional Investors: Conduct thorough due diligence on the hybrid consensus mechanism and AI layer architecture, assess liquidity conditions across multiple exchanges, and consider OTC arrangements for larger positions to minimize market impact
ZTC Trading Participation Methods
- Spot Trading: Direct purchase on Gate.com and other supporting exchanges with limit or market orders
- Dollar-Cost Averaging: Systematic periodic purchases to reduce timing risk and smooth entry prices
- Participation in Ecosystem: Monitor opportunities to engage with ZenChain's dApp ecosystem as it develops
Cryptocurrency investment carries extremely high risk, and this article does not constitute investment advice. Investors should make cautious decisions based on their own risk tolerance and are advised to consult professional financial advisors. Never invest more than you can afford to lose.
FAQ
What factors influence ZTC price movements and how can they be analyzed for predictions?
ZTC price movements are influenced by market demand, trading volume, ecosystem developments, regulatory news, and overall crypto market sentiment. Analyze historical price data, trading trends, and fundamental metrics to identify patterns and make informed predictions.
What historical price patterns and trends has ZTC shown, and what do technical analysts predict for the future?
ZTC has demonstrated cyclical volatility patterns with periodic consolidation phases. Technical analysts identify strong support levels and bullish divergences on longer timeframes. Chart patterns suggest potential upward momentum, with resistance targets indicating possible price appreciation in the coming months based on current market structure analysis.
What are the risks and limitations of ZTC price prediction models, and how reliable are different forecasting methods?
ZTC price predictions use technical analysis, machine learning, and market data. Technical models rely on historical patterns, while ML models adapt to market changes. Reliability varies by method—technical analysis suits short-term trends, machine learning captures complex patterns. Limitations include market volatility, black swan events, and data quality issues. No model guarantees accuracy.
How does ZTC's market capitalization and trading volume affect its price volatility and predictability?
Higher market cap and trading volume generally reduce ZTC's price volatility by providing better liquidity and market stability. Increased trading activity improves price predictability through clearer market trends and stronger technical signals for analysis.
What is the difference between short-term and long-term ZTC price predictions, and which is more reliable?
Short-term predictions focus on price movements within days or weeks, highly volatile and influenced by market sentiment. Long-term predictions analyze fundamental trends over months or years, generally more reliable as they reflect actual adoption and utility growth of ZTC.
* The information is not intended to be and does not constitute financial advice or any other recommendation of any sort offered or endorsed by Gate.