This comprehensive comparison examines AIN versus LINK across multiple investment dimensions to help cryptocurrency investors make informed decisions. AIN, launched in 2025, represents emerging blockchain infrastructure for agent-driven development with $0.04 current pricing, while LINK, established since 2017, operates as a decentralized oracle network at $9.60. The article analyzes historical price trends, tokenomics, institutional adoption, technical ecosystems, and price forecasts through 2031. With AIN showing 68% upside potential and LINK 70% by 2031, conservative investors should favor LINK (70-80% allocation), while experienced investors may diversify strategically. Both assets require ongoing regulatory monitoring and comprehensive due diligence before allocation decisions.
Introduction: AIN vs LINK Investment Comparison
In the cryptocurrency market, the comparison between AIN and LINK remains a topic investors cannot overlook. Both exhibit notable differences in market cap ranking, application scenarios, and price performance, representing distinct positioning within the crypto asset landscape.
AIN (Infinity Ground): Launched in 2025, AIN has gained market recognition as a blockchain infrastructure designed for Vibe Coders, enabling an agent-driven development environment. The platform features a decentralized agentic IDE that allows users to build DApps using natural language without coding requirements, alongside an AI App Store and the ING Network. In early 2025, Infinity Ground secured $2 million in seed funding from investors including Animoca Brands, Frachtis Ventures, and MarbleX.
LINK (ChainLink): Since its launch in 2017, LINK has established itself as a decentralized oracle network solution. As an ERC-20 token on the Ethereum blockchain, LINK facilitates payments to Chainlink node operators for data retrieval, formatting, off-chain computation, and uptime guarantees. The token serves as an integral component in preventing malicious actors within the node network.
This article examines the investment value comparison between AIN and LINK across multiple dimensions: historical price trends, supply mechanisms, institutional adoption, technical ecosystems, and future projections, addressing investors' primary question:
"Which presents better investment potential under current market conditions?"
I. Historical Price Comparison and Current Market Status
AIN (Coin A) and LINK (Coin B) Historical Price Trends
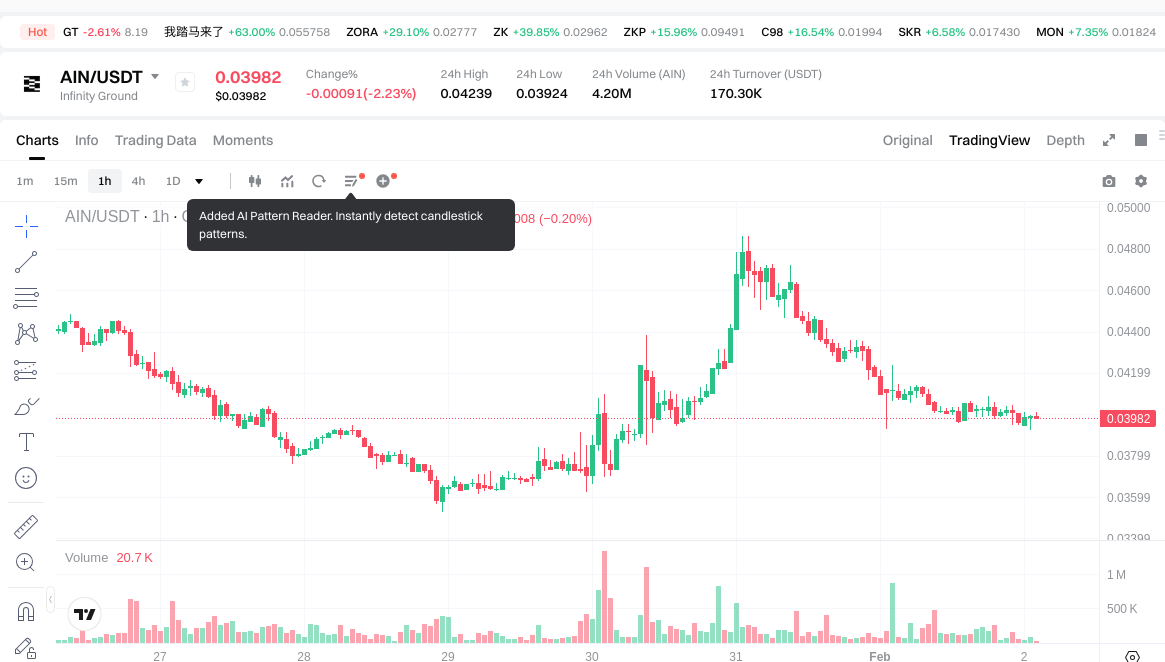
- 2025: AIN launched in July 2025 with an initial price of approximately $0.015, reaching a peak of $0.216 on July 11, 2025, representing significant growth in its early trading period.
- 2021: LINK experienced notable volatility, reaching its historical high of $52.70 on May 10, 2021, during a period of heightened interest in decentralized oracle networks and DeFi applications.
- Comparative Analysis: During the recent market cycle, AIN dropped from its peak of $0.216 to a low of $0.015, while LINK declined from its all-time high of $52.70 to current levels around $9.60, showing both assets have experienced substantial corrections from their respective peaks.
Current Market Conditions (2026-02-02)
- AIN Current Price: $0.04004
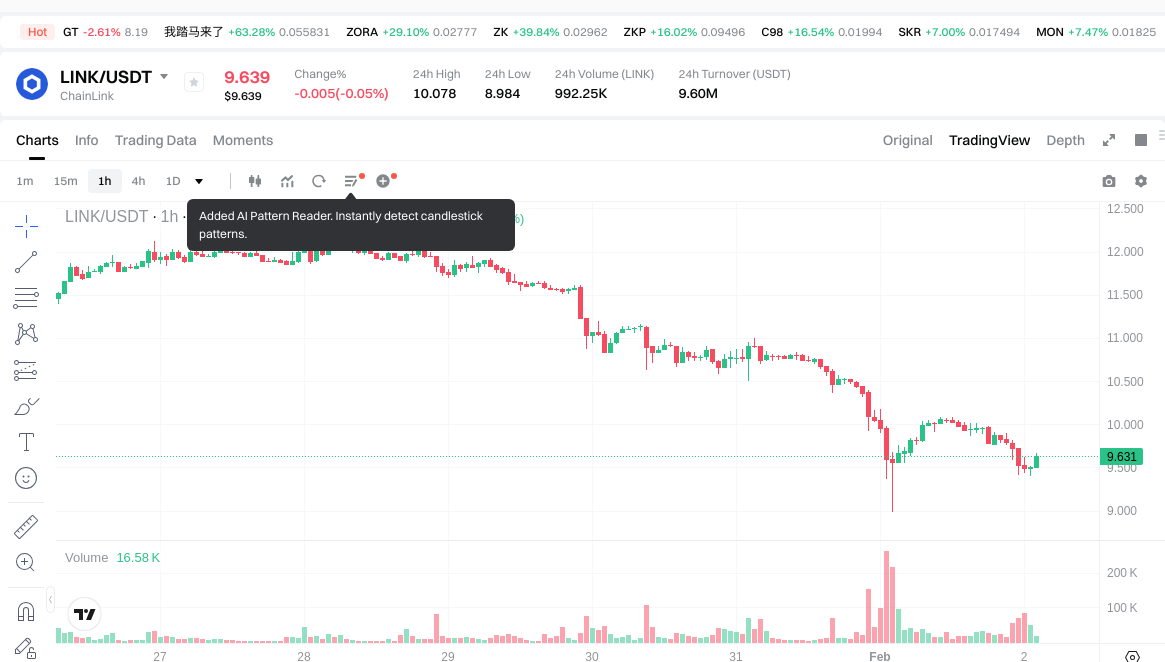
- LINK Current Price: $9.598
- 24-hour Trading Volume: AIN $170,436.65 vs LINK $9,605,179.07
- Market Sentiment Index (Fear & Greed Index): 14 (Extreme Fear)
Check Real-time Prices:
II. Core Factors Influencing AIN vs LINK Investment Value
Supply Mechanism Comparison (Tokenomics)
- AIN: Specific supply mechanism details are not available in the reference materials.
- LINK: The materials indicate institutional interest with addresses holding 100,000-1,000,000 LINK recently accumulating 2.5 million tokens, valued over $61 million, suggesting long-term confidence from major holders.
- 📌 Historical Pattern: Supply dynamics and holder behavior patterns may influence price cycles, though specific tokenomics frameworks require further research.
Institutional Adoption and Market Application
- Institutional Holdings: Recent data shows significant institutional accumulation in LINK, with whale addresses (100,000-1,000,000 LINK) increasing positions by 2.5 million tokens worth over $61 million, indicating strong institutional preference.
- On-Chain Activity: LINK has experienced a surge in on-chain activity, reflecting growing network utilization and user engagement.
- Enterprise Adoption: Comparative data on cross-border payments, settlement systems, and investment portfolio applications between AIN and LINK is limited in available materials.
- Regulatory Landscape: Country-specific regulatory stances toward both assets remain under-documented in current references.
Technology Development and Ecosystem Building
- AIN Technology Upgrades: Specific technical developments and their potential impacts are not covered in the reference materials.
- LINK Technology Development: While not detailed in the materials, increased on-chain activity suggests ongoing ecosystem engagement and potential technical utilization.
- Ecosystem Comparison: Comprehensive analysis of DeFi, NFT, payment systems, and smart contract implementations for both assets requires additional data beyond current materials.
Macroeconomic Environment and Market Cycles
- Inflation Hedge Properties: Comparative anti-inflation attributes between AIN and LINK are not substantiated in available references.
- Monetary Policy Impact: Effects of interest rates, dollar index fluctuations, and broader monetary policy on both assets require further market analysis.
- Geopolitical Factors: Cross-border transaction demand and international situation impacts on AIN and LINK valuation remain areas for additional research.
- Market Sentiment: Historical volatility patterns and market sentiment indicators influence future price projections for both assets, though specific comparative data points are limited in current materials.
III. 2026-2031 Price Forecast: AIN vs LINK
Short-term Forecast (2026)
- AIN: Conservative $0.031-$0.040 | Optimistic $0.040-$0.043
- LINK: Conservative $7.28-$9.58 | Optimistic $9.58-$11.98
Mid-term Forecast (2028-2029)
- AIN may enter a consolidation phase with projected price range of $0.033-$0.063
- LINK may enter an expansion phase with projected price range of $11.23-$16.64
- Key drivers: institutional capital inflows, ETF developments, ecosystem growth
Long-term Forecast (2031)
- AIN: Baseline scenario $0.063-$0.067 | Optimistic scenario $0.067-$0.087
- LINK: Baseline scenario $12.09-$16.12 | Optimistic scenario $16.12-$18.38
View detailed price predictions for AIN and LINK
Disclaimer
AIN:
| Year |
Predicted High Price |
Predicted Average Price |
Predicted Low Price |
Price Change |
| 2026 |
0.0431568 |
0.03996 |
0.0307692 |
0 |
| 2027 |
0.044051904 |
0.0415584 |
0.034909056 |
3 |
| 2028 |
0.06335162496 |
0.042805152 |
0.03253191552 |
6 |
| 2029 |
0.0567938756736 |
0.05307838848 |
0.0350317363968 |
32 |
| 2030 |
0.07965739151136 |
0.0549361320768 |
0.037905931132992 |
37 |
| 2031 |
0.086812822714363 |
0.06729676179408 |
0.062585988468494 |
68 |
LINK:
| Year |
Predicted High Price |
Predicted Average Price |
Predicted Low Price |
Price Change |
| 2026 |
11.97625 |
9.581 |
7.28156 |
1 |
| 2027 |
15.84457875 |
10.778625 |
7.00610625 |
13 |
| 2028 |
16.63950234375 |
13.311601875 |
11.58109363125 |
40 |
| 2029 |
16.173596278125 |
14.975552109375 |
11.23166408203125 |
58 |
| 2030 |
16.6647943873125 |
15.57457419375 |
9.5004902581875 |
64 |
| 2031 |
18.376440091205625 |
16.11968429053125 |
12.089763217898437 |
70 |
IV. Investment Strategy Comparison: AIN vs LINK
Long-term vs Short-term Investment Strategies
- AIN: May appeal to investors focused on emerging blockchain infrastructure and agent-driven development platforms, particularly those with higher risk tolerance for early-stage projects
- LINK: May suit investors seeking exposure to established decentralized oracle networks with demonstrated institutional adoption and enterprise integration
Risk Management and Asset Allocation
- Conservative Investors: AIN 20-30% vs LINK 70-80%
- Aggressive Investors: AIN 40-50% vs LINK 50-60%
- Hedging Tools: Stablecoin allocation, options strategies, cross-asset portfolio diversification
V. Potential Risk Comparison
Market Risk
- AIN: Higher volatility exposure given recent launch in July 2025, limited historical price data, and lower 24-hour trading volume ($170,436.65) compared to LINK
- LINK: Subject to broader cryptocurrency market cycles, though benefits from higher liquidity with 24-hour trading volume of $9,605,179.07 and established market presence since 2017
Technical Risk
- AIN: Scalability considerations for agent-driven IDE platform, network stability during early adoption phases
- LINK: Node operator distribution, smart contract security considerations inherent to decentralized oracle networks
Regulatory Risk
- Global regulatory developments may impact both assets differently based on their functional classifications—AIN as blockchain infrastructure and LINK as oracle network solution—though specific jurisdictional stances require ongoing monitoring
VI. Conclusion: Which Is the Better Buy?
📌 Investment Value Summary:
- AIN Advantages: Early-stage positioning in agent-driven development infrastructure, secured $2 million seed funding from notable investors including Animoca Brands, innovative natural language DApp building approach
- LINK Advantages: Established market presence since 2017, recent institutional accumulation of 2.5 million tokens valued over $61 million, demonstrated on-chain activity surge, proven decentralized oracle network utility
✅ Investment Recommendations:
- New Investors: Consider beginning with LINK exposure given its established market position, higher liquidity, and demonstrated institutional confidence, while maintaining limited allocation to emerging assets
- Experienced Investors: May evaluate portfolio diversification between both assets based on individual risk parameters, with higher LINK weighting balanced by selective AIN exposure for growth potential
- Institutional Investors: Recent data showing significant LINK accumulation by whale addresses suggests continued institutional preference, though comprehensive due diligence on both assets' technical frameworks and regulatory positioning remains essential
⚠️ Risk Disclosure: Cryptocurrency markets exhibit extreme volatility. This content does not constitute investment advice.
VII. FAQ
Q1: What is the current price difference between AIN and LINK?
As of February 2, 2026, AIN trades at $0.04004 while LINK trades at $9.598, representing a substantial price differential of approximately 240x. This difference reflects their distinct market positioning—AIN as an emerging blockchain infrastructure launched in July 2025, versus LINK as an established decentralized oracle network operating since 2017. The 24-hour trading volume also shows significant disparity, with LINK recording $9,605,179.07 compared to AIN's $170,436.65, indicating vastly different liquidity levels and market adoption stages.
Q2: Which asset shows stronger institutional interest?
LINK demonstrates significantly stronger institutional interest based on recent on-chain data. Whale addresses holding 100,000-1,000,000 LINK have accumulated 2.5 million tokens valued over $61 million, indicating sustained institutional confidence. Additionally, LINK has experienced a surge in on-chain activity, reflecting growing network utilization. While AIN secured $2 million in seed funding from notable investors including Animoca Brands, Frachtis Ventures, and MarbleX, this represents early-stage venture investment rather than the large-scale accumulation patterns observed in LINK's institutional holder behavior.
Q3: What are the projected price ranges for AIN and LINK by 2031?
According to long-term forecasts, AIN's baseline scenario projects a price range of $0.063-$0.067 by 2031, with an optimistic scenario reaching $0.067-$0.087. LINK's baseline scenario forecasts $12.09-$16.12, with optimistic projections of $16.12-$18.38 by 2031. These projections reflect a 68% potential increase for AIN and a 70% potential increase for LINK from current levels under optimistic conditions. However, these forecasts remain subject to numerous variables including market cycles, technological developments, institutional adoption rates, and broader macroeconomic conditions.
Q4: How should conservative versus aggressive investors allocate between AIN and LINK?
For conservative investors, a recommended allocation strategy favors LINK at 70-80% versus AIN at 20-30%, prioritizing the established market presence, higher liquidity, and demonstrated institutional confidence of LINK while maintaining limited exposure to AIN's early-stage growth potential. Aggressive investors may consider a more balanced approach of 40-50% AIN versus 50-60% LINK, accepting higher volatility in exchange for potentially greater upside from AIN's emerging infrastructure positioning. Both strategies should incorporate hedging tools including stablecoin allocation, options strategies, and cross-asset portfolio diversification to manage cryptocurrency market volatility.
Q5: What are the primary technical differences between AIN and LINK?
AIN operates as blockchain infrastructure designed for agent-driven development, featuring a decentralized agentic IDE that enables users to build DApps using natural language without coding requirements, alongside an AI App Store and the ING Network. This positions AIN as a development platform focused on accessibility and natural language interaction. LINK functions as a decentralized oracle network solution, operating as an ERC-20 token on the Ethereum blockchain that facilitates payments to Chainlink node operators for data retrieval, formatting, off-chain computation, and uptime guarantees. LINK's architecture focuses on connecting smart contracts with external data sources, serving as critical infrastructure for DeFi applications and enterprise blockchain implementations.
Q6: What are the key risk factors investors should consider for each asset?
AIN presents higher volatility exposure given its recent launch in July 2025, limited historical price data, and significantly lower trading volume compared to LINK. Additional considerations include scalability of the agent-driven IDE platform and network stability during early adoption phases. LINK faces market cycle risks common to established cryptocurrencies, though benefits from higher liquidity and proven utility. Technical considerations include node operator distribution and smart contract security inherent to decentralized oracle networks. Both assets face regulatory risk, with potential differential impacts based on their functional classifications—AIN as blockchain infrastructure versus LINK as oracle network solution—requiring ongoing monitoring of jurisdictional regulatory developments.
Q7: How have historical price movements compared between AIN and LINK?
AIN launched in July 2025 at approximately $0.015, reaching a peak of $0.216 on July 11, 2025, before declining to current levels around $0.04004—representing a correction from its early peak. LINK achieved its all-time high of $52.70 on May 10, 2021, during heightened interest in decentralized oracle networks and DeFi applications, subsequently declining to current levels around $9.60. Both assets have experienced substantial corrections from their respective peaks, though LINK's price history spans a significantly longer period (since 2017) compared to AIN's limited trading history. The current market sentiment index shows 14 (Extreme Fear), indicating broader cryptocurrency market caution that affects both assets.
Q8: What factors should new versus experienced investors prioritize when choosing between AIN and LINK?
New investors should prioritize LINK given its established market position since 2017, higher liquidity with 24-hour trading volume exceeding $9.6 million, demonstrated institutional confidence through recent whale accumulation, and proven utility in decentralized oracle networks. This provides a foundation for cryptocurrency exposure while minimizing risks associated with early-stage projects. Experienced investors may evaluate portfolio diversification opportunities, balancing LINK's stability with selective AIN exposure for potential growth, based on individual risk parameters and understanding of blockchain infrastructure development cycles. Both investor categories should conduct comprehensive due diligence on technical frameworks, regulatory positioning, and market dynamics before allocation decisions.
* The information is not intended to be and does not constitute financial advice or any other recommendation of any sort offered or endorsed by Gate.