This comprehensive guide equips cryptocurrency traders with essential knowledge to master reversal candlestick patterns in volatile digital asset markets. The article distinguishes critical concepts including reversal versus retracement, bullish and bearish patterns, and strongest indicators like hammer, shooting star, and engulfing formations. By examining body size, wicks, trading volume, and market sentiment, traders learn to identify genuine trend reversals that signal profitable turning points. The guide integrates practical strategies for pattern recognition across different timeframes, emphasizing how to confirm signals with technical indicators and establish proper risk management through stop loss and take profit placement. Whether trading on Gate or analyzing broader market conditions, understanding these patterns combined with volume analysis and support/resistance levels enables traders to anticipate market transitions and optimize decision-making in cryptocurrency trading environments.
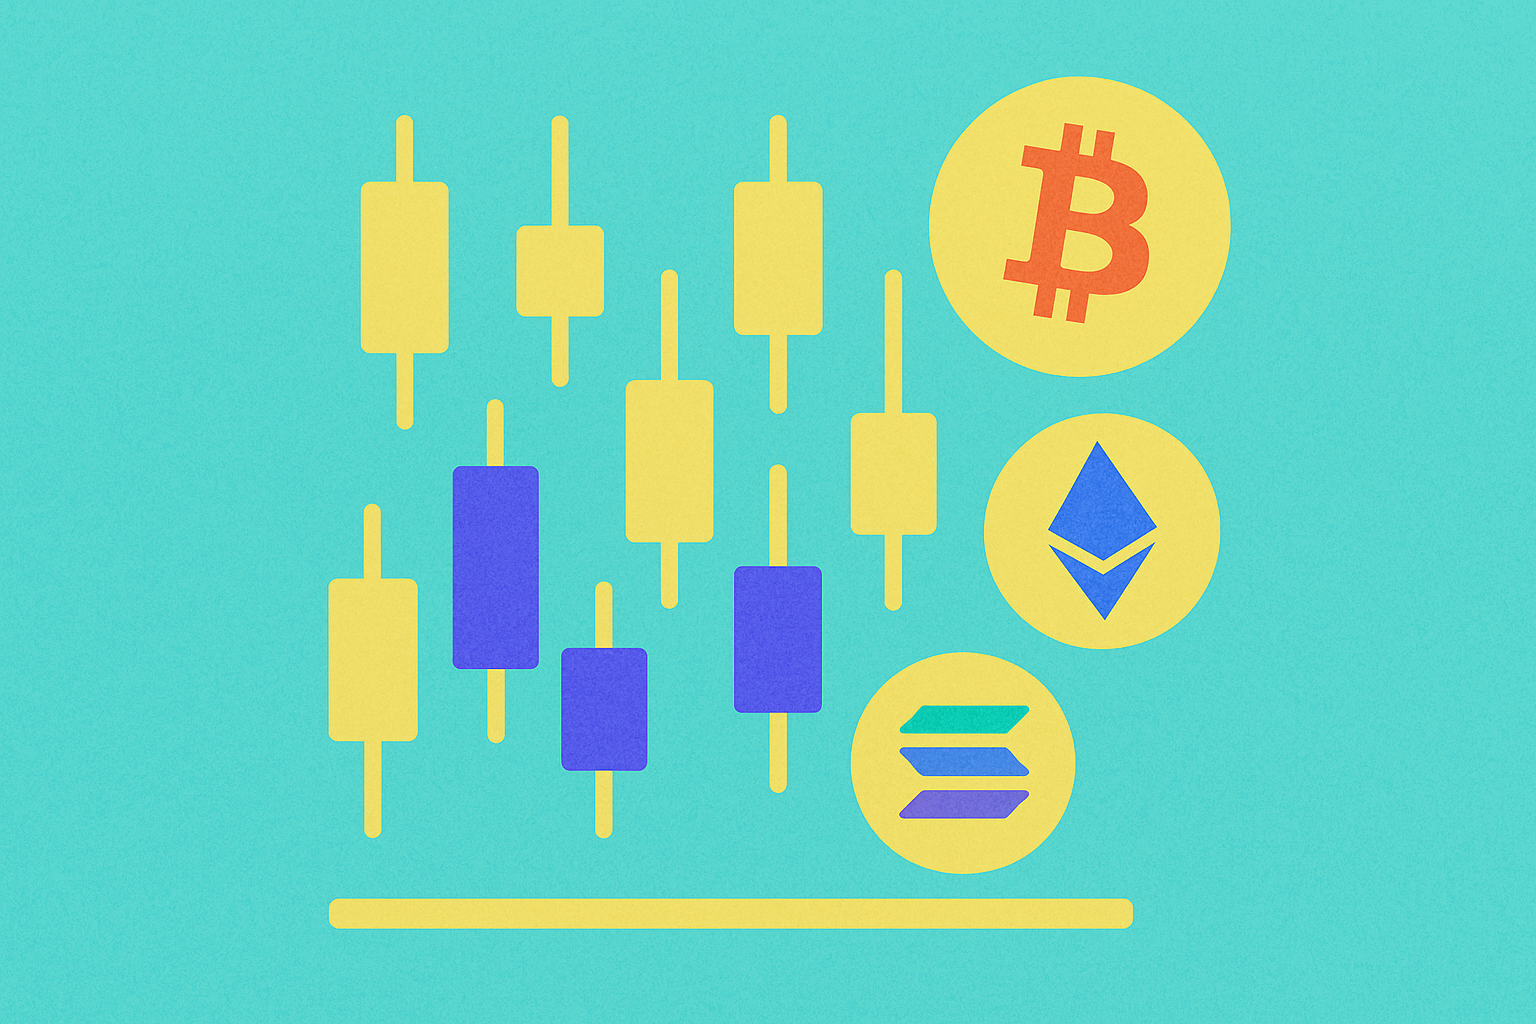
Reversal Candle Patterns
While trading candlestick patterns can seem deceptively simple at a glance, discovering and utilizing these patterns appropriately requires substantial back-testing and comprehensive analysis. In cryptocurrency markets, most candlestick patterns fall into two primary categories: continuation patterns and reversal patterns. While continuation patterns signal the persistence of the prevailing trend, reversal patterns indicate that the market could be approaching a significant turning point.
Traders consistently seek formations that offer the highest probability of generating profits. Several critical aspects must be considered when attempting to achieve consistent gains, including implementing low-risk setups and identifying crucial patterns within market data. A reversal candle represents many of these essential elements, making it an incredibly powerful signal for cryptocurrency traders to recognize and act upon.
Trend reversals are a common occurrence in technical analysis, manifesting through various types of reversal candlestick formations. These include the harami, abandoned baby, Doji, sushi roll, and numerous other patterns. However, reversal candle patterns can also be significantly influenced by market sentiment, which represents the collective opinion and emotional state of market participants.
Market sentiment, while not an entirely tangible or directly quantifiable metric, is extensively studied by investors to better predict future price movements. The enthusiasm or fear surrounding a particular project can dramatically impact its price trajectory, providing traders with a more nuanced understanding of the asset's demand dynamics. This deeper comprehension helps forecast market trends more accurately. Nevertheless, while analysts leverage sentiment analysis to assess the future direction of digital asset markets, favorable sentiment alone does not guarantee bullish price movements.
Reversal vs. Retracement
Identifying a genuine trend reversal can protect investors from substantial losses and simultaneously alert them to profitable buying opportunities. However, to fully capitalize on these benefits, it is crucial to understand the fundamental difference between a trend reversal and a retracement, as confusing the two can lead to costly trading mistakes.
A retracement is typically observed when trend movements are analyzed over longer timeframes. Retracements may persist for one to two weeks, representing temporary price corrections within the broader trend. In contrast, genuine trend reversals can extend for months or even years, fundamentally altering the market's directional bias. During a retracement, analysts usually observe intense trading volumes that push the market back toward the prevailing trend, as investors actively buy the dip, viewing it as a temporary discount.
During a trend reversal, however, trading volumes often decline significantly, and this reduced participation causes prices to establish new lows in a downtrend or new highs in an uptrend. The psychological shift underlying a reversal is more profound than that of a retracement, as it reflects a fundamental change in market participants' long-term outlook rather than a temporary profit-taking or bargain-hunting behavior.
Bullish vs Bearish Reversal Candlestick Patterns
Reversal candlestick patterns can be systematically categorized into bullish and bearish patterns, each serving distinct purposes in technical analysis and trading strategy development.
Bullish reversal patterns emerge when the prevailing trend is bearish, and the candlestick formation represents an incoming bullish reversal. These patterns signal that buying pressure is beginning to overcome selling pressure, potentially marking the end of a downtrend. For example, the piercing line pattern is a prominent bullish pattern that signals the reversal of an existing bearish trend over two consecutive trading days. During the first day, the chart exhibits a long red candle reflecting continued selling pressure. After the market opens at a new low the following day, it rallies significantly to close above the midpoint of the first day's red candle body, demonstrating that buyers have regained control.
Bearish reversal patterns occur during a prevailing bullish uptrend and signal that bears are retaking control over the market, potentially ending the upward momentum. For instance, the dark cloud cover reversal pattern, similar in structure to the piercing line but opposite in implication, is a bearish pattern that develops over two consecutive days. The first candle continues the uptrend with a long green candle, reflecting sustained buying interest. However, after opening the next day at a new high, the market produces a long red candle that closes below the midpoint of the previous day's candle, indicating that sellers have overwhelmed buyers.
Bullish Harami Pattern
A bullish harami reversal pattern can be identified when a small green candlestick is completely contained within the range of a longer preceding red candlestick. In other words, when a modest upward price movement occurs within the context of a larger downward trend, it suggests a potential bullish reversal may be forming. This pattern indicates that selling pressure is diminishing and buyers are beginning to establish a foothold.
The term "harami" is derived from the Japanese word for pregnant, aptly referring to the visual appearance of the two candles positioned next to each other, where the smaller candle appears to be "inside" the larger one. The bullish harami suggests market indecision and potential exhaustion of the downtrend, making it a valuable signal for traders considering long positions.
Bearish Harami Pattern
A bearish harami pattern is formed when a smaller red candlestick appears following a longer green candlestick, warning investors of a potential price decline ahead. This formation indicates that the bullish momentum is waning and sellers may be preparing to take control of the market.
Consistent with the bullish harami structure, the second candle in a bearish harami is typically never larger than 25% of the first candle's body. This size relationship is crucial for pattern validation. The bearish harami suggests that buyers are losing conviction and that the uptrend may be reaching exhaustion, prompting cautious traders to consider taking profits or initiating short positions.
Sushi Roll Reversal Pattern
The sushi roll pattern comprises the most recent ten candlesticks on a technical chart and can be indicative of a significant market reversal. To properly identify a sushi roll pattern, traders divide the ten candlesticks into two equal groups of five consecutive candles each, then compare the trading ranges of these two groups.
The term "sushi roll" was first introduced in the book "The Logical Trader" by British writer Mark Fischer, as the pattern's appearance resembles an actual sushi roll when visualized on a chart. The pattern generates clear trading signals: if the last five candles collectively close lower than the previous five candles, it produces a sell signal, indicating bearish momentum. Conversely, if the second set of five candles closes higher than its preceding set, it generates a buy signal, suggesting bullish momentum. The appearance of this pattern during a prevalent trend often indicates an imminent reversal, making it particularly valuable for swing traders and position traders.
Abandoned Baby Pattern
The abandoned baby pattern involves three distinct candlesticks and is widely recognized as a common sign of a potential incoming reversal. This relatively rare pattern carries significant weight when it appears. The first candle moves within the context of either a downtrend or an uptrend, establishing the prevailing market direction. This is followed by a Doji candle, characterized by opening and closing prices that are nearly equal, indicating market indecision and equilibrium between buyers and sellers.
The third candle is generally a tall candle moving decisively in the opposite direction of the first candle, confirming the reversal. A critical characteristic of this pattern is that neither the wicks nor the bodies of these three candles overlap with each other, creating visible gaps that emphasize the dramatic shift in market sentiment. This separation reinforces the pattern's reliability as a reversal signal.
What Are the Strongest Reversal Candlestick Patterns?
Reversal candlestick patterns can signal a trend inversion, but traders must remain vigilant as these patterns sometimes generate false positives or represent minor reversals that lack significance in the broader market context. However, certain patterns have proven to be particularly reliable and are crucial to monitor, as they often provide strong signals of an incoming substantial reversal within the market.
The Hammer
The hammer reversal pattern typically occurs at the nadir of a downtrend and is widely regarded as one of the strongest bullish reversal candlestick patterns in technical analysis. For this pattern to form properly, the asset must create a new low during the trading period before surging higher within the same timeframe to close near or above the price at which it opened, demonstrating a rejection of lower prices.
Hammer patterns characteristically have a small body positioned at the upper end of the trading range and a long lower wick that is at least twice the length of the body. This structure visually resembles a hammer, hence the name. The long lower wick represents aggressive buying that pushed prices back up after sellers drove them down. High trading volume accompanying this pattern serves as a positive confirmation signal that a genuine reversal may be developing, as it indicates strong buying interest at lower price levels.
Shooting Star
In direct contrast to the hammer pattern, the shooting star pattern occurs at the peak of an uptrend, making it a bearish reversal signal. The shooting star is a clear sign of bullish exhaustion, indicating that buyers have lost their momentum and sellers are beginning to gain control. The candle invariably has a small body starting from or near the day's low, coupled with a long upper wick that extends significantly above the body.
The long upper wick demonstrates that while buyers attempted to push prices higher during the session, sellers ultimately overwhelmed them and drove prices back down toward the opening level. Experienced traders typically wait for the subsequent candle after a shooting star appears before committing to their positions, as confirmation is essential. The pattern gains validation when the next candle closes in the red, confirming that sellers have indeed taken control of the market.
Engulfing Candlestick Pattern
The engulfing candlestick patterns constitute a family of powerful bullish and bearish reversal patterns that are defined by two consecutive candles signaling a dramatic reversal of the prevailing trend. These patterns are among the most reliable reversal signals due to their clear visual structure and strong implications.
The bullish engulfing pattern typically appears at the bottom of a downtrend, where it signals potential trend exhaustion. The pattern begins with a first candle that has a short body and relatively small wicks, continuing the downward movement. This is immediately followed by a large green candle whose body completely engulfs or overwhelms the entire body of the previous red candle, demonstrating that buyers have aggressively taken control.
Bearish engulfing patterns operate on similar principles but appear at the top of an uptrend. The first candle presents a short green body, reflecting the continuation of the upward trend. This is followed by an overwhelming red candle whose body completely engulfs the previous green candle. In both variations of engulfing patterns, it is critical that the closing price of the second candle completely negates the progress made by the previous candle, as this demonstrates a decisive shift in market control.
Doji Candlestick Pattern
Doji candlesticks appear when a candle's opening and closing prices are roughly identical or very close together, with long wicks typically protruding from either end of the minimal body. Dojis represent market indecision and equilibrium, where neither buyers nor sellers could establish clear control during the trading period. The wicks extending from the small body represent the highest and lowest prices reached during the session, showing that while prices moved significantly in both directions, they ultimately settled near where they started.
The appearance of a standard Doji is not automatically a reversal signal in and of itself, as it primarily indicates indecision. However, certain specific Doji variations carry stronger reversal implications. For example, the Dragonfly Doji, where the candle's high, low, and opening prices are virtually the same with a long lower wick extending downward, can be a particularly strong indicator of a bullish market reversal. The Dragonfly Doji is especially representative of aggressive selling pressure that was ultimately rejected, with most experienced traders placing their buy orders after the following candle confirms the bullish reversal pattern through a strong green close.
Hanging Man Candlestick Pattern
The hanging man pattern appears at the top of a bullish trend, classifying it as a bearish reversal pattern that warns of potential trouble ahead. It typically occurs after an extended upward trend as a cautionary signal that bulls are losing their momentum and control over price direction. While the hanging man is not necessarily an immediate indicator of a complete trend change, it does send a clear message that the price has likely touched a market top or significant resistance level.
The hanging man characteristically shows up when the market has experienced a sustained uptrend, and is visually depicted by a candle with a small body positioned at the upper end of the trading range and a long lower wick that extends at least twice the length of the body. There is usually minimal or no upper wick present.
This pattern indicates that while buyers initially maintained control and pushed prices higher at the open, significant selling pressure emerged during the session, driving prices substantially lower. Although buyers managed to recover some ground and push prices back up toward the opening level by the close, the initial sell-off can be a telling sign of increasing market sentiment that the price has peaked. The long lower wick represents a warning that sellers are becoming more aggressive and that the balance of power may be shifting from buyers to sellers.
Conclusion
Successful investment requires a comprehensive palette of strategies that investors can skillfully blend and adapt to optimize their trading decisions across various market conditions. While some technical analysis techniques may primarily serve the purposes of active day traders seeking quick profits, other approaches might prove more suitable for long-term investors focused on sustained growth and capital preservation.
Because cryptocurrency markets are characterized by extreme volatility, price movements can sometimes appear random or disconnected from fundamental factors. However, it is essential to understand that genuine trend reversals are not arbitrary occurrences. Rather, they are backed by measurable shifts in investor psychology, evolving market sentiment, and concrete technical indicators that can be identified and analyzed.
By mastering the recognition and interpretation of reversal candlestick patterns, traders equip themselves with powerful tools to anticipate market turning points, manage risk more effectively, and capitalize on profitable opportunities that emerge during trend transitions. The key to success lies in combining pattern recognition with comprehensive market analysis, proper risk management, and disciplined execution of trading strategies.
FAQ
What are reversal candles? What are common reversal candle patterns such as hammer, inverted hammer, and engulfing patterns?
Reversal candles signal trend changes. Common patterns include hammer (small body, long lower wick), inverted hammer (small body, long upper wick), engulfing (large candle engulfs previous smaller one), and shooting star (long upper wick, small body). These formations indicate potential price direction shifts and are key technical analysis tools.
How to identify and read reversal candle signals? What key elements should be noted such as body size, wicks, and trading volume?
Identify reversal candles by examining body size, upper/lower wicks, and trading amount. Small bodies with long wicks indicate indecision. Large body reversals signal strong momentum shifts. High trading amount confirms reversal strength. Hammer and shooting star patterns are key reversal indicators at support/resistance levels.
What are the application strategies for reversal candles in actual trading? How to combine other technical indicators to confirm signals?
Reversal candles signal trend changes when combined with support/resistance levels, volume analysis, and moving averages. Use RSI or MACD to confirm oversold/overbought conditions. Validate with multiple indicators before entering trades for higher probability setups.
What are the risk management methods in reversal candle trading? How to set stop loss and take profit?
Set stop loss below support levels to limit losses. Place take profit at resistance zones. Use position sizing—risk only 1-2% per trade. Combine moving averages for confirmation. Trail stops as price moves favorably. Monitor volume surges for entry validation.
What are the differences in reliability of reversal candle signals across different timeframes (daily, hourly, minute)?
Daily timeframes offer highest reliability with stronger trends and less noise. Hourly timeframes provide moderate reliability for swing trading. Minute timeframes are most susceptible to false signals and noise, requiring confirmation from multiple indicators for better accuracy.
How to distinguish true reversal signals from false breakouts? What are common situations where reversal candles fail?
True reversals show strong volume confirmation and price rejection at key levels, while false breakouts lack volume support and quickly reverse. Reversal candles fail in trending markets without resistance zones, during low liquidity periods, and when ignoring broader market context. Combine candle patterns with support/resistance levels and trading volume for accuracy.
In trending markets, reversal candles are more reliable as they signal potential trend changes with stronger confirmation. In ranging markets, they occur frequently but are less significant, often triggering false signals. Reversal candles work best when combined with support/resistance levels and volume analysis.
* The information is not intended to be and does not constitute financial advice or any other recommendation of any sort offered or endorsed by Gate.