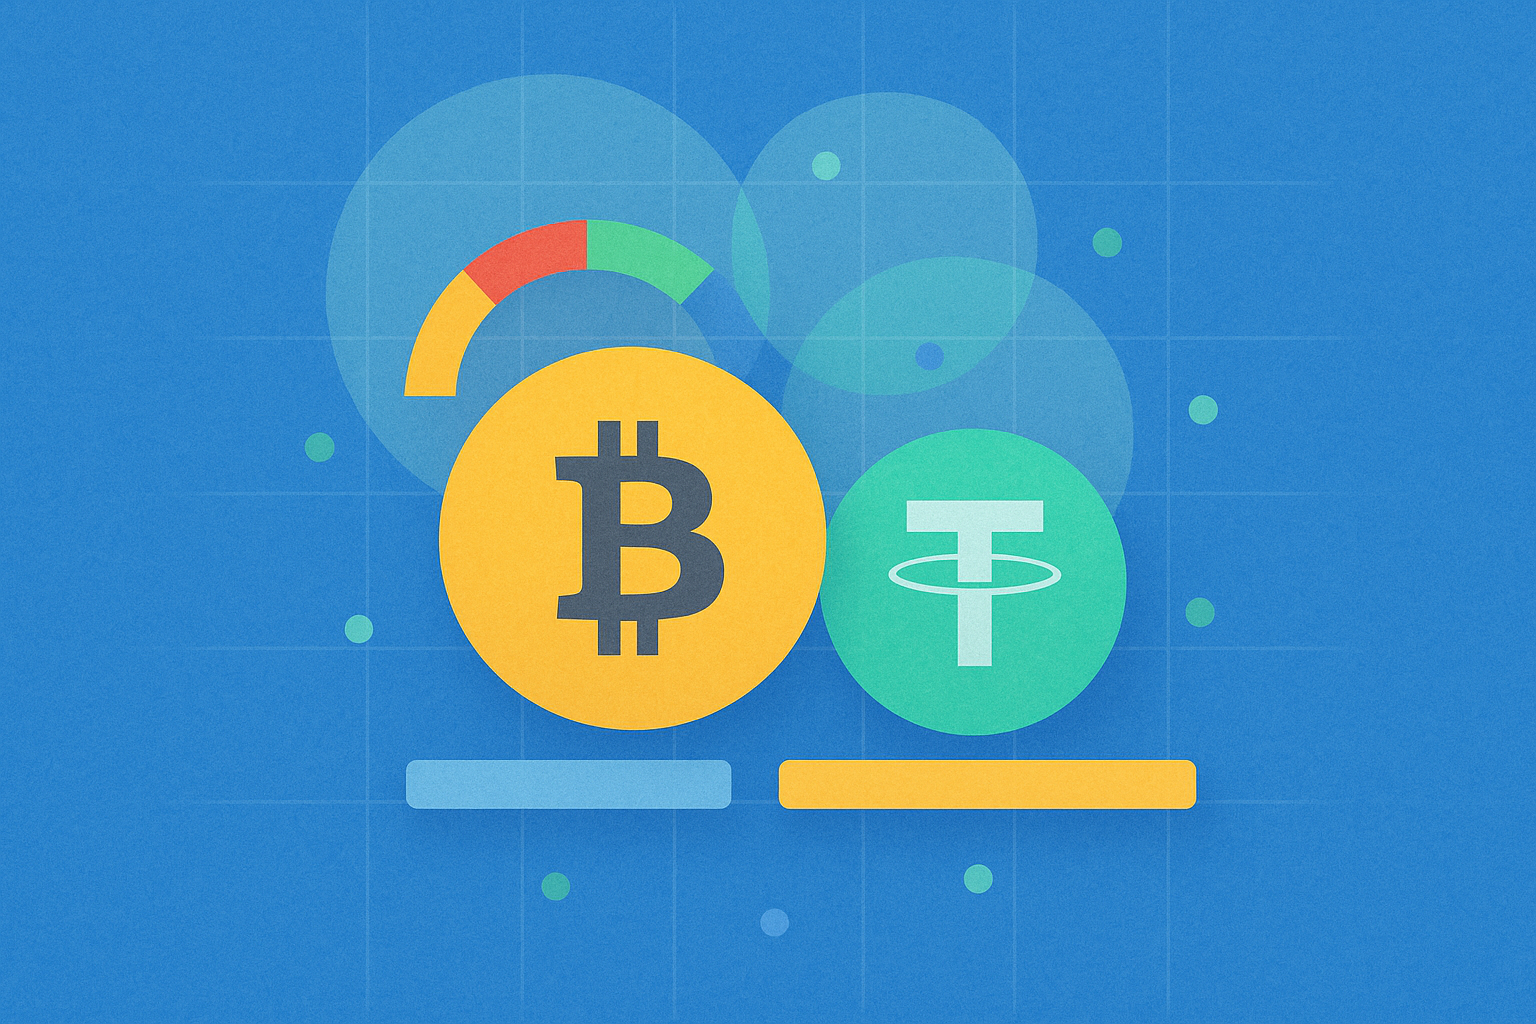
This comprehensive guide analyzes Bitcoin price volatility, USDT market dynamics, and current cryptocurrency trends affecting investors. The article examines the Bitcoin price decline from $49,000 to below $42,000, exploring the impact of spot Bitcoin ETF launches and the historical 'sell the news' phenomenon that drives short-term corrections. Key technical analysis identifies critical support levels at $40,000 and resistance at $47,500, providing investors with essential price reference points. The guide covers how Bitcoin volatility affects related stocks and mining operations, reviews market sentiment through the Greed & Fear Index, and explains USDT's role during market turbulence. Investors gain insights into trading volumes, stablecoin demand patterns, and risk management strategies. The article emphasizes adopting comprehensive investment approaches combining technical analysis, sentiment indicators, and macroeconomic factors for informed decision-making in the dynamic cryptocurrency market.
USDT Drop and Bitcoin Price Volatility: Background Context
Over the past period, the cryptocurrency market has experienced significant fluctuations, with Bitcoin (BTC) price movements attracting widespread attention. Bitcoin's price dropped sharply from a two-year high of $49,000 to below $42,000, representing nearly a 10% decline. This phenomenon has not only affected Bitcoin itself but has also indirectly impacted the market dynamics of stablecoins such as USDT.
This article provides a comprehensive examination of the reasons behind the USDT drop, analyzing factors influencing Bitcoin price volatility. We will explore market trends and technical indicators to offer investors a thorough overview of the current market situation. Understanding these interconnected dynamics is crucial for making informed investment decisions in the volatile cryptocurrency landscape.
The correlation between Bitcoin's price movements and USDT's market behavior reflects broader market sentiment and liquidity patterns. When Bitcoin experiences significant price swings, investors often seek refuge in stablecoins like USDT, creating interesting supply and demand dynamics that merit careful analysis.
Bitcoin ETF Launch and Market Response
The recent volatility in Bitcoin's price has been closely linked to the launch of spot Bitcoin ETFs in the United States. This event marked a significant milestone for the cryptocurrency industry, triggering short-term market growth. However, historical data demonstrates that similar "positive news" events are often accompanied by "sell the news" market behavior.
The introduction of regulated Bitcoin investment vehicles represents a maturation of the cryptocurrency market, providing institutional investors with compliant access to digital assets. This development has far-reaching implications for market structure and price discovery mechanisms. The ETF launch created initial euphoria, but as often happens with highly anticipated events, the market subsequently entered a consolidation phase.
Historical Examples of "Sell the News" Behavior
Historical market patterns provide valuable insights into current price movements. Several notable examples illustrate the "sell the news" phenomenon:
-
Coinbase Listing (2021): During Coinbase's listing on Nasdaq, Bitcoin's price experienced significant short-term gains, but this was soon followed by a sharp pullback. The event was highly anticipated, and once it materialized, profit-taking pressure emerged as investors who had positioned themselves ahead of the event began exiting their positions.
-
ProShares Bitcoin ETF Launch: A similar situation occurred with the launch of ProShares' Bitcoin futures ETF. The market initially showed strong momentum, but a noticeable correction followed shortly after. This pattern reflects a common market psychology where anticipation drives prices up, but the actual event triggers a reassessment of valuations.
These historical events demonstrate that markets often undergo correction periods following major positive news, which aligns with Bitcoin's current downward trend. Understanding these patterns helps investors recognize that short-term volatility following significant announcements is a normal market behavior rather than an anomaly.
Technical Analysis: Key Support and Resistance Levels
Technical analysis provides crucial insights into potential price movements and market structure. According to market analysis, the $42,000 level for Bitcoin is considered an important liquidity zone. If this level is breached, the market may continue declining toward $40,000, which coincides with the CME futures gap.
Understanding these technical levels is essential for risk management and position sizing. Support and resistance levels represent areas where significant buying or selling interest has historically emerged, making them critical reference points for traders and investors.
-
Resistance Level at $47,500: Analytics firm Swissblock noted significant selling pressure at the $47,500 level, indicating market weakness. This resistance zone represents a psychological barrier where previous buyers may be looking to exit positions or where new sellers are willing to enter the market. The concentration of sell orders at this level creates a ceiling that price must overcome to resume an upward trajectory.
-
Support Level at $40,000: If the $42,000 support level fails to hold, the market will likely test the key support zone at $40,000. This level is significant because it represents a major psychological threshold and aligns with technical patterns from previous price action. The $40,000 level also corresponds to the CME futures gap, which markets often tend to fill, adding another layer of technical significance.
These technical indicators provide investors with important reference points, helping them better understand possible market development scenarios. Traders should monitor price action around these levels closely, as breaks or bounces can signal the next major move in Bitcoin's price trajectory.
The decline in Bitcoin's price has created a ripple effect across cryptocurrency-related stocks and mining operations. This correlation demonstrates how deeply interconnected the cryptocurrency ecosystem has become with traditional financial markets. The performance of these stocks often serves as a leading or confirming indicator of sentiment in the broader crypto market.
Mining companies are particularly sensitive to Bitcoin price movements because their profitability is directly tied to the value of the Bitcoin they produce. When prices decline significantly, mining operations face pressure on their margins, especially those with higher operational costs or significant debt obligations.
-
Marathon Digital: Showed the largest decline, reaching 15%. This substantial drop reflects investor concerns about the company's near-term profitability and the sustainability of current mining operations at lower Bitcoin prices.
-
Hut 8 and Riot Platforms: Also demonstrated significant declines. These companies, along with other publicly traded miners, face similar pressures as Bitcoin prices retreat from recent highs.
The performance of these stocks reflects the profound impact of Bitcoin price volatility on the entire cryptocurrency ecosystem. Investors monitoring these stocks can gain insights into institutional sentiment toward cryptocurrency markets and the health of the mining sector, which plays a crucial role in network security and Bitcoin's overall infrastructure.
Market Sentiment and the Greed & Fear Index
Market sentiment represents one of the key factors influencing price fluctuations in cryptocurrency markets. According to the Greed & Fear Index, the market is experiencing a state of extreme pessimism. Such sentiment is often viewed as a potential signal of a tactical bottom, indicating a possible approaching reversal point.
The Greed & Fear Index aggregates multiple data points including volatility, market momentum, social media sentiment, and trading volumes to provide a composite measure of market psychology. When the index reaches extreme levels, it often suggests that the market may be due for a reversal, as excessive fear can create buying opportunities for contrarian investors.
However, investors should approach this indicator with caution, as sentiment changes can be driven by numerous factors, including macroeconomic conditions and market news. Extreme sentiment readings can persist longer than expected, and attempting to time market bottoms based solely on sentiment indicators can be risky.
Additionally, the current pessimistic sentiment may reflect broader concerns about regulatory developments, macroeconomic headwinds, or technical factors specific to the cryptocurrency market. Investors should consider sentiment indicators as one component of a comprehensive analysis rather than a standalone trading signal.
Potential Impact of USDT Drop
As one of the most widely used stablecoins in the market, USDT's dynamics are typically closely linked to overall market trends. While USDT's price usually remains stable around $1, market volatility can indirectly affect its trading volumes and demand patterns.
USDT serves as a critical bridge between fiat currency and cryptocurrencies, providing liquidity and serving as a safe haven during periods of market turbulence. Understanding USDT's behavior during volatile periods offers insights into broader market dynamics and investor risk appetite.
-
Increased Trading Volumes: During periods of market volatility, investors may transfer funds into stablecoins such as USDT to reduce risk exposure. This flight to safety behavior is common when cryptocurrency prices are declining sharply, as traders seek to preserve capital while remaining positioned to re-enter the market when conditions improve.
-
Demand Fluctuations: If market sentiment remains subdued, demand for USDT may continue to grow. Increased demand for stablecoins during downturns reflects a defensive positioning by market participants who want to avoid further losses while maintaining liquidity to capitalize on potential buying opportunities.
Additionally, USDT's dynamics may be influenced by changes in regulation and market liquidity, requiring investors to pay close attention to relevant developments. Regulatory scrutiny of stablecoins has intensified, and any adverse regulatory actions could impact USDT's market position and overall cryptocurrency market liquidity. Investors should monitor both the premium or discount of USDT relative to its $1 peg and overall trading volumes as indicators of market stress or confidence.
Conclusion and Outlook
The recent developments surrounding USDT are closely connected to Bitcoin price volatility, reflecting market reactions to major events and the role of technical indicators. By analyzing historical patterns, support and resistance levels, and market sentiment, investors can gain a more complete understanding of current market dynamics.
While the market may continue to experience fluctuations in the short term, the cryptocurrency industry is likely to gradually stabilize over the long term as it matures and develops. The current volatility, while concerning for some investors, represents a natural part of the market's evolution and price discovery process.
When making investment decisions, investors should consider multiple factors to avoid being influenced by only one aspect of the market. A comprehensive approach that incorporates technical analysis, fundamental factors, sentiment indicators, and macroeconomic conditions will provide a more robust framework for navigating cryptocurrency markets.
A deep understanding of market trends and technical indicators will help investors better capitalize on market opportunities and minimize potential risks. As the cryptocurrency market continues to evolve, those who maintain discipline, conduct thorough research, and manage risk appropriately will be best positioned to achieve long-term success in this dynamic and rapidly changing landscape.
FAQ
What are the main reasons for USDT decline?
USDT decline is primarily driven by market volatility, shifts in stablecoin demand, broader cryptocurrency market corrections, changes in regulatory sentiment, and fluctuations in underlying reserve asset values affecting investor confidence.
USDT price fluctuations have minimal direct impact on Bitcoin prices. Bitcoin's value is primarily driven by market demand, adoption, and macroeconomic factors. USDT remains a stablecoin pegged to the US dollar, so its price typically stays stable at $1, with any fluctuations being temporary.
USDT price fluctuations have minimal direct impact on Bitcoin prices. Bitcoin's value is primarily driven by market demand, adoption, and macroeconomic factors. USDT remains a stablecoin pegged to the US dollar, so its price typically stays stable at $1, with any fluctuations being temporary.
What are the main driving factors of Bitcoin price volatility?
Bitcoin price volatility is driven by market sentiment, macroeconomic factors, regulatory news, transaction volume, institutional adoption, and technological developments. Supply-demand dynamics and geopolitical events also significantly impact price movements.
What strategies should investors adopt during USDT decline?
During USDT decline, investors should diversify holdings across stable assets, increase positions in undervalued cryptocurrencies, maintain sufficient liquidity, monitor market trends closely, and consider dollar-cost averaging to reduce entry costs during downturns.
How to analyze current trends and future direction of the cryptocurrency market?
Monitor Bitcoin dominance, trading volume, and altcoin correlation patterns. Analyze on-chain metrics like whale accumulation and network activity. Track macroeconomic indicators and regulatory developments. Watch resistance/support levels and sentiment indicators for trend confirmation and potential reversals.
What are the risks and advantages of USDT compared to other stablecoins?
USDT advantages: largest market cap, highest trading volume, widest acceptance across platforms. Risks: centralization concerns, regulatory exposure, reserve transparency questions. Other stablecoins offer decentralization but lower liquidity and adoption rates.
* The information is not intended to be and does not constitute financial advice or any other recommendation of any sort offered or endorsed by Gate.