This comprehensive analysis compares APT and BTC investment potential through 2031, addressing which cryptocurrency offers better returns in 2026. BTC demonstrates lower volatility and stronger institutional adoption with $94,518 current price, while APT represents emerging Layer 1 ecosystem opportunities at $1.95, having declined from $19.92 peak. The article examines supply mechanisms, where BTC features fixed 21-million-coin cap versus APT's PoS-driven ecosystem dynamics; institutional infrastructure favoring BTC; and technological positioning contrasting BTC's store-of-value focus with APT's DeFi scalability. Conservative investors are guided toward BTC 80-90% allocation, while aggressive portfolios balance 60-70% BTC with 30-40% APT exposure. 2026-2031 forecasts project BTC conservative range $70,586-$95,387 with optimistic scenarios reaching $130,680, compared to APT's $1.27-$2.79 range. Essential risk considerations include APT's elevated volatility and limited liquidity versus BTC's macroeconomic sens
Introduction: APT vs BTC Investment Comparison
In the cryptocurrency market, the comparison between APT vs BTC has consistently been a focal point for investors. These two assets differ significantly in market capitalization ranking, application scenarios, and price performance, representing distinct positioning within the crypto asset landscape.
Aptos (APT): Launched in 2022, this independent high-performance PoS Layer 1 project has gained market recognition by focusing on delivering secure and scalable blockchain infrastructure utilizing the Move programming language and Move virtual machine for application development.
Bitcoin (BTC): Since its introduction in 2008, Bitcoin has been recognized as digital gold and remains one of the cryptocurrencies with the highest global trading volume and market capitalization.
This article will comprehensively analyze the investment value comparison between APT vs BTC through historical price trends, supply mechanisms, institutional adoption, technological ecosystems, and future projections, attempting to address the question most concerning to investors:
"Which is the better buy right now?"
I. Historical Price Comparison and Current Market Status
APT and BTC Historical Price Trends
-
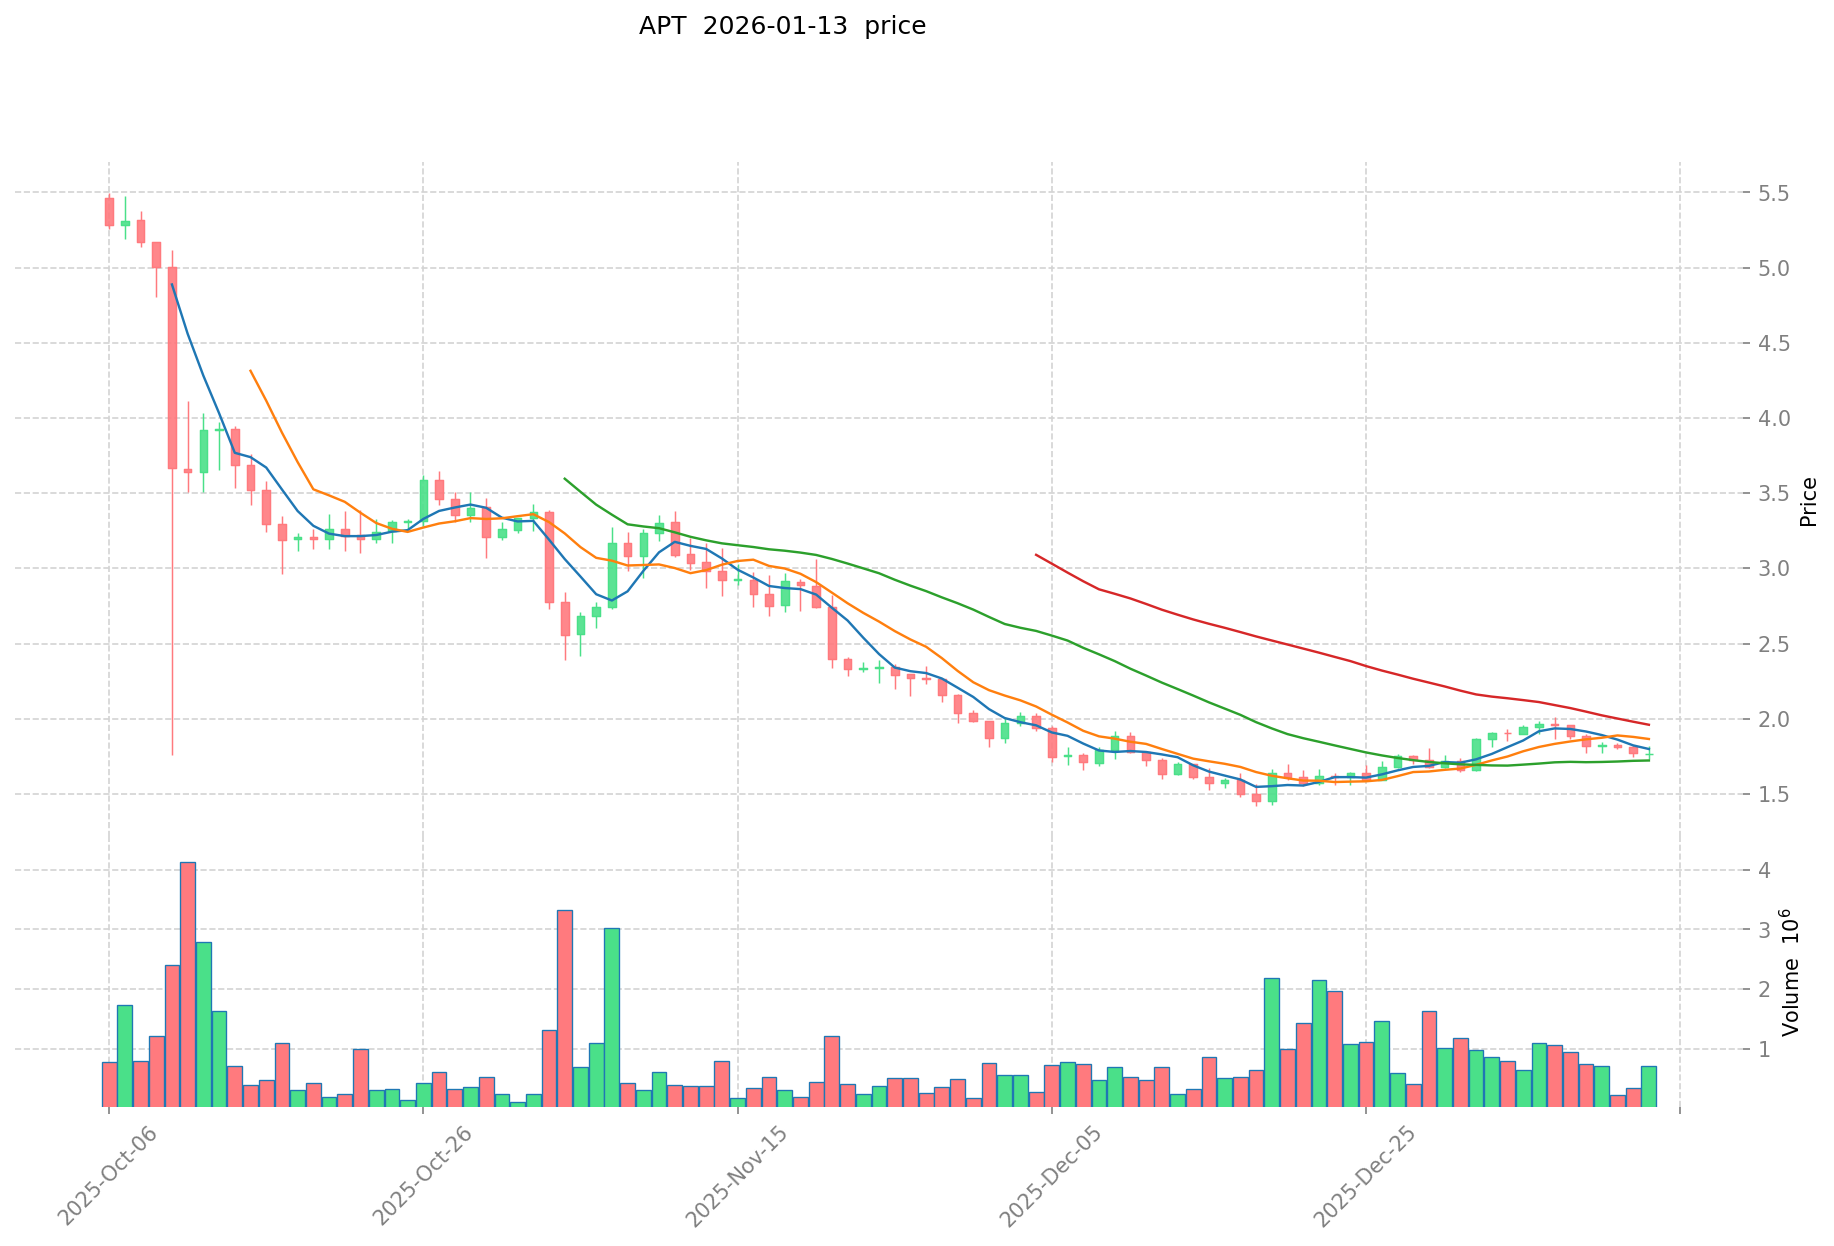
2023: APT experienced notable price movement following its mainnet launch in October 2022, with the price reaching an all-time high of $19.92 in January 2023. The token demonstrated significant volatility during its early trading period.
-
2023: BTC witnessed considerable market activity, with price movements influenced by macroeconomic factors and institutional adoption trends. The asset maintained its position as the dominant cryptocurrency throughout the year.
-
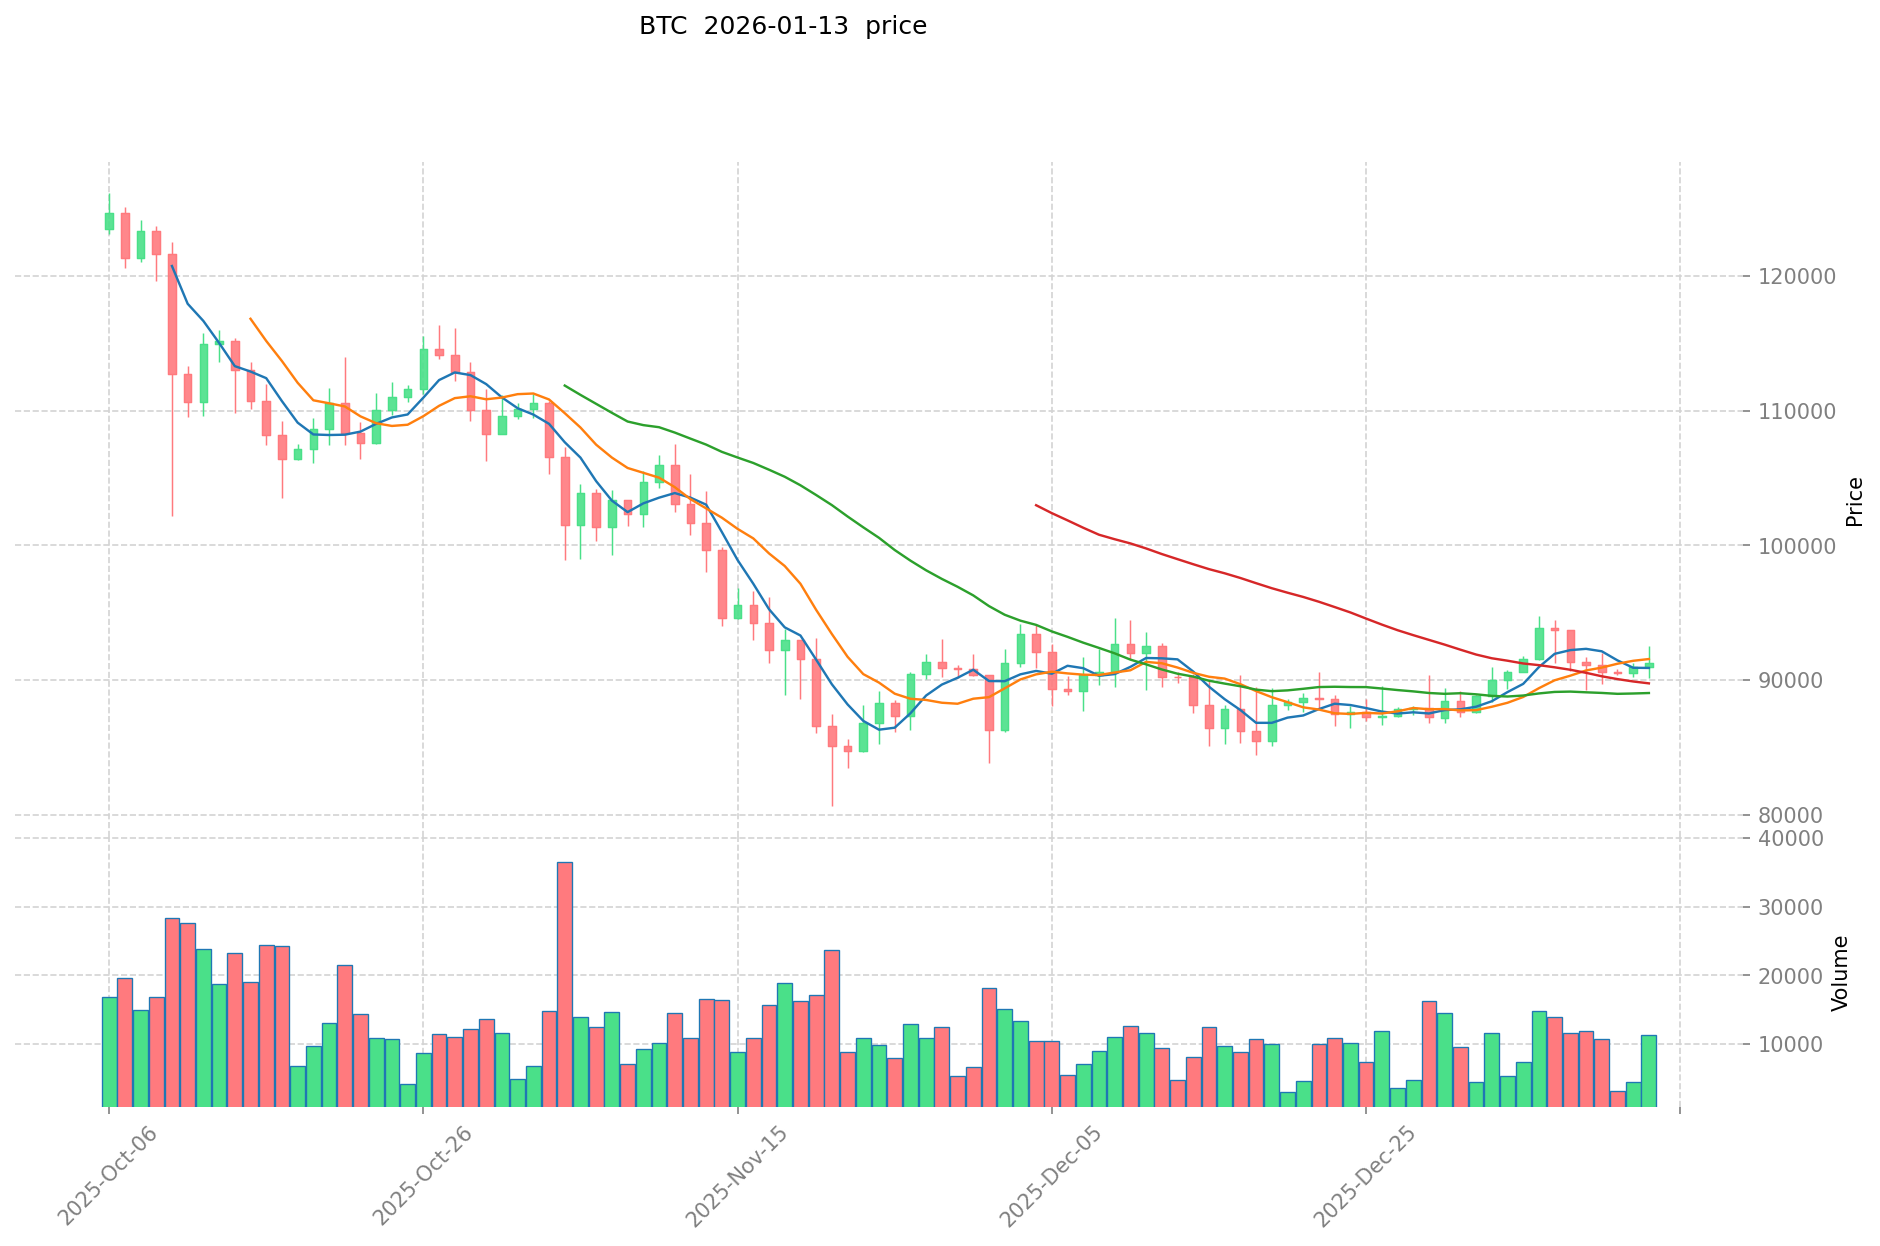
Comparative Analysis: During recent market cycles, APT declined from its peak of $19.92 to a low of $1.42 recorded in December 2025, representing a substantial correction. In contrast, BTC demonstrated relatively more stable price action, moving from its peak of $126,080 in October 2025 to current levels, reflecting a different volatility pattern compared to APT.
Current Market Status (2026-01-14)
- APT Current Price: $1.9499
- BTC Current Price: $94,518
- 24-Hour Trading Volume: APT recorded $2.23 million compared to BTC's $1.21 billion
- Market Sentiment Index (Fear & Greed Index): 26 (Fear)
View Real-Time Prices:
II. Core Factors Influencing APT vs BTC Investment Value
Supply Mechanism Comparison (Tokenomics)
- APT: The token operates within a PoS blockchain framework with ecosystem-driven supply dynamics influenced by unlock schedules and staking mechanisms.
- BTC: Features a fixed supply cap of 21 million coins with a halving mechanism that reduces block rewards approximately every four years, creating predictable scarcity patterns.
- 📌 Historical Pattern: Supply mechanisms have historically influenced price cycles, with structured release schedules and deflationary designs contributing to cyclical market movements.
Institutional Adoption and Market Application
- Institutional Holdings: BTC has demonstrated broader institutional acceptance, with its market dominance and established infrastructure attracting institutional capital flows.
- Enterprise Adoption: Both assets offer advantages in transaction efficiency and cost-effectiveness. BTC's established presence in cross-border settlements contrasts with APT's emerging ecosystem applications.
- Regulatory Landscape: Regulatory perspectives vary across jurisdictions, with established frameworks more commonly applied to BTC compared to newer Layer 1 alternatives.
Technical Development and Ecosystem Building
- APT Technical Advancement: Built as a modular, scalable Layer 1 PoS blockchain utilizing the Move programming language for transaction execution. The mainnet launched in October 2022, and Total Value Locked (TVL) activity has shown growth in the ecosystem.
- BTC Technical Evolution: Maintains its core protocol stability with ongoing development in second-layer solutions and network optimization.
- Ecosystem Comparison: APT focuses on DeFi applications and ecosystem expansion through modular architecture, while BTC emphasizes settlement finality and store-of-value characteristics with limited smart contract functionality.
Macroeconomic Environment and Market Cycles
- Performance in Inflationary Context: Market analysis has noted correlations between cryptocurrency market movements and macroeconomic indicators such as inflation trends.
- Macroeconomic Monetary Policy: Interest rate adjustments and dollar index fluctuations can influence capital flows within the digital asset market, affecting both established and emerging cryptocurrencies.
- Geopolitical Considerations: Cross-border transaction demand and international developments contribute to market dynamics, with established assets potentially demonstrating different response patterns compared to ecosystem-focused alternatives.
III. 2026-2031 Price Forecast: APT vs BTC
Short-term Forecast (2026)
- APT: Conservative $1.27-$1.95 | Optimistic $2.37-$2.79
- BTC: Conservative $70,586-$95,387 | Optimistic $95,387-$130,680
Medium-term Forecast (2028-2029)
- APT may enter a consolidation phase with projected price range of $1.94-$3.29
- BTC may enter an expansion phase with projected price range of $87,742-$221,199
- Key drivers: institutional capital inflows, ETF developments, ecosystem growth
Long-term Forecast (2030-2031)
- APT: Baseline scenario $1.81-$2.91 | Optimistic scenario $3.17-$3.43
- BTC: Baseline scenario $128,171-$188,487 | Optimistic scenario $226,184-$273,683
View detailed price predictions for APT and BTC
Disclaimer
APT:
| Year |
Predicted High Price |
Predicted Average Price |
Predicted Low Price |
Price Change |
| 2026 |
2.793934 |
1.9538 |
1.26997 |
0 |
| 2027 |
2.54003769 |
2.373867 |
2.1364803 |
21 |
| 2028 |
2.6043694857 |
2.456952345 |
1.94099235255 |
26 |
| 2029 |
3.289859189955 |
2.53066091535 |
2.0498353414335 |
29 |
| 2030 |
3.43410686212995 |
2.9102600526525 |
2.706541848966825 |
49 |
| 2031 |
3.39423629940861 |
3.172183457391225 |
1.808144570712998 |
62 |
BTC:
| Year |
Predicted High Price |
Predicted Average Price |
Predicted Low Price |
Price Change |
| 2026 |
130680.053 |
95386.9 |
70586.306 |
0 |
| 2027 |
141291.845625 |
113033.4765 |
73471.759725 |
19 |
| 2028 |
184385.858540625 |
127162.6610625 |
87742.236133125 |
34 |
| 2029 |
221199.44891821875 |
155774.2598015625 |
96580.04107696875 |
64 |
| 2030 |
263881.596103846875 |
188486.854359890625 |
128171.060964725625 |
99 |
| 2031 |
273682.9125305611875 |
226184.22523186875 |
156067.1154099894375 |
139 |
IV. Investment Strategy Comparison: APT vs BTC
Long-term vs Short-term Investment Strategies
-
APT: May appeal to investors focused on emerging ecosystem development and technological innovation in blockchain infrastructure. The asset's relatively early stage presents opportunities associated with Layer 1 blockchain growth, though accompanied by corresponding volatility patterns.
-
BTC: May suit investors seeking exposure to established digital assets with broader institutional recognition and historical market presence. The asset's longer operational history and market infrastructure development offer different characteristics compared to emerging alternatives.
Risk Management and Asset Allocation
-
Conservative Investors: Consider allocation frameworks such as APT: 10-20% vs BTC: 80-90%, prioritizing established assets with longer track records while maintaining limited exposure to emerging ecosystem plays.
-
Aggressive Investors: May explore allocation structures such as APT: 30-40% vs BTC: 60-70%, balancing exposure to established market leaders with positions in developing Layer 1 ecosystems.
-
Hedging Instruments: Portfolio risk management approaches may include stablecoin positions for liquidity management, options strategies for downside protection, and cross-asset diversification across different blockchain architectures and use cases.
V. Potential Risk Comparison
Market Risks
-
APT: The asset demonstrates elevated volatility characteristics associated with newer market entrants, with price movements influenced by ecosystem development milestones, unlock schedules, and broader market sentiment. Trading volume patterns show lower liquidity compared to established cryptocurrencies.
-
BTC: While exhibiting lower relative volatility compared to emerging alternatives, the asset remains subject to macroeconomic factors, institutional capital flows, and regulatory developments. Market cycles have historically shown correlation with broader risk asset movements.
Technical Risks
-
APT: As a developing Layer 1 ecosystem, considerations include network scalability testing under increasing transaction loads, ecosystem maturation, and the ongoing development of infrastructure components. The relatively recent mainnet launch means the network has accumulated less operational history compared to established alternatives.
-
BTC: Technical considerations include mining concentration patterns across geographic regions and mining pools, as well as ongoing development of scaling solutions. The network's established security model has demonstrated resilience over extended periods.
Regulatory Risks
- Global regulatory frameworks demonstrate varying approaches to digital assets. Established cryptocurrencies with longer operational histories have received more defined regulatory treatment in certain jurisdictions, while newer Layer 1 alternatives may face evolving classification approaches. Regulatory developments in major markets can influence capital flows and institutional participation patterns differently across asset categories.
VI. Conclusion: Which Is the Better Buy?
📌 Investment Value Summary:
-
APT Characteristics: Represents exposure to emerging Layer 1 blockchain infrastructure utilizing Move programming language, with ecosystem development focused on scalability and modular architecture. The asset offers participation in a developing ecosystem with corresponding growth potential and volatility patterns.
-
BTC Characteristics: Provides exposure to the established digital asset with the longest operational history, broader institutional recognition, and developed market infrastructure. The asset demonstrates relatively lower volatility compared to emerging alternatives while maintaining sensitivity to macroeconomic conditions.
✅ Investment Considerations:
-
Beginning Investors: May consider starting with established assets demonstrating longer operational histories and broader market infrastructure before allocating to emerging ecosystem plays. Focus on understanding fundamental concepts of digital asset markets and risk management frameworks.
-
Experienced Investors: Could evaluate portfolio allocation strategies balancing exposure across different blockchain architectures and market maturity stages. Consider implementing systematic approaches to position sizing based on individual risk tolerance and investment timeframes.
-
Institutional Participants: May assess allocation frameworks considering regulatory compliance requirements, custody solutions, liquidity profiles, and correlation characteristics with existing portfolio holdings. Evaluation of operational infrastructure and market depth across different asset categories remains relevant.
⚠️ Risk Disclosure: Cryptocurrency markets demonstrate elevated volatility characteristics and contain inherent risks. This content does not constitute investment advice, financial guidance, or recommendations for specific investment actions. Market participants should conduct independent research and consider consulting qualified financial professionals before making investment decisions.
VII. FAQ
Q1: What are the main differences between APT and BTC in terms of technological architecture?
APT is a modern Layer 1 PoS blockchain utilizing the Move programming language with a focus on modularity and scalability, while BTC operates as a Proof-of-Work blockchain prioritizing security and decentralization with limited smart contract functionality. APT launched its mainnet in October 2022, featuring advanced transaction execution capabilities through the Move virtual machine, whereas BTC has maintained its core protocol stability since 2008, emphasizing settlement finality and store-of-value characteristics. The fundamental distinction lies in their design philosophy: APT targets DeFi ecosystem expansion and application development, while BTC focuses on establishing itself as digital gold with proven network security over extended operational history.
Q2: How do the supply mechanisms of APT and BTC differ and impact their investment characteristics?
BTC features a fixed supply cap of 21 million coins with a predictable halving mechanism occurring approximately every four years, creating structured scarcity patterns that have historically influenced price cycles. APT operates within a PoS framework with ecosystem-driven supply dynamics affected by unlock schedules and staking mechanisms, resulting in different inflationary characteristics. The fixed supply of BTC contributes to its positioning as a deflationary asset and store of value, while APT's supply structure supports network security through staking incentives and ecosystem growth. These contrasting mechanisms influence investor expectations regarding long-term value preservation versus ecosystem participation rewards.
Q3: Which asset demonstrates lower volatility: APT or BTC?
BTC exhibits relatively lower volatility compared to APT, as evidenced by their respective price movements and market behavior patterns. APT experienced significant correction from its peak of $19.92 in January 2023 to a low of $1.42 in December 2025, demonstrating elevated volatility characteristics typical of newer market entrants. BTC, with its longer operational history and established market infrastructure, shows more stable price action despite remaining sensitive to macroeconomic conditions. The 24-hour trading volume comparison ($2.23 million for APT versus $1.21 billion for BTC) further illustrates the liquidity differential, with higher liquidity generally contributing to reduced price volatility during normal market conditions.
Q4: What allocation strategy should conservative investors consider for APT vs BTC?
Conservative investors may consider an allocation framework of APT: 10-20% versus BTC: 80-90%, prioritizing established assets with longer track records while maintaining limited exposure to emerging ecosystem plays. This approach balances portfolio stability through significant BTC allocation—which offers broader institutional recognition and developed market infrastructure—with strategic exposure to APT's emerging Layer 1 ecosystem potential. The allocation emphasizes capital preservation characteristics associated with BTC's historical market presence while allowing participation in APT's development trajectory. Risk management considerations include maintaining stablecoin positions for liquidity management and implementing systematic rebalancing protocols based on predetermined portfolio thresholds.
Q5: How does institutional adoption differ between APT and BTC?
BTC demonstrates substantially broader institutional acceptance, with its market dominance and established infrastructure attracting significant institutional capital flows across multiple jurisdictions. The asset benefits from developed custody solutions, regulated trading venues, and clear regulatory frameworks in major markets. APT, as a newer Layer 1 alternative launched in 2022, is in earlier stages of institutional recognition, with adoption focused primarily on ecosystem participants and technology-forward investors. The institutional infrastructure surrounding BTC—including spot ETF products, futures markets, and institutional-grade custody solutions—remains more developed compared to APT. This distinction influences liquidity profiles, regulatory clarity, and the types of institutional participants active in each market.
Q6: What are the primary risk factors investors should consider when comparing APT and BTC?
Market risks include APT's elevated volatility characteristics and lower liquidity compared to BTC, with price movements significantly influenced by ecosystem development milestones and unlock schedules. BTC faces macroeconomic sensitivity, correlation with broader risk assets, and regulatory developments in major jurisdictions. Technical risks for APT involve network scalability testing, ecosystem maturation, and limited operational history since its October 2022 mainnet launch, while BTC considerations include mining concentration patterns and scaling solution development. Regulatory risks vary, with established cryptocurrencies like BTC receiving more defined treatment in certain jurisdictions compared to newer Layer 1 alternatives facing evolving classification approaches. Both assets require consideration of portfolio risk management frameworks appropriate to individual risk tolerance levels.
Q7: What does the 2026-2031 price forecast suggest about the relative growth potential of APT versus BTC?
The forecasts suggest different growth trajectories: APT shows conservative 2026 projections of $1.27-$1.95 with optimistic scenarios reaching $2.79, potentially entering consolidation phases during 2028-2029 ($1.94-$3.29 range) before reaching long-term baseline scenarios of $1.81-$2.91 by 2030-2031. BTC demonstrates conservative 2026 projections of $70,586-$95,387 with optimistic scenarios reaching $130,680, potentially entering expansion phases during 2028-2029 ($87,742-$221,199 range) before achieving long-term baseline scenarios of $128,171-$188,487 by 2030-2031. In percentage terms, APT shows potential for higher relative gains from current levels, though accompanied by corresponding volatility and risk characteristics. The forecasts reflect different market maturity stages and growth drivers: APT focused on ecosystem development versus BTC influenced by institutional adoption, ETF developments, and macroeconomic factors.
Q8: How should beginning investors approach the decision between APT and BTC?
Beginning investors may consider starting with established assets like BTC that demonstrate longer operational histories, broader market infrastructure, and relatively lower volatility before allocating to emerging ecosystem plays like APT. This approach allows development of fundamental understanding regarding digital asset markets, risk management frameworks, and portfolio construction principles through exposure to assets with more established trading patterns and market dynamics. Initial focus should emphasize comprehension of cryptocurrency market cycles, custody security practices, and systematic investment approaches rather than pursuing maximum potential returns through emerging alternatives. As knowledge and risk tolerance develop, gradual diversification into assets like APT representing different blockchain architectures and market maturity stages may become appropriate, implemented through systematic position sizing based on individual circumstances and investment timeframes.
* The information is not intended to be and does not constitute financial advice or any other recommendation of any sort offered or endorsed by Gate.