This article provides an in-depth comparison of ARCH and DOT, focusing on investment value, historical price trends, and market status. It addresses investor concerns about which cryptocurrency is a better buy and offers predictions based on market analysis. Key factors such as tokenomics, institutional adoption, and ecosystem growth are thoroughly examined to guide different investment strategies. Suitable for investors ranging from novices to institutions, the article emphasizes risk management while evaluating technical, market, and regulatory risks associated with both cryptocurrencies. Visit Gate for real-time prices and insights.
Introduction: ARCH vs DOT Investment Comparison
In the cryptocurrency market, the comparison between ARCH and DOT has always been a topic that investors cannot avoid. The two not only have significant differences in market cap ranking, application scenarios, and price performance, but also represent different positions in crypto assets.
Archway (ARCH): Since its launch, it has gained market recognition for its incentivized smart contract platform that rewards developers.
Polkadot (DOT): Since its inception in 2020, it has been hailed as an interoperability protocol for connecting different blockchains, and is one of the cryptocurrencies with the highest global trading volume and market capitalization.
This article will comprehensively analyze the investment value comparison between ARCH and DOT, focusing on historical price trends, supply mechanisms, institutional adoption, technical ecosystems, and future predictions, and attempt to answer the question that investors care about most:
"Which is the better buy right now?"
I. Price History Comparison and Current Market Status
ARCH and DOT Historical Price Trends
- 2023: ARCH launched and experienced price volatility in its early stages.
- 2021: DOT reached an all-time high of $55.134 in November due to overall crypto market bullishness.
- Comparative analysis: In the recent bear market cycle, ARCH dropped from its all-time high of $0.28899 to a low of $0.002268, while DOT declined from $55.134 to $2.344.
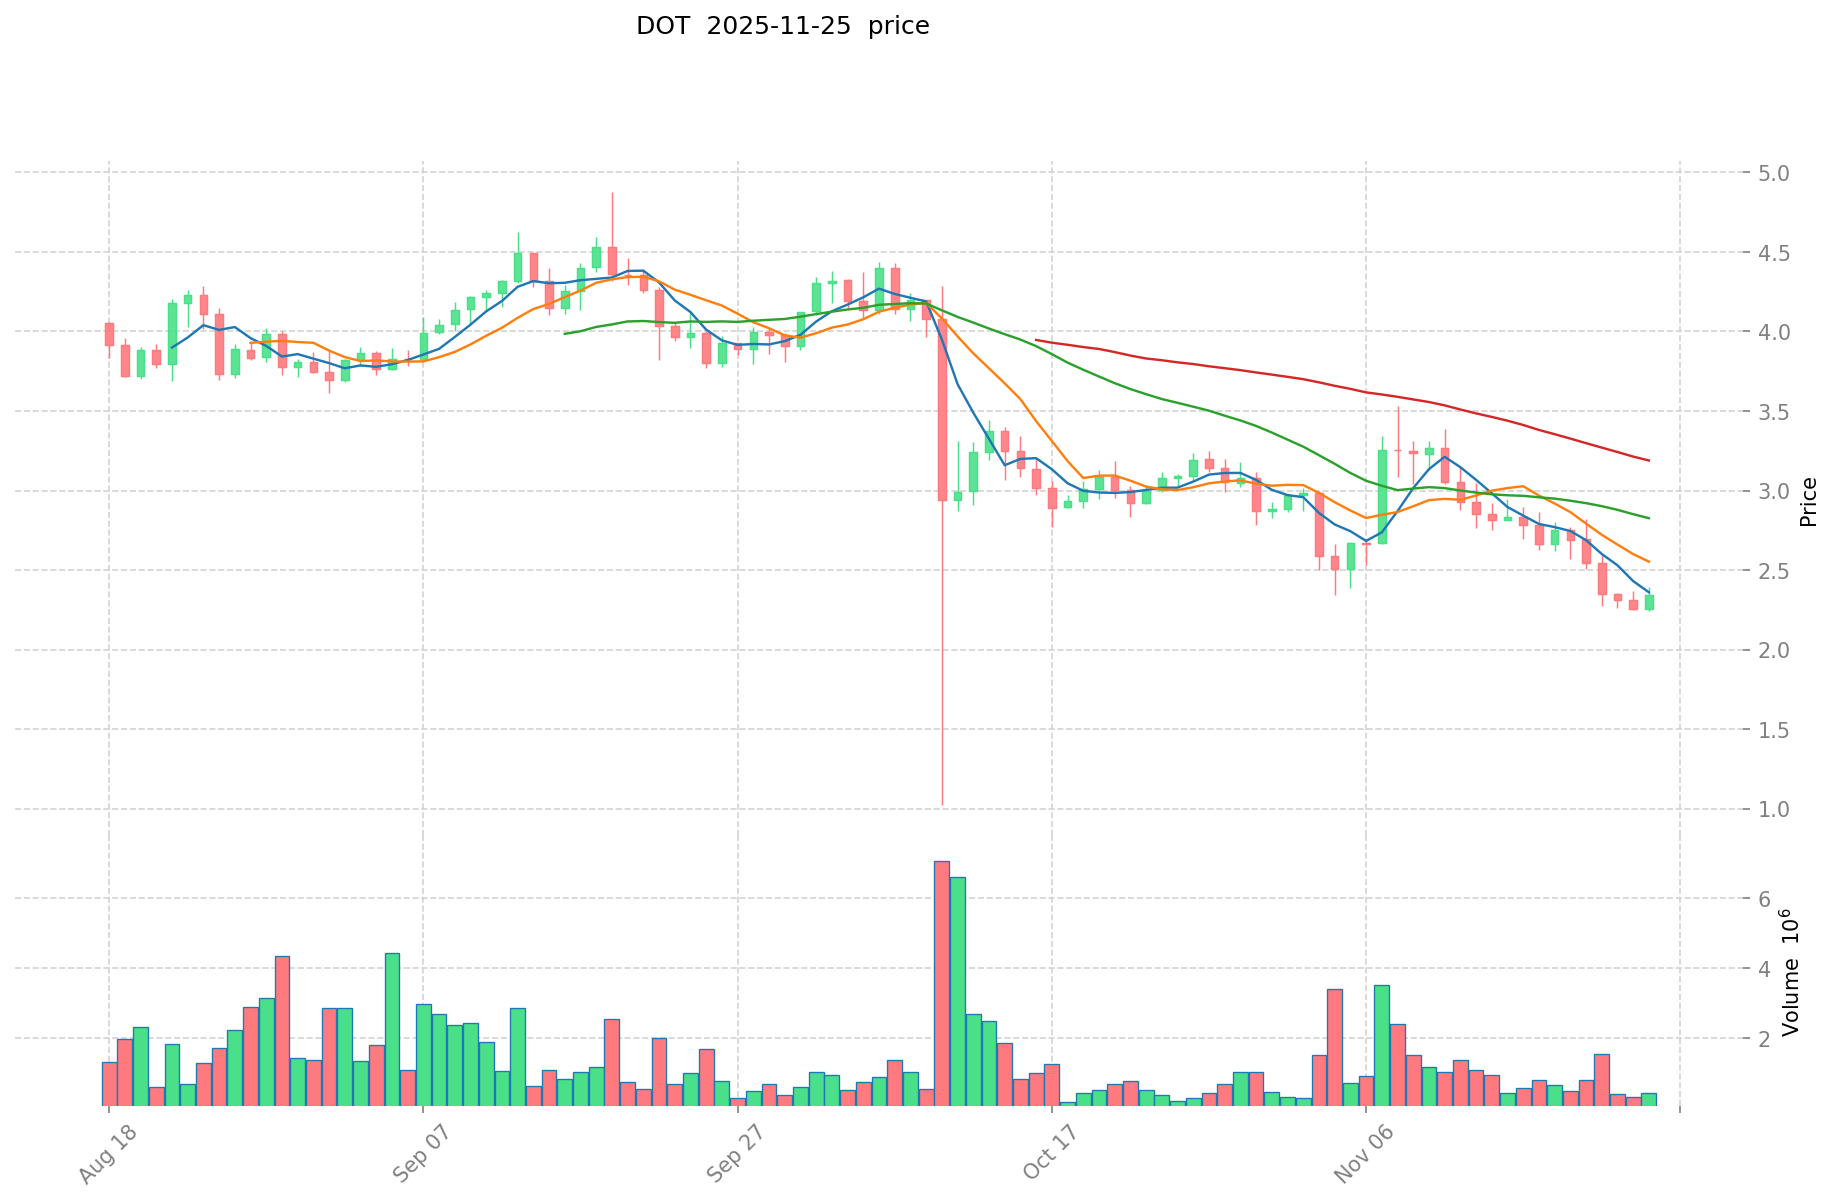
Current Market Situation (2025-11-25)
- ARCH current price: $0.002288
- DOT current price: $2.338
- 24-hour trading volume: ARCH $23,388.18 vs DOT $969,278.93
- Market Sentiment Index (Fear & Greed Index): 19 (Extreme Fear)
Click to view real-time prices:
- Check ARCH current price Market Price
- Check DOT current price Market Price

II. Core Factors Influencing ARCH vs DOT Investment Value
Supply Mechanism Comparison (Tokenomics)
- DOT: Price influenced by market supply and demand, staking rewards, and new projects launching on the platform
- ARCH: Information not available in provided resources
- 📌 Historical Pattern: Cross-chain technology breakthroughs increase ecosystem attractiveness and drive price cycles.
Institutional Adoption and Market Applications
- Institutional Holdings: Information not available in provided resources
- Enterprise Adoption: DOT's cross-chain technology enhances ecosystem attractiveness for business applications
- Regulatory Attitudes: Information not available in provided resources
Technology Development and Ecosystem Building
- DOT Technology Upgrades: Cross-chain technology breakthroughs increase the platform's attractiveness
- ARCH Technology Development: Information not available in provided resources
- Ecosystem Comparison: New projects launching on Polkadot enhance the platform's value proposition
Macroeconomic Factors and Market Cycles
- Performance in Inflationary Environments: Information not available in provided resources
- Macroeconomic Monetary Policy: Information not available in provided resources
- Geopolitical Factors: Market volatility and emergence of competitors may decrease value
III. 2025-2030 Price Prediction: ARCH vs DOT
Short-term Prediction (2025)
- ARCH: Conservative $0.00130416 - $0.002288 | Optimistic $0.002288 - $0.00292864
- DOT: Conservative $1.2402 - $2.34 | Optimistic $2.34 - $3.1824
Mid-term Prediction (2027)
- ARCH may enter a growth phase, expected price range $0.002422607616 - $0.003971949696
- DOT may enter a steady growth phase, expected price range $2.30366916 - $3.01467816
- Key drivers: Institutional capital inflow, ETF, ecosystem development
Long-term Prediction (2030)
- ARCH: Base scenario $0.004867666607232 - $0.005159726603665 | Optimistic scenario $0.005159726603665 - $0.005678944375104
- DOT: Base scenario $4.323218412591 - $5.36079083161284 | Optimistic scenario $5.36079083161284 - $5.36079083161284
View detailed price predictions for ARCH and DOT
Disclaimer: The above predictions are based on historical data and market analysis. Cryptocurrency markets are highly volatile and subject to rapid changes. These forecasts should not be considered as financial advice. Always conduct your own research before making investment decisions.
ARCH:
| 年份 |
预测最高价 |
预测平均价格 |
预测最低价 |
涨跌幅 |
| 2025 |
0.00292864 |
0.002288 |
0.00130416 |
0 |
| 2026 |
0.0030256512 |
0.00260832 |
0.0020344896 |
14 |
| 2027 |
0.003971949696 |
0.0028169856 |
0.002422607616 |
23 |
| 2028 |
0.00471831003072 |
0.003394467648 |
0.00244401670656 |
48 |
| 2029 |
0.005678944375104 |
0.00405638883936 |
0.002312141638435 |
77 |
| 2030 |
0.005159726603665 |
0.004867666607232 |
0.003699426621496 |
112 |
DOT:
| 年份 |
预测最高价 |
预测平均价格 |
预测最低价 |
涨跌幅 |
| 2025 |
3.1824 |
2.34 |
1.2402 |
0 |
| 2026 |
2.926872 |
2.7612 |
2.429856 |
18 |
| 2027 |
3.01467816 |
2.844036 |
2.30366916 |
21 |
| 2028 |
4.0718063412 |
2.92935708 |
1.6404399648 |
25 |
| 2029 |
5.145855114582 |
3.5005817106 |
2.62543628295 |
49 |
| 2030 |
5.36079083161284 |
4.323218412591 |
2.63716323168051 |
84 |
IV. Investment Strategy Comparison: ARCH vs DOT
Long-term vs Short-term Investment Strategies
- ARCH: Suitable for investors focusing on smart contract platform potential
- DOT: Suitable for investors seeking ecosystem growth and interoperability
Risk Management and Asset Allocation
- Conservative investors: ARCH: 20% vs DOT: 80%
- Aggressive investors: ARCH: 40% vs DOT: 60%
- Hedging tools: Stablecoin allocation, options, cross-currency combinations
V. Potential Risk Comparison
Market Risk
- ARCH: Higher volatility due to lower market cap and trading volume
- DOT: Susceptible to overall crypto market trends and competitor developments
Technical Risk
- ARCH: Scalability, network stability
- DOT: Cross-chain technology implementation challenges, security vulnerabilities
Regulatory Risk
- Global regulatory policies may impact both, with potentially greater effect on the more established DOT
VI. Conclusion: Which Is the Better Buy?
📌 Investment Value Summary:
- ARCH advantages: Incentivized smart contract platform, potential for growth
- DOT advantages: Established ecosystem, interoperability focus, higher liquidity
✅ Investment Advice:
- New investors: Consider a smaller allocation to ARCH, larger allocation to DOT for stability
- Experienced investors: Balanced portfolio with both ARCH and DOT, adjusting based on risk tolerance
- Institutional investors: Focus on DOT for its established market position and ecosystem
⚠️ Risk Warning: Cryptocurrency markets are highly volatile. This article does not constitute investment advice.
None
VII. FAQ
Q1: What are the key differences between ARCH and DOT?
A: ARCH is an incentivized smart contract platform that rewards developers, while DOT is an interoperability protocol for connecting different blockchains. DOT has a higher market cap, trading volume, and a more established ecosystem compared to ARCH.
Q2: Which cryptocurrency has performed better historically?
A: Based on the available information, DOT has a longer price history and reached an all-time high of $55.134 in November 2021. ARCH is newer to the market and has experienced price volatility in its early stages. In the recent bear market, both cryptocurrencies have seen significant price declines from their all-time highs.
Q3: What are the current prices and market sentiments for ARCH and DOT?
A: As of 2025-11-25, ARCH's price is $0.002288, while DOT's price is $2.338. The overall market sentiment, indicated by the Fear & Greed Index, is at 19, suggesting "Extreme Fear" in the crypto market.
Q4: How do the supply mechanisms of ARCH and DOT compare?
A: DOT's price is influenced by market supply and demand, staking rewards, and new projects launching on the platform. Information about ARCH's supply mechanism is not available in the provided resources.
Q5: What are the key factors driving the investment value of ARCH and DOT?
A: For DOT, key factors include its cross-chain technology, ecosystem attractiveness, and the launch of new projects on the platform. For ARCH, the main factor mentioned is its incentivized smart contract platform. Both are influenced by overall market trends and technological developments in the crypto space.
Q6: What are the price predictions for ARCH and DOT in the coming years?
A: By 2030, the base scenario for ARCH predicts a price range of $0.004867666607232 - $0.005159726603665, while for DOT, the base scenario predicts $4.323218412591 - $5.36079083161284. However, these predictions are subject to market volatility and should not be considered financial advice.
Q7: How should investors approach ARCH and DOT in their portfolio?
A: For new investors, a smaller allocation to ARCH and a larger allocation to DOT is suggested for stability. Experienced investors might consider a balanced portfolio with both, adjusting based on risk tolerance. Institutional investors may focus more on DOT due to its established market position and ecosystem.
Q8: What are the potential risks associated with investing in ARCH and DOT?
A: Both face market risks tied to overall crypto trends. ARCH may have higher volatility due to its lower market cap and trading volume. DOT faces risks from competitor developments and cross-chain technology implementation challenges. Both are subject to regulatory risks, with potentially greater impact on the more established DOT.
* The information is not intended to be and does not constitute financial advice or any other recommendation of any sort offered or endorsed by Gate.


