This article provides a detailed comparison between ARTEM and KAVA, two innovative blockchain platforms, focusing on their investment potential in DeFi and NFT markets. It examines price trends, market performance, project fundamentals, investment considerations, risk factors, and long-term outlook. The analysis is useful for investors seeking to diversify their portfolios, offering insights into market cap, liquidity, volatility, and growth opportunities. The article suits both new and experienced crypto investors, guiding them in balancing their investment strategies. Keywords: ARTEM, KAVA, blockchain, DeFi, NFT, investment comparison, market analysis.
Introduction: ARTEM vs KAVA Investment Comparison
In the cryptocurrency market, ARTEM vs KAVA comparison has always been a topic that investors cannot avoid. The two not only have significant differences in market cap ranking, application scenarios, and price performance, but also represent different cryptocurrency positioning.
ARTEM (ARTEM): Since its launch in 2022, it has gained market recognition for its governance role in promoting blue-chip contemporary art and luxury NFT acquisitions.
KAVA (KAVA): Introduced in 2019, it has been hailed as a cross-chain DeFi platform, offering decentralized financial services for mainstream digital assets.
This article will comprehensively analyze the investment value comparison between ARTEM and KAVA, focusing on historical price trends, supply mechanisms, institutional adoption, technical ecosystems, and future predictions, and attempt to answer the question that investors are most concerned about:
"Which is the better buy right now?"
I. Price History Comparison and Current Market Status
ARTEM and KAVA Historical Price Trends
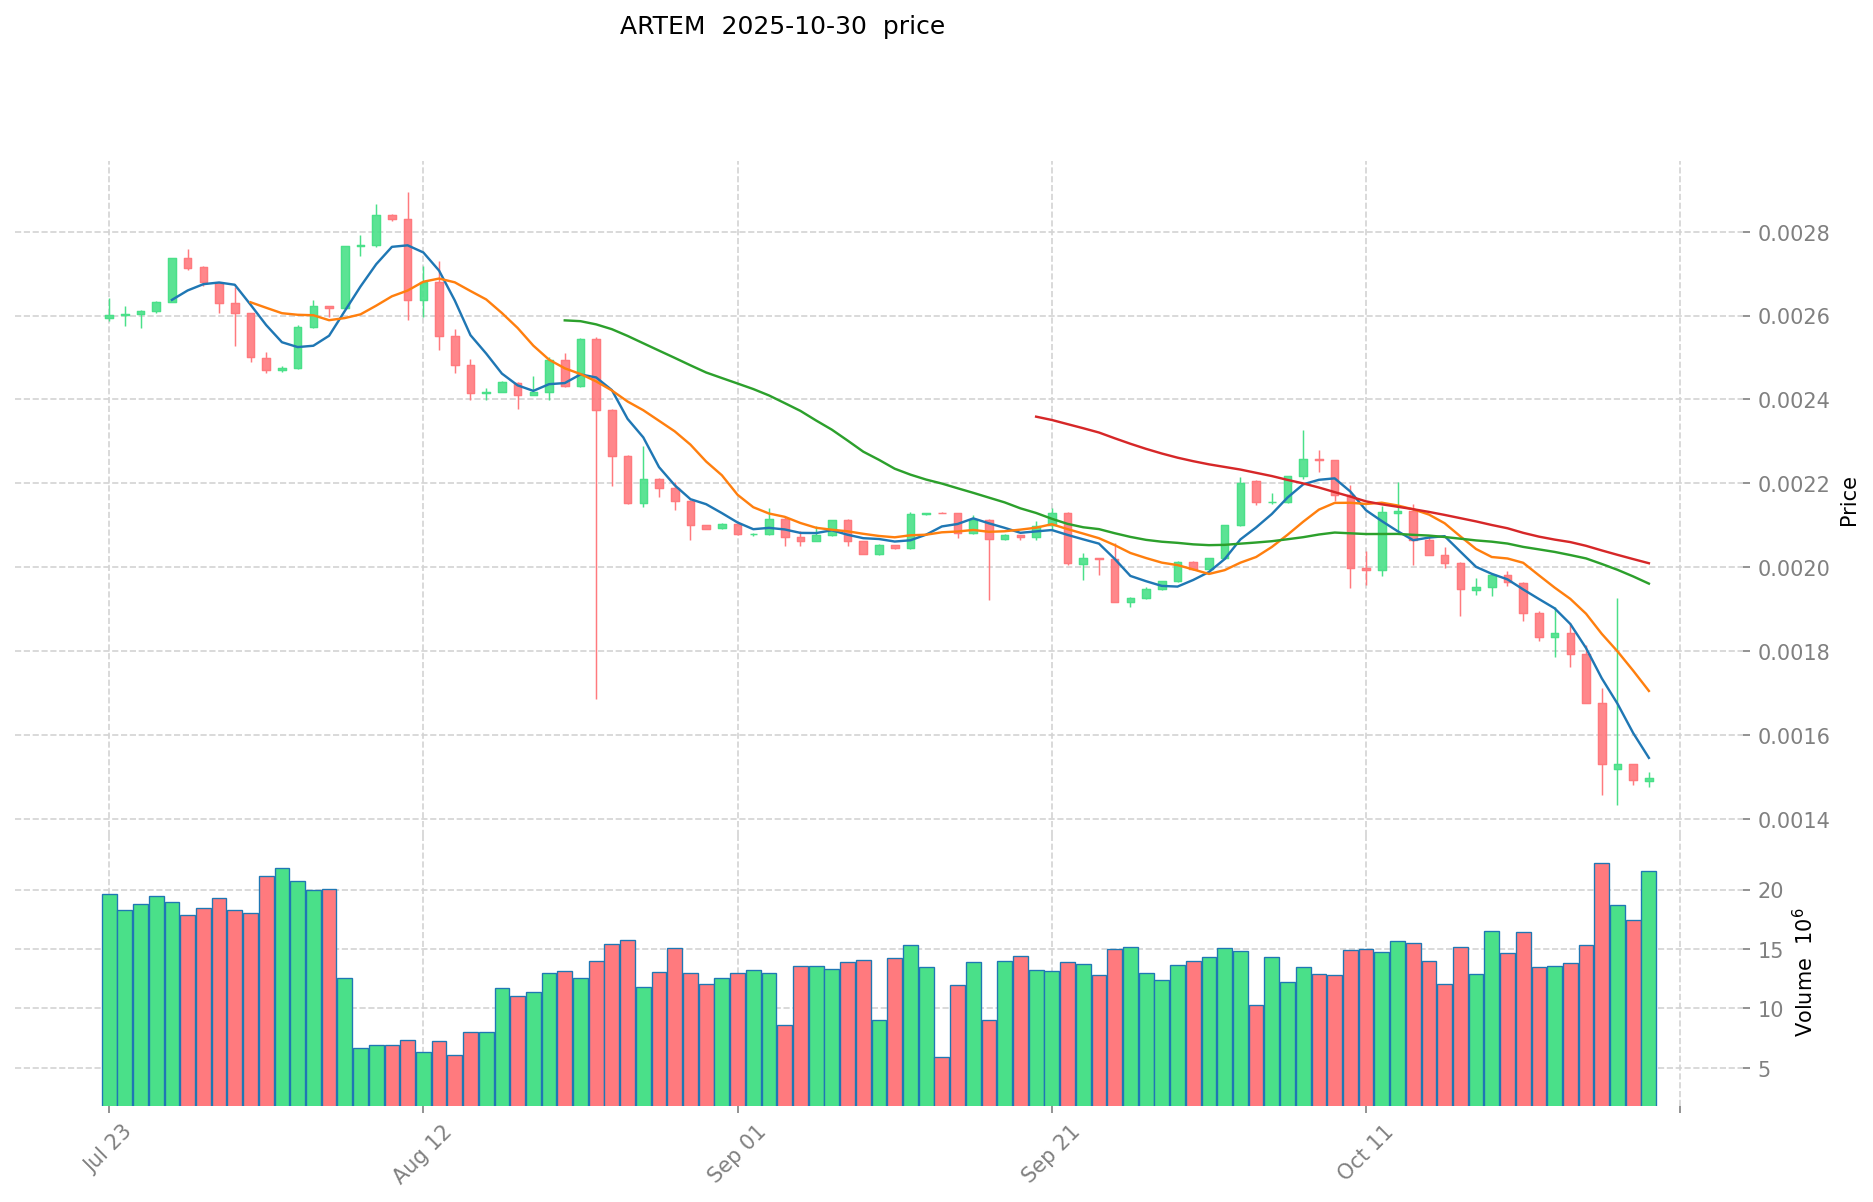
- 2022: ARTEM reached its all-time high of $0.101077, then experienced a significant decline.
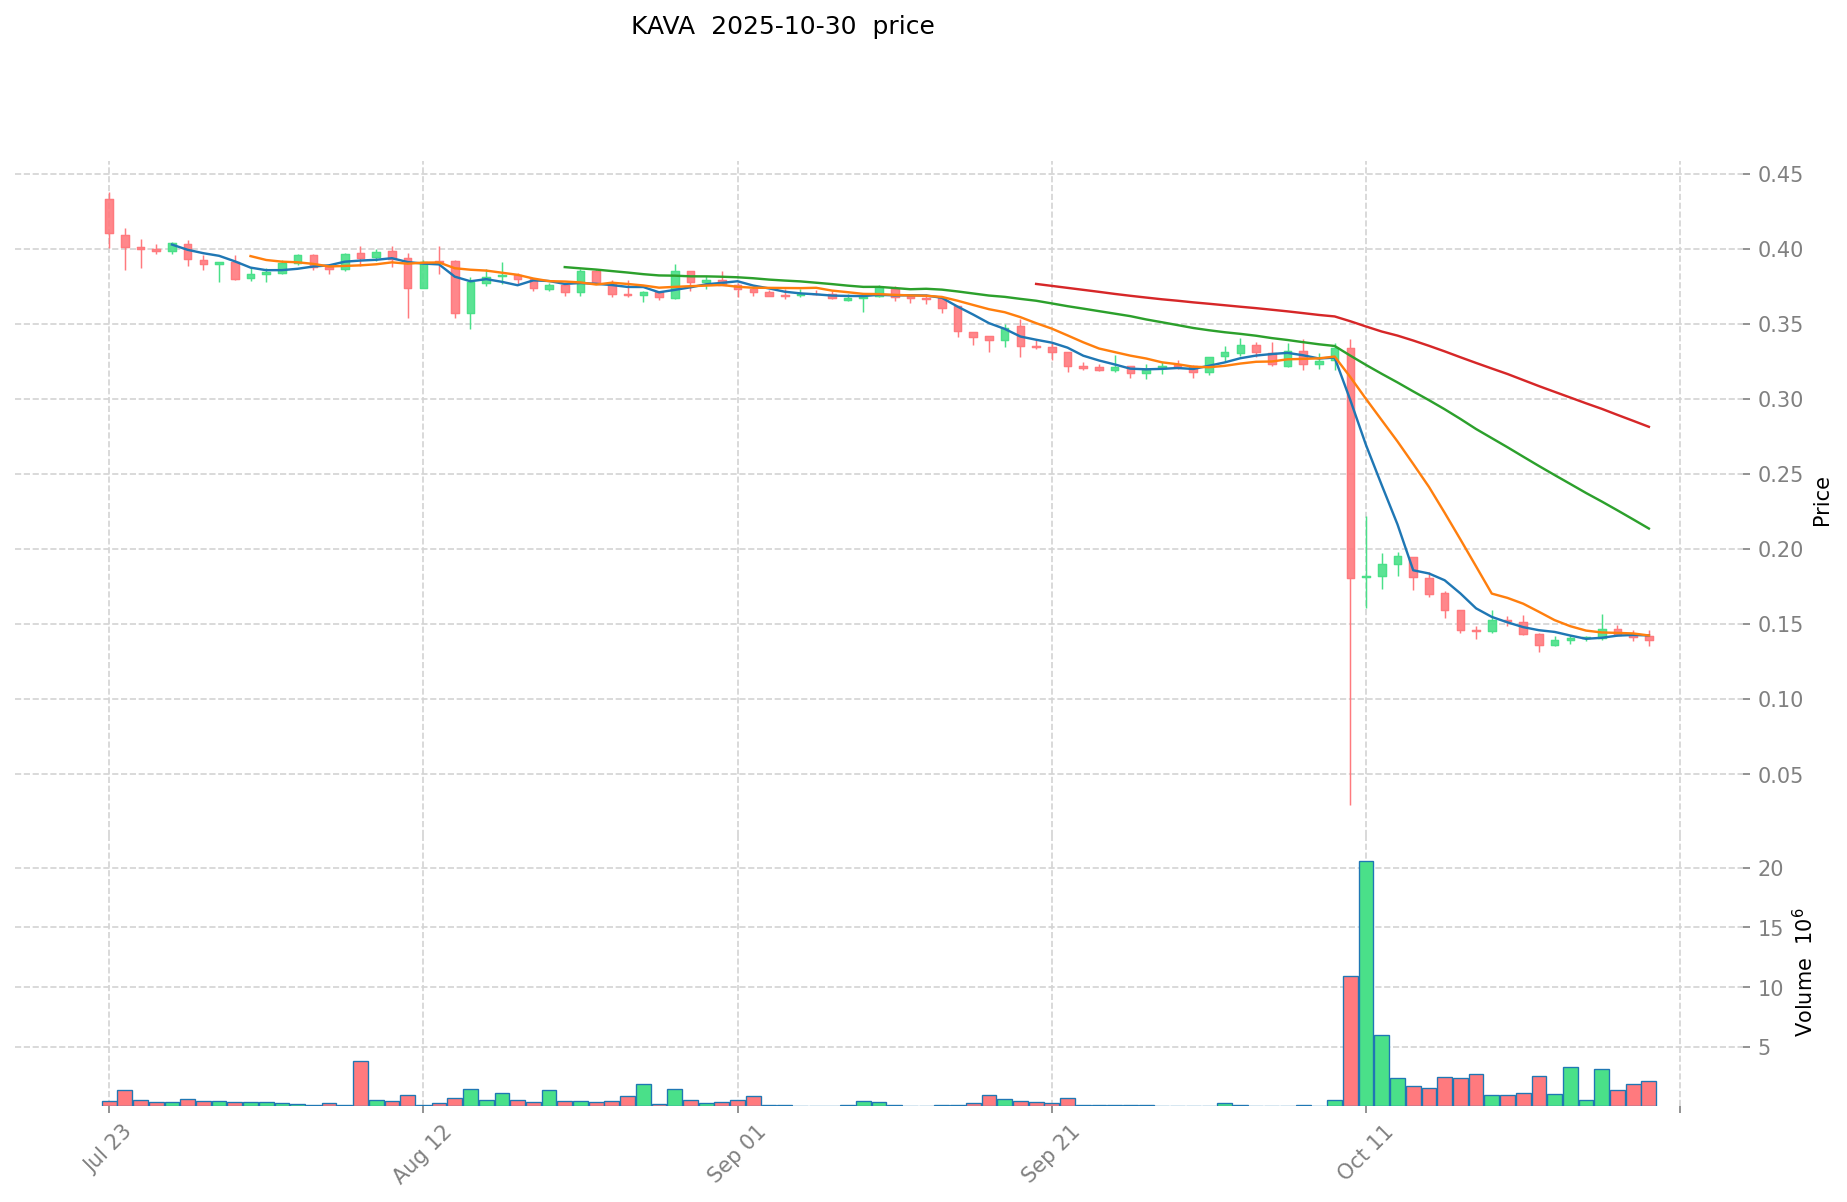
- 2021: KAVA hit its peak price of $9.12, followed by a substantial drop.
- Comparative analysis: During the recent market cycle, ARTEM fell from $0.101077 to a low of $0.00101022, while KAVA declined from $9.12 to $0.13247.
Current Market Situation (2025-10-30)
- ARTEM current price: $0.001498
- KAVA current price: $0.13679
- 24-hour trading volume: ARTEM $32,824.29 vs KAVA $338,840.59
- Market Sentiment Index (Fear & Greed Index): 34 (Fear)
Click to view real-time prices:
II. Market Performance Analysis
Market Capitalization Comparison
- ARTEM market cap: $1,498,000
- KAVA market cap: $148,122,753.57
- Analysis: KAVA's market capitalization is significantly larger than ARTEM's, indicating a higher level of investor confidence and market recognition.
Trading Volume and Liquidity
- ARTEM 24h trading volume: $32,824.29
- KAVA 24h trading volume: $338,840.59
- Liquidity analysis: KAVA demonstrates much higher trading volume, suggesting better liquidity and potentially easier entry/exit for traders.
Price Volatility
- ARTEM 24h price change: +0.53%
- KAVA 24h price change: -3.4%
- Volatility comparison: Both tokens show relatively low volatility in the short term, with ARTEM slightly positive and KAVA slightly negative.
III. Project Fundamentals and Development
ARTEM Overview
- Governance token for blue-chip contemporary art and luxury NFT acquisitions
- Collaboration between HOFA (House of Fine Art) and Kreation.io
- Offers staking opportunities in HOFA's DeFi pools and DAO
KAVA Overview
- Cross-chain DeFi platform for lending and stablecoin services
- Supports major digital assets (BTC, XRP, BNB, ATOM, etc.)
- Provides CDP lending platform and cross-chain money market (HARD Protocol)
Recent Developments
- ARTEM: No significant recent developments noted
- KAVA: Continued focus on expanding DeFi services and cross-chain functionality
IV. Investment Considerations
Potential Opportunities
- ARTEM: Unique positioning in the art and luxury NFT market
- KAVA: Established presence in the DeFi sector with cross-chain capabilities
Potential Risks
- ARTEM: Limited market cap and trading volume may lead to higher volatility
- KAVA: Facing strong competition in the crowded DeFi space
Long-term Outlook
- ARTEM: Growth potential tied to the expansion of the digital art and luxury markets
- KAVA: Continued development of DeFi ecosystem and cross-chain solutions
V. Conclusion
Both ARTEM and KAVA operate in different niches within the cryptocurrency space. KAVA appears to have a more established market position with higher liquidity and market capitalization. ARTEM, while having a smaller market presence, offers unique exposure to the art and luxury NFT sectors. Investors should carefully consider their risk tolerance and investment goals when evaluating these tokens.
II. Core Factors Affecting Investment Value of ARTEM vs KAVA
Supply Mechanism Comparison (Tokenomics)
- ARTEM: Different wallets utilize different coin types to avoid transaction history homogenization while minimizing address maintenance costs
- KAVA: Similar trading pattern strategies focused on following major holder movements
- 📌 Historical pattern: Supply mechanisms drive price cycle changes through strategic wallet diversification
Institutional Adoption and Market Applications
- Institutional holdings: Both show evidence of organized trading groups using similar operational methods
- Enterprise adoption: Strategy optimization following major holders' movements has yielded considerable returns
- National policies: Regulatory approaches vary by jurisdiction
Technical Development and Ecosystem Building
- ARTEM technical upgrade: Focuses on transaction history diversification and cost efficiency
- KAVA technical development: Similar strategic approach to market positioning
- Ecosystem comparison: Both demonstrate opportunities in following trading patterns of major holders
Macroeconomic and Market Cycles
- Performance in inflationary environments: Similar trading strategies across market conditions
- Macroeconomic monetary policy: Optimization strategies adapt to changing market conditions
- Geopolitical factors: Trading opportunities persist as similar operational methods are employed by many market participants
III. 2025-2030 Price Prediction: ARTEM vs KAVA
Short-term Forecast (2025)
- ARTEM: Conservative $0.00128828 - $0.001498 | Optimistic $0.001498 - $0.00214214
- KAVA: Conservative $0.1143156 - $0.13609 | Optimistic $0.13609 - $0.1456163
Mid-term Forecast (2027)
- ARTEM may enter a growth phase, with prices estimated at $0.001318094694 - $0.002015909532
- KAVA may enter a bullish market, with prices estimated at $0.1416348849825 - $0.19299698613
- Key drivers: Institutional capital inflow, ETF, ecosystem development
Long-term Forecast (2030)
- ARTEM: Base scenario $0.002364661881036 - $0.003026767207726 | Optimistic scenario $0.003026767207726+
- KAVA: Base scenario $0.240631132590576 - $0.324852028997277 | Optimistic scenario $0.324852028997277+
View detailed price predictions for ARTEM and KAVA
Disclaimer: This forecast is for informational purposes only and should not be considered as financial advice. Cryptocurrency markets are highly volatile and unpredictable. Always conduct your own research before making any investment decisions.
ARTEM:
| 年份 |
预测最高价 |
预测平均价格 |
预测最低价 |
涨跌幅 |
| 2025 |
0.00214214 |
0.001498 |
0.00128828 |
0 |
| 2026 |
0.0020566791 |
0.00182007 |
0.0010738413 |
21 |
| 2027 |
0.002015909532 |
0.00193837455 |
0.001318094694 |
29 |
| 2028 |
0.0025702846533 |
0.001977142041 |
0.00160148505321 |
31 |
| 2029 |
0.002455610414922 |
0.00227371334715 |
0.001728022143834 |
51 |
| 2030 |
0.003026767207726 |
0.002364661881036 |
0.00132421065338 |
57 |
KAVA:
| 年份 |
预测最高价 |
预测平均价格 |
预测最低价 |
涨跌幅 |
| 2025 |
0.1456163 |
0.13609 |
0.1143156 |
0 |
| 2026 |
0.1704323115 |
0.14085315 |
0.098597205 |
2 |
| 2027 |
0.19299698613 |
0.15564273075 |
0.1416348849825 |
13 |
| 2028 |
0.2301022131408 |
0.17431985844 |
0.1063351136484 |
27 |
| 2029 |
0.279051229390752 |
0.2022110357904 |
0.133459283621664 |
47 |
| 2030 |
0.324852028997277 |
0.240631132590576 |
0.223786953309235 |
75 |
IV. Investment Strategy Comparison: ARTEM vs KAVA
Long-term vs Short-term Investment Strategy
- ARTEM: Suitable for investors interested in art and luxury NFT markets, potential long-term growth
- KAVA: Suitable for investors focused on DeFi ecosystems and cross-chain functionality
Risk Management and Asset Allocation
- Conservative investors: ARTEM: 10% vs KAVA: 90%
- Aggressive investors: ARTEM: 30% vs KAVA: 70%
- Hedging tools: Stablecoin allocation, options, cross-currency portfolios
V. Potential Risk Comparison
Market Risk
- ARTEM: Limited liquidity and smaller market cap may lead to higher volatility
- KAVA: Intense competition in the DeFi space could impact market share
Technical Risk
- ARTEM: Scalability, network stability in the NFT ecosystem
- KAVA: Cross-chain security, smart contract vulnerabilities
Regulatory Risk
- Global regulatory policies may have different impacts on both tokens, particularly in the areas of NFTs and DeFi
VI. Conclusion: Which Is the Better Buy?
📌 Investment Value Summary:
- ARTEM advantages: Unique positioning in art and luxury NFT markets, potential for growth in digital collectibles
- KAVA advantages: Established DeFi platform, cross-chain functionality, higher liquidity and market cap
✅ Investment Advice:
- New investors: Consider a smaller allocation to ARTEM for exposure to NFT markets, larger allocation to KAVA for more established DeFi presence
- Experienced investors: Balanced portfolio with both tokens, adjusting based on risk tolerance and market trends
- Institutional investors: Focus on KAVA for its higher liquidity and established market position, consider ARTEM for diversification into digital art markets
⚠️ Risk Warning: The cryptocurrency market is highly volatile. This article does not constitute investment advice.
None
VII. FAQ
Q1: What are the main differences between ARTEM and KAVA?
A: ARTEM is a governance token for blue-chip contemporary art and luxury NFT acquisitions, while KAVA is a cross-chain DeFi platform offering lending and stablecoin services. KAVA has a significantly larger market cap and higher trading volume compared to ARTEM.
Q2: Which token has shown better price performance recently?
A: As of 2025-10-30, ARTEM has shown a slightly positive 24-hour price change of +0.53%, while KAVA has experienced a slight decline of -3.4%. However, long-term performance and market trends should be considered for a comprehensive evaluation.
Q3: What are the potential risks associated with investing in ARTEM and KAVA?
A: ARTEM risks include limited market cap and trading volume, which may lead to higher volatility. KAVA faces strong competition in the crowded DeFi space. Both tokens are subject to general cryptocurrency market risks, regulatory uncertainties, and technical challenges.
Q4: How do the long-term price predictions compare for ARTEM and KAVA?
A: By 2030, the base scenario predicts ARTEM prices between $0.002364661881036 and $0.003026767207726, while KAVA is projected to be between $0.240631132590576 and $0.324852028997277. However, these predictions are speculative and should not be considered as financial advice.
Q5: What factors should investors consider when choosing between ARTEM and KAVA?
A: Investors should consider their risk tolerance, investment goals, interest in specific sectors (art/NFTs vs. DeFi), market liquidity, project fundamentals, and potential for growth. KAVA may be more suitable for those seeking established DeFi exposure, while ARTEM offers unique access to the digital art and luxury markets.
Q6: How do institutional adoption and market applications differ between ARTEM and KAVA?
A: Both tokens show evidence of organized trading groups using similar operational methods. KAVA, with its larger market presence, may have more significant institutional adoption in the DeFi space. ARTEM's adoption is more closely tied to the art and luxury NFT markets.
* The information is not intended to be and does not constitute financial advice or any other recommendation of any sort offered or endorsed by Gate.


