This comprehensive analysis compares ASTR and QNT, two distinct blockchain infrastructure tokens serving different market segments within the Web3 ecosystem. ASTR, launched in 2022, focuses on multi-chain interoperability and web3 adoption through bridging the Astar Network and Soneium, currently ranked #374 with a $92.54M market cap. QNT, introduced in 2018, positions itself as an enterprise-grade blockchain operating system through Overledger technology, serving governments and regulators, with a market cap of $1.21B at #75 ranking. The article examines historical price trends, institutional adoption patterns, tokenomics, technical development, and 2026-2031 price forecasts to guide investment decisions. Key findings reveal QNT offers superior liquidity, established institutional partnerships including the Inter-American Development Bank, and lower volatility exposure suitable for conservative investors allocating 70-80% QNT. Conversely, ASTR presents higher growth potential for aggressive investors but exh
Introduction: Investment Comparison Between ASTR and QNT
In the cryptocurrency market, the comparison between ASTR vs QNT remains a recurring topic among investors. Both assets exhibit notable differences in market cap ranking, application scenarios, and price performance, representing distinct positioning within the crypto asset landscape.
ASTR (Astar Token): Launched in 2022, ASTR has gained market recognition through its role in bridging Astar Network and Soneium ecosystems, focusing on web3 adoption and multi-chain interoperability.
QNT (Quant): Since its introduction in 2018, QNT has been positioned as a blockchain interoperability solution provider through its Overledger operating system, serving enterprises, regulators, and governments.
This article provides a comprehensive analysis of ASTR vs QNT investment value comparison, examining historical price trends, supply mechanisms, institutional adoption, technical ecosystems, and future outlook. We aim to address the key question that concerns investors most:
"Which asset presents more compelling characteristics for current market conditions?"
By evaluating metrics including market capitalization (ASTR ranked #374 with $92.54M market cap vs QNT ranked #75 with $1.21B market cap as of January 17, 2026), circulating supply dynamics, and ecosystem development trajectories, this analysis offers data-driven insights into both tokens' respective value propositions within the evolving blockchain infrastructure landscape.
I. Historical Price Comparison and Current Market Status
ASTR (Coin A) and QNT (Coin B) Historical Price Trends
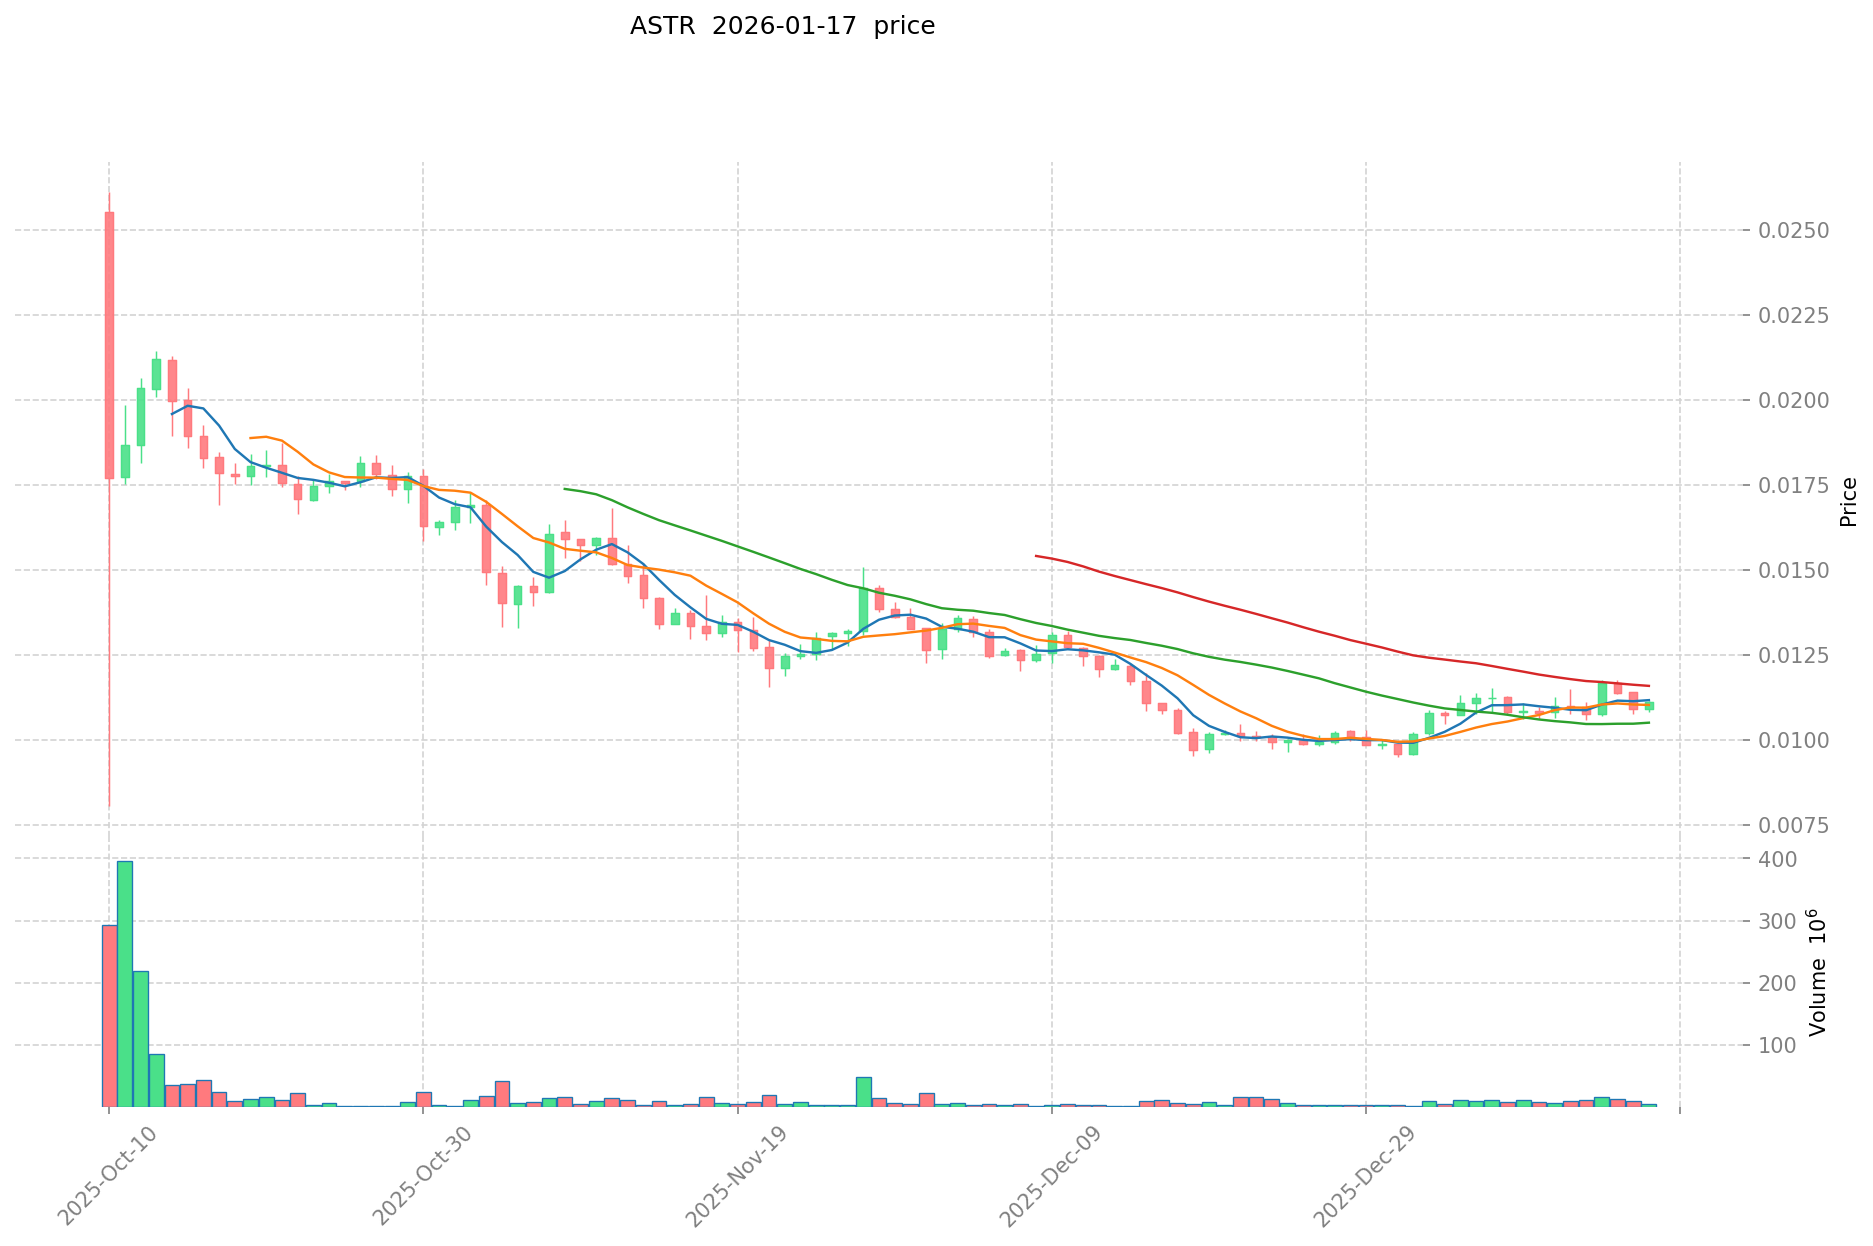
- 2022: ASTR reached a notable price level of $0.421574 on January 17, 2022, reflecting heightened market interest during that period.
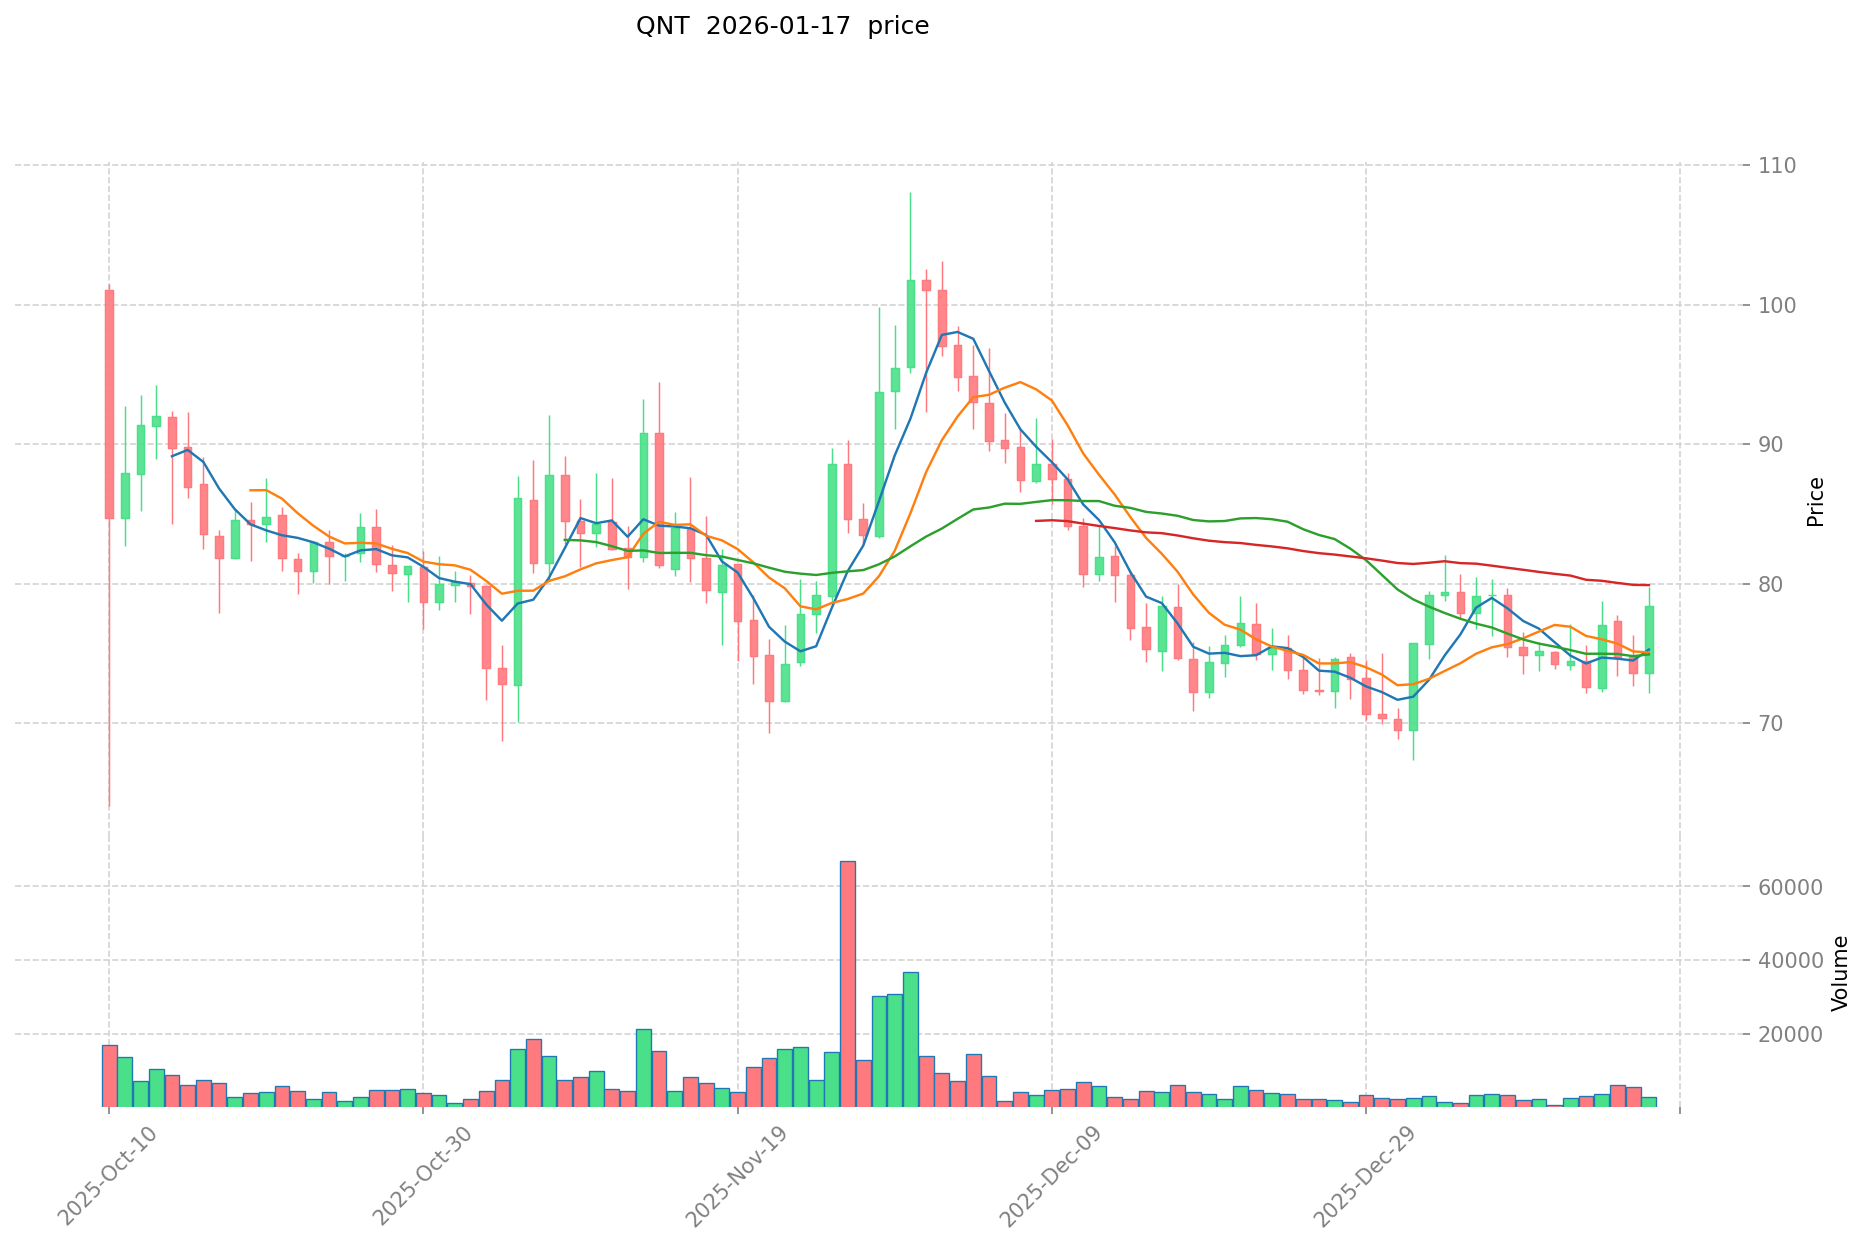
- 2021: QNT experienced significant price movement, with its historical high recorded at $427.42 on September 11, 2021, driven by growing adoption and institutional interest.
- Comparative analysis: During the market cycle spanning 2021-2026, ASTR declined from its historical high of $0.421574 to a low of $0.00948783 recorded on January 1, 2026, representing substantial volatility. In contrast, QNT decreased from its peak of $427.42 to $0.215773 on August 23, 2018, followed by a recovery trajectory that positioned it at higher price levels compared to its lowest point.
Current Market Status (2026-01-17)
- ASTR current price: $0.01118
- QNT current price: $83.22
- 24-hour trading volume: ASTR recorded $42,815.10 compared to QNT's $820,654.08
- Market sentiment index (Fear & Greed Index): 50 (Neutral)
View real-time prices:
- Check ASTR current price Market Price
- Check QNT current price Market Price
II. Core Factors Influencing ASTR vs QNT Investment Value
Supply Mechanism Comparison (Tokenomics)
- ASTR: The supply mechanism details were not extensively covered in the available materials. The token appears to be associated with ecosystem development projects.
- QNT: Specific supply mechanism information was not detailed in the provided materials, though the token is noted for its Overledger technology infrastructure.
- 📌 Historical Pattern: Supply mechanisms can influence price cycles through scarcity dynamics and token release schedules, though specific historical data for these tokens was not available in the materials.
Institutional Adoption and Market Application
- Institutional Holdings: QNT has demonstrated institutional engagement through its partnership with the Inter-American Development Bank, focusing on distributed ledger technology ecosystem development in Latin America and the Caribbean region.
- Enterprise Adoption: QNT's Overledger technology enables multi-chain application interoperability, positioning it for cross-chain enterprise solutions. ASTR's specific enterprise adoption cases were not detailed in the available materials.
- National Policies: Regulatory attitudes toward these specific tokens across different jurisdictions were not extensively covered in the reference materials.
Technical Development and Ecosystem Building
- ASTR Technical Development: The materials reference ASTR's association with ATAK project development, though specific technical upgrade details were limited.
- QNT Technical Development: QNT's Overledger technology represents a key innovation in blockchain interoperability, enabling applications to operate across multiple blockchain networks.
- Ecosystem Comparison: QNT has established partnerships in the distributed ledger technology space, particularly in Latin American and Caribbean markets. Specific details regarding DeFi, NFT, payment systems, and smart contract implementations for both tokens were not comprehensively covered in the materials.
Macroeconomic Factors and Market Cycles
- Inflation Environment Performance: Specific performance data of ASTR and QNT under inflationary conditions was not available in the provided materials.
- Macroeconomic Monetary Policy: The influence of interest rates and dollar index movements on these specific tokens was not detailed in the reference materials.
- Geopolitical Factors: QNT's focus on cross-border distributed ledger technology solutions may position it for international transaction applications, though specific geopolitical impact assessments were not provided in the materials.
III. 2026-2031 Price Forecast: ASTR vs QNT
Short-term Forecast (2026)
- ASTR: Conservative $0.00974487 - $0.011201 | Optimistic $0.011201 - $0.01467331
- QNT: Conservative $57.4356 - $83.24 | Optimistic $83.24 - $107.3796
Mid-term Forecast (2028-2029)
- ASTR may enter a consolidation phase with estimated price range of $0.0106718591595 - $0.02132325173979
- QNT may enter an expansion phase with estimated price range of $83.4437299 - $143.32687724
- Key drivers: institutional capital inflows, ETF developments, ecosystem growth
Long-term Forecast (2030-2031)
- ASTR: Baseline scenario $0.014428733677257 - $0.020237704378491 | Optimistic scenario $0.021736793591713 - $0.029344671348812
- QNT: Baseline scenario $69.399904735095 - $134.3834518961385 | Optimistic scenario $142.585258819377 - $167.979314870173125
View detailed price predictions for ASTR and QNT
Disclaimer: Price predictions are based on historical data analysis and market modeling. Cryptocurrency markets are highly volatile and subject to various unpredictable factors. These forecasts should not be considered as investment advice. Always conduct thorough research and consult financial professionals before making investment decisions.
ASTR:
| Year |
Predicted High Price |
Predicted Average Price |
Predicted Low Price |
Price Change |
| 2026 |
0.01467331 |
0.011201 |
0.00974487 |
0 |
| 2027 |
0.0163008153 |
0.012937155 |
0.0124196688 |
15 |
| 2028 |
0.0176889720315 |
0.01461898515 |
0.0106718591595 |
30 |
| 2029 |
0.02132325173979 |
0.01615397859075 |
0.00904622801082 |
44 |
| 2030 |
0.021736793591713 |
0.01873861516527 |
0.014428733677257 |
67 |
| 2031 |
0.029344671348812 |
0.020237704378491 |
0.014571147152513 |
81 |
QNT:
| Year |
Predicted High Price |
Predicted Average Price |
Predicted Low Price |
Price Change |
| 2026 |
107.3796 |
83.24 |
57.4356 |
0 |
| 2027 |
101.028388 |
95.3098 |
68.623056 |
14 |
| 2028 |
143.32687724 |
98.169094 |
83.4437299 |
17 |
| 2029 |
131.6153043258 |
120.74798562 |
114.710586339 |
45 |
| 2030 |
142.585258819377 |
126.1816449729 |
69.399904735095 |
51 |
| 2031 |
167.979314870173125 |
134.3834518961385 |
81.973905656644485 |
61 |
IV. Investment Strategy Comparison: ASTR vs QNT
Long-term vs Short-term Investment Strategies
- ASTR: May appeal to investors focused on emerging ecosystem development and web3 adoption narratives, given its association with multi-chain interoperability projects and relatively lower market capitalization positioning.
- QNT: May suit investors seeking exposure to established blockchain infrastructure solutions, particularly those interested in enterprise-grade interoperability technology and institutional adoption trajectories.
Risk Management and Asset Allocation
- Conservative investors: ASTR 20-30% vs QNT 70-80%
- Aggressive investors: ASTR 40-50% vs QNT 50-60%
- Hedging instruments: stablecoin allocation, options strategies, cross-asset portfolio construction
V. Potential Risk Comparison
Market Risk
- ASTR: Exhibits higher volatility characteristics with 24-hour trading volume of $42,815.10 and current market cap ranking at #374, indicating lower liquidity compared to larger cap assets.
- QNT: Demonstrates relatively established market presence with 24-hour trading volume of $820,654.08 and market cap ranking at #75, though remains subject to broader cryptocurrency market cycles.
Technical Risk
- ASTR: Scalability considerations and network stability factors associated with emerging multi-chain ecosystem development.
- QNT: Technology concentration considerations related to Overledger infrastructure dependencies and potential security considerations inherent in cross-chain interoperability solutions.
Regulatory Risk
- Global regulatory frameworks continue to evolve regarding blockchain interoperability solutions and ecosystem tokens, potentially affecting both assets differently based on their respective use cases and institutional adoption patterns.
VI. Conclusion: Which Is the Better Buy?
📌 Investment Value Summary:
- ASTR advantages: Lower entry price point at $0.01118, positioning within emerging web3 and multi-chain narratives, potential for ecosystem expansion.
- QNT advantages: Established institutional partnerships including collaboration with the Inter-American Development Bank, proven Overledger technology infrastructure, higher market capitalization at $1.21B indicating greater market recognition.
✅ Investment Recommendations:
- Novice investors: Consider allocating toward QNT given its more established market position and institutional adoption trajectory, while maintaining appropriate position sizing relative to overall portfolio risk tolerance.
- Experienced investors: May evaluate portfolio diversification across both assets based on risk appetite, with consideration for ASTR's higher volatility profile and QNT's infrastructure positioning.
- Institutional investors: QNT may align with enterprise blockchain infrastructure allocation strategies, particularly for portfolios focused on interoperability solutions and regulatory-compliant distributed ledger technology applications.
⚠️ Risk Disclaimer: Cryptocurrency markets exhibit extreme volatility. This analysis does not constitute investment advice.
VII. FAQ
Q1: Which cryptocurrency has stronger institutional backing - ASTR or QNT?
QNT demonstrates significantly stronger institutional adoption. QNT has established partnerships with major organizations including the Inter-American Development Bank, focusing on distributed ledger technology ecosystem development across Latin America and the Caribbean. Its Overledger technology infrastructure has positioned it as an enterprise-grade blockchain interoperability solution serving governments, regulators, and corporate entities. In contrast, ASTR's institutional engagement details remain limited in available public information, with its primary focus on emerging web3 adoption narratives and multi-chain ecosystem development.
Q2: What are the key differences in market liquidity between ASTR and QNT?
QNT exhibits substantially higher market liquidity compared to ASTR. As of January 17, 2026, QNT recorded 24-hour trading volume of $820,654.08 with a market cap ranking of #75 ($1.21B), while ASTR showed 24-hour volume of only $42,815.10 with a market cap ranking of #374 ($92.54M). This approximately 19x difference in trading volume indicates that QNT offers significantly better liquidity for entry and exit positions, reduced slippage during transactions, and greater market depth for larger trade executions.
Q3: How do the historical price performances of ASTR and QNT compare?
Both assets have experienced substantial volatility with different trajectory patterns. ASTR reached its historical high of $0.421574 on January 17, 2022, subsequently declining to $0.00948783 by January 1, 2026 - representing a decline of approximately 97.7% from its peak. QNT achieved its all-time high of $427.42 on September 11, 2021, and while it has also declined from its peak, it maintained relatively stronger price levels at $83.22 as of January 17, 2026 - approximately 80.5% below its historical high but demonstrating more resilient price recovery compared to ASTR's trajectory.
Q4: Which token offers better risk-adjusted returns for conservative investors?
QNT appears more suitable for conservative investors based on multiple risk-adjusted factors. Conservative portfolio allocation recommendations suggest 70-80% QNT versus 20-30% ASTR for risk-averse investors. This positioning is supported by QNT's higher market capitalization ($1.21B vs $92.54M), superior liquidity metrics, established institutional partnerships, and proven technology infrastructure through its Overledger operating system. ASTR's lower market cap ranking (#374) and significantly lower trading volumes indicate higher volatility exposure and greater liquidity risk - characteristics typically misaligned with conservative investment mandates.
Q5: What are the primary use cases that differentiate ASTR from QNT?
The tokens serve distinctly different blockchain infrastructure purposes. QNT's Overledger technology functions as a blockchain operating system enabling multi-chain application interoperability, specifically targeting enterprise solutions, regulatory compliance frameworks, and cross-border distributed ledger applications for governments and financial institutions. ASTR focuses on bridging the Astar Network and Soneium ecosystems, emphasizing web3 adoption initiatives and multi-chain interoperability at the application layer rather than the enterprise infrastructure layer. This fundamental difference positions QNT toward B2B enterprise markets while ASTR targets broader web3 ecosystem development.
Q6: How do the 2026-2031 price forecasts differ between ASTR and QNT?
The long-term price projections show divergent growth trajectories with different risk-reward profiles. For 2031, ASTR's baseline scenario projects $0.014428733677257 - $0.020237704378491 (optimistic: $0.021736793591713 - $0.029344671348812), representing potential gains of 81% from current levels. QNT's 2031 baseline scenario forecasts $69.399904735095 - $134.3834518961385 (optimistic: $142.585258819377 - $167.979314870173125), indicating potential growth of 61% from current prices. While ASTR shows higher percentage growth potential, QNT's forecasts reflect more stable absolute value appreciation from a significantly higher base price and market capitalization.
Q7: What regulatory considerations should investors evaluate when choosing between ASTR and QNT?
Regulatory positioning differs significantly between these assets due to their distinct use cases. QNT's focus on enterprise blockchain infrastructure and partnerships with governmental organizations like the Inter-American Development Bank positions it within regulatory-compliant distributed ledger technology frameworks, potentially offering advantages as global cryptocurrency regulations evolve toward institutional adoption standards. ASTR's positioning within web3 ecosystem development and multi-chain applications may face different regulatory scrutiny depending on jurisdictions' approaches to decentralized application platforms. However, specific regulatory treatment for both tokens remains subject to evolving global frameworks regarding blockchain interoperability solutions and ecosystem tokens.
Q8: Which cryptocurrency presents better portfolio diversification characteristics?
For diversification purposes, both tokens offer distinct correlation profiles within a broader cryptocurrency portfolio. QNT provides exposure to enterprise blockchain infrastructure and institutional adoption themes, potentially correlating more closely with technology infrastructure assets and showing some defensive characteristics during market downturns due to its utility focus. ASTR offers exposure to emerging web3 narratives and multi-chain ecosystem development, likely exhibiting higher beta characteristics and stronger correlation with broader altcoin market cycles. Experienced investors may consider allocation across both assets (40-50% ASTR vs 50-60% QNT for aggressive profiles) to capture different blockchain infrastructure development themes while managing concentration risk.
* The information is not intended to be and does not constitute financial advice or any other recommendation of any sort offered or endorsed by Gate.