This comprehensive comparison examines AURASOL and ZIL as distinct investment assets in the cryptocurrency market. AURASOL, a community-driven memecoin launched on Solana in May 2024, ranks #820 with extreme volatility, while ZIL, an established blockchain infrastructure platform since 2018, ranks #356 with focus on scalability through sharding technology. The article analyzes historical price trends, market capitalization differences ($22.9M vs $100.5M), and trading volume disparities, revealing AURASOL's 94% price swing versus ZIL's 75% annual decline. Investors learn portfolio allocation strategies based on risk tolerance, price projection scenarios through 2031, and distinct risk profiles ranging from regulatory considerations to technical infrastructure maturity. Whether seeking speculative memecoin exposure or established blockchain solutions, readers gain actionable insights for evaluating these assets on Gate and developing informed investment strategies aligned with their risk-return objectives.
Introduction: Investment Comparison Between AURASOL and ZIL
In the cryptocurrency market, the comparison between AURASOL and ZIL continues to be a topic that investors cannot overlook. The two assets demonstrate notable differences in market capitalization ranking, application scenarios, and price performance, while representing distinct positions within the crypto asset landscape.
AURATSOL (AURASOL): Launched in May 2024, this memecoin on the Solana blockchain has gained market attention by capturing the viral "aura" concept popularized on social media platforms. With a current market cap ranking of 820 and a circulating supply of approximately 963 million tokens, it represents the community-driven memecoin sector.
Zilliqa (ZIL): Since its launch in January 2018, Zilliqa has established itself as a high-throughput public blockchain platform. Currently ranked 356 by market capitalization with a circulating supply of over 19.6 billion tokens, it focuses on solving transaction speed and scalability challenges through sharding technology.
This article will provide a comprehensive analysis of the investment value comparison between AURASOL and ZIL, examining historical price trends, supply mechanisms, technical ecosystems, and future outlooks. We aim to address the question that concerns investors most:
"Which asset presents different risk-return profiles for consideration?"
By exploring these fundamental aspects, readers can gain insights into how these two distinct cryptocurrencies—one a community-driven memecoin and the other a technology-focused blockchain platform—fit into different investment strategies and risk tolerances.
I. Historical Price Comparison and Current Market Overview
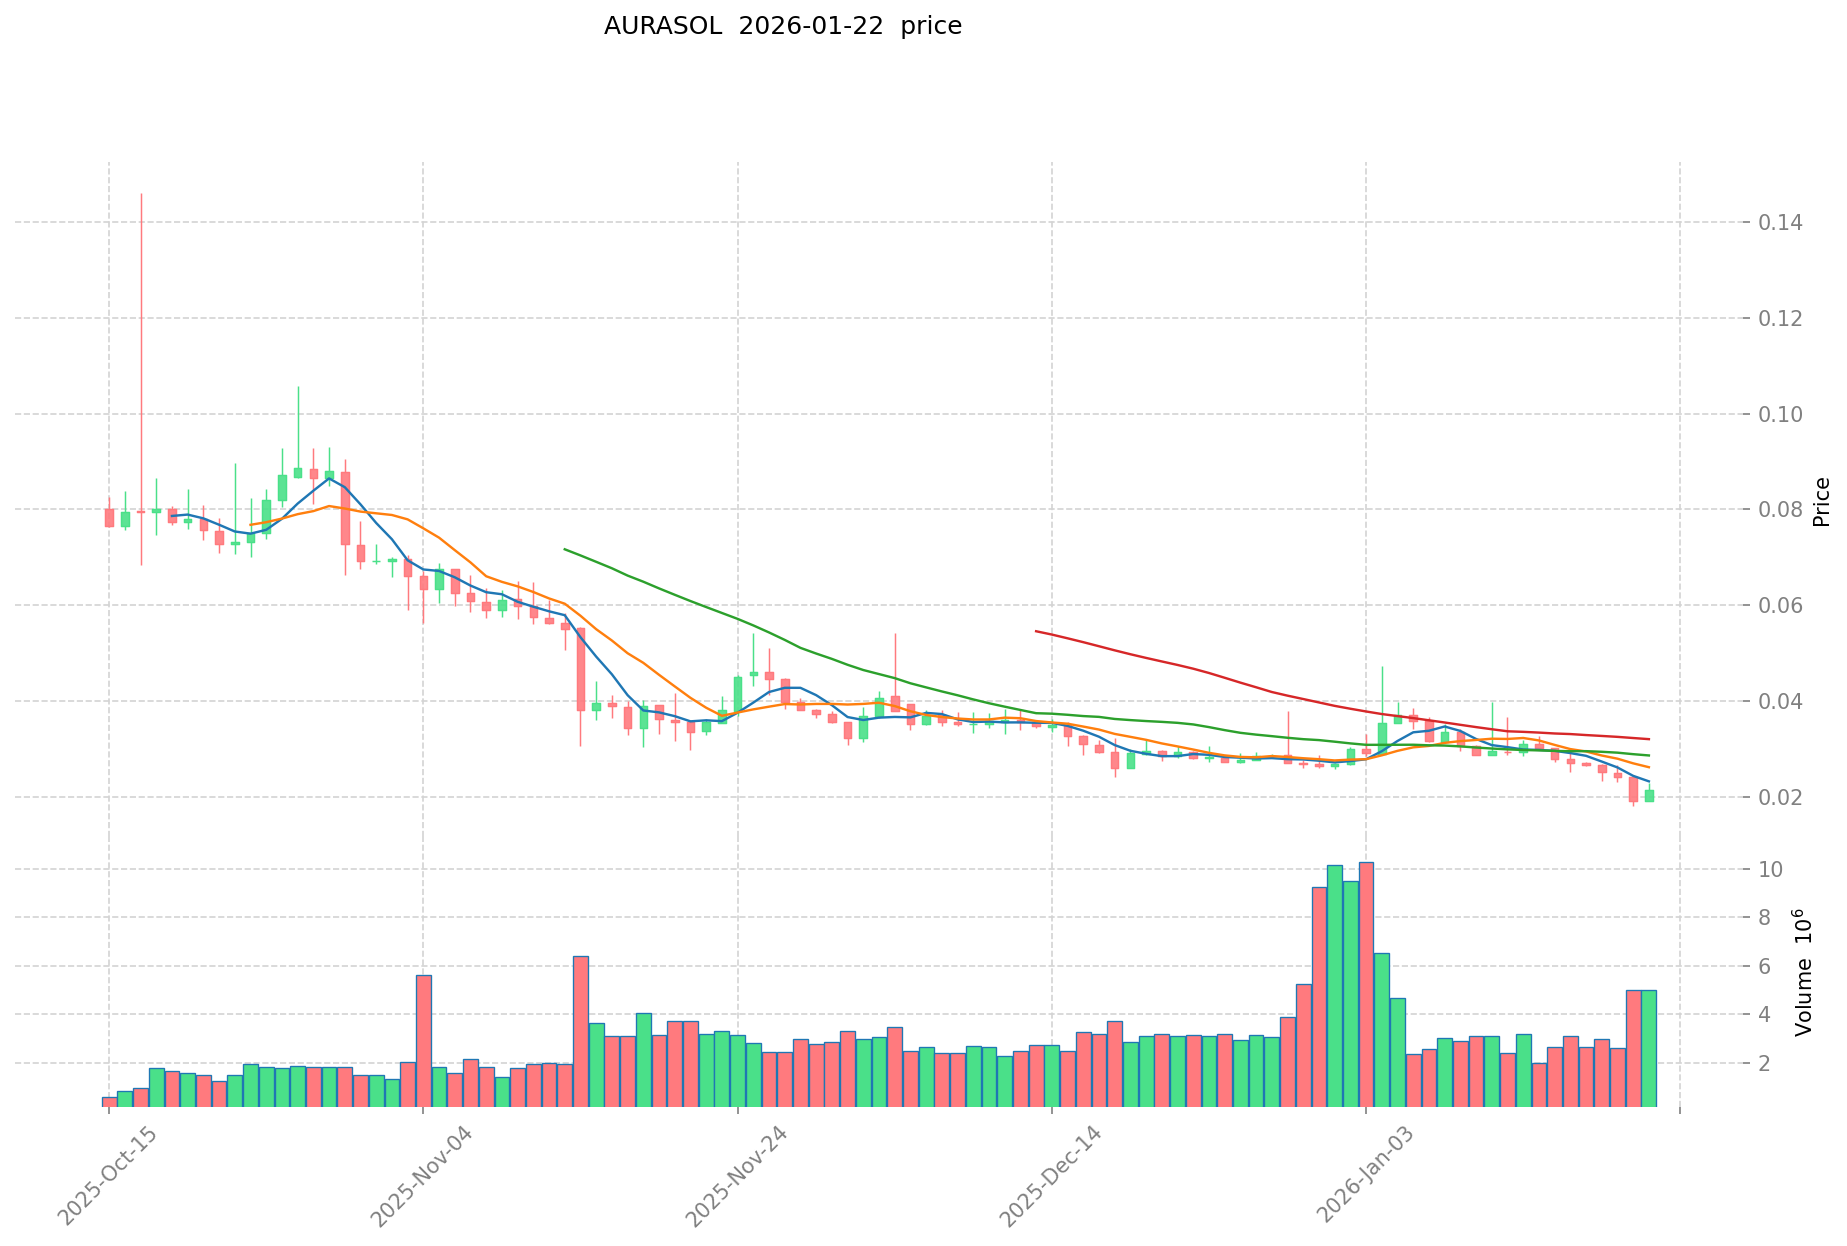
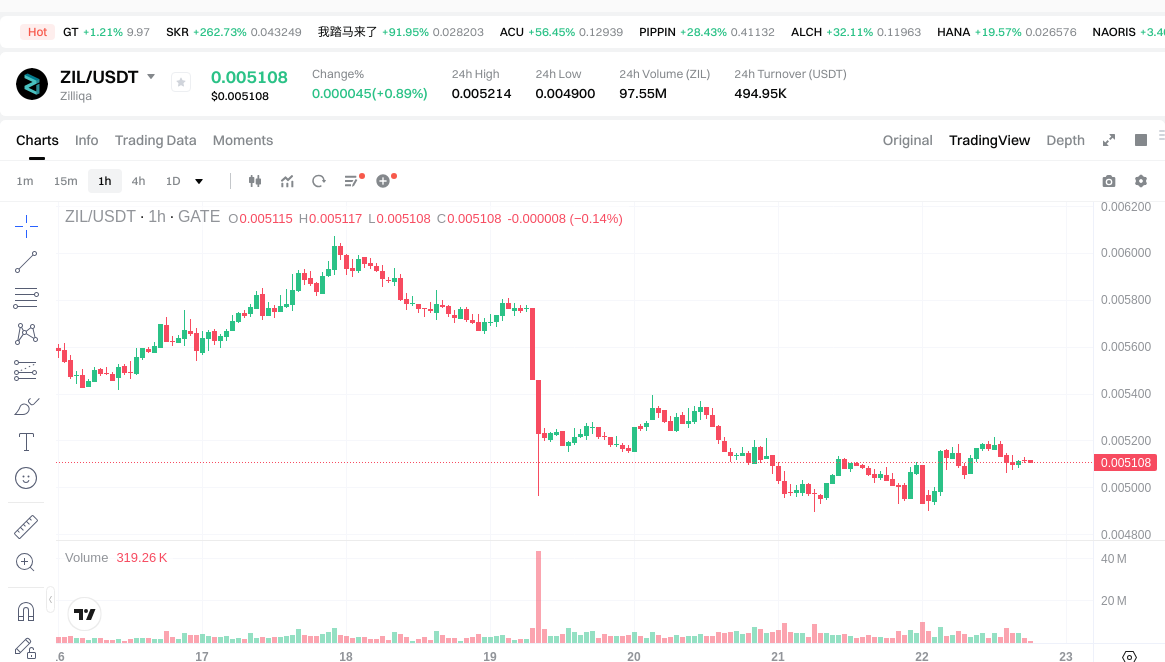
AURASOL (Coin A) and ZIL (Coin B) Historical Price Trends
- 2021: ZIL experienced notable price movement, with the token reaching its all-time high of $0.255376 on May 7, 2021, reflecting broader market momentum during that period.
- 2024: AURASOL launched on May 30, 2024, with subsequent price discovery leading to an all-time high of $0.29951 on June 18, 2025.
- 2025-2026: AURASOL recorded its all-time low of $0.01807 on January 20, 2026, while ZIL's historical low of $0.00239616 was established on March 13, 2020.
- Comparative Analysis: AURASOL has experienced significant volatility since its launch, with price fluctuations between $0.29951 and $0.01807 within approximately eight months. In contrast, ZIL has demonstrated a longer trading history with its peak occurring in 2021 and experiencing a decline of 75.08% over the past year.
Current Market Status (January 22, 2026)
- AURASOL current price: $0.02381
- ZIL current price: $0.005114
- 24-hour trading volume: AURASOL $106,103.95 vs ZIL $495,042.36
- Market capitalization: AURASOL $22,935,827.08 (ranking #820) vs ZIL $100,521,871.82 (ranking #356)
- Market sentiment index (Fear & Greed Index): 20 (Extreme Fear)
- 24-hour price change: AURASOL +16.36% vs ZIL +0.65%
View real-time prices:
II. Core Factors Affecting the Investment Value of AURASOL vs ZIL
Supply Mechanism Comparison (Tokenomics)
Due to the absence of detailed supply mechanism information in the provided materials, a comprehensive comparison of the tokenomics between AURASOL and ZIL cannot be conducted at this time. Investors should independently research the specific supply models, emission schedules, and any deflationary or inflationary characteristics of each asset before making investment decisions.
Institutional Adoption and Market Application
Without specific data on institutional holdings, enterprise adoption cases, or regulatory frameworks from different jurisdictions regarding AURASOL and ZIL, a detailed comparative analysis of their institutional acceptance and practical applications in cross-border payments, settlement systems, or investment portfolios cannot be provided. Market participants are encouraged to monitor official announcements and verified reports for updates on institutional involvement.
Technology Development and Ecosystem Construction
The reference materials do not contain information regarding recent or planned technical upgrades for either AURASOL or ZIL, nor do they provide details on their respective ecosystem developments in areas such as DeFi, NFT platforms, payment solutions, or smart contract implementations. A thorough evaluation of technological roadmaps and ecosystem maturity would require additional research beyond the current dataset.
Macroeconomic Environment and Market Cycles
In the absence of historical performance data or analytical frameworks comparing how AURASOL and ZIL respond to inflationary pressures, monetary policy shifts (such as interest rate changes or US Dollar Index movements), or geopolitical developments affecting cross-border transaction demand, no conclusive assessment can be made regarding their relative performance under various macroeconomic scenarios. Investors should consider consulting broader market research and economic indicators when evaluating these assets.
III. 2026-2031 Price Prediction: AURASOL vs ZIL
Short-term Forecast (2026)
- AURASOL: Conservative $0.0225625 - $0.02375 | Optimistic $0.02375 - $0.02945
- ZIL: Conservative $0.00444396 - $0.005108 | Optimistic $0.005108 - $0.0061296
Mid-term Forecast (2028-2029)
- AURASOL may enter a moderate growth phase, with projected prices ranging from $0.02333352 to $0.03093048 in 2028, potentially extending to $0.015967182 - $0.0322246764 by 2029
- ZIL may experience gradual expansion, with estimated prices between $0.00355557664 and $0.00774607768 in 2028, possibly reaching $0.0035943070284 - $0.00880957605 in 2029
- Key drivers: institutional capital flows, ETF developments, ecosystem growth
Long-term Forecast (2030-2031)
- AURASOL: Baseline scenario $0.026340044052 - $0.0306279582 (2030) | Optimistic scenario $0.02226499421349 - $0.0465238685058 (2031)
- ZIL: Baseline scenario $0.00547074672705 - $0.007928618445 (2030) | Optimistic scenario $0.008380946127287 - $0.013871910831372 (2031)
View detailed price predictions for AURASOL and ZIL
Disclaimer
AURASOL:
| Year |
Predicted High Price |
Predicted Average Price |
Predicted Low Price |
Price Change |
| 2026 |
0.02945 |
0.02375 |
0.0225625 |
0 |
| 2027 |
0.027664 |
0.0266 |
0.014896 |
11 |
| 2028 |
0.03093048 |
0.027132 |
0.02333352 |
13 |
| 2029 |
0.0322246764 |
0.02903124 |
0.015967182 |
21 |
| 2030 |
0.035834711094 |
0.0306279582 |
0.026340044052 |
28 |
| 2031 |
0.0465238685058 |
0.033231334647 |
0.02226499421349 |
39 |
ZIL:
| Year |
Predicted High Price |
Predicted Average Price |
Predicted Low Price |
Price Change |
| 2026 |
0.0061296 |
0.005108 |
0.00444396 |
0 |
| 2027 |
0.007079688 |
0.0056188 |
0.005281672 |
9 |
| 2028 |
0.00774607768 |
0.006349244 |
0.00355557664 |
24 |
| 2029 |
0.00880957605 |
0.00704766084 |
0.0035943070284 |
37 |
| 2030 |
0.01133792437635 |
0.007928618445 |
0.00547074672705 |
55 |
| 2031 |
0.013871910831372 |
0.009633271410675 |
0.008380946127287 |
88 |
IV. Investment Strategy Comparison: AURASOL vs ZIL
Long-term vs Short-term Investment Strategies
- AURASOL: May appeal to investors with higher risk tolerance who are interested in community-driven memecoin projects and speculative opportunities in emerging tokens with significant volatility patterns
- ZIL: May be considered by investors seeking exposure to established blockchain infrastructure projects with longer operational history and focus on scalability solutions through sharding technology
Risk Management and Asset Allocation
- Conservative investors: AURASOL 10-15% vs ZIL 20-30%
- Aggressive investors: AURASOL 25-35% vs ZIL 30-40%
- Hedging tools: stablecoin allocation, options contracts, cross-asset portfolio diversification
V. Potential Risk Comparison
Market Risk
- AURASOL: Characterized by substantial price volatility since launch in May 2024, with movements between $0.29951 and $0.01807 within approximately eight months; lower market capitalization ranking (#820) suggests higher susceptibility to market sentiment shifts and liquidity constraints
- ZIL: Demonstrated historical volatility with a 75.08% decline over the past year; mid-tier market capitalization ranking (#356) indicates moderate exposure to broader market cycles and sentiment changes, as reflected in the current Extreme Fear index reading of 20
Technical Risk
- AURASOL: Limited operational history since May 2024 launch may present uncertainties regarding network stability and long-term technical development trajectory
- ZIL: As an established blockchain platform since January 2018, considerations include ongoing scalability implementation, network performance under high transaction loads, and potential security considerations inherent in sharding architecture
Regulatory Risk
- Global regulatory developments may affect both assets differently based on their classifications: memecoin projects versus infrastructure-focused blockchain platforms; evolving frameworks for digital assets across jurisdictions could influence trading accessibility, compliance requirements, and institutional participation for each token category
VI. Conclusion: Which Presents Different Risk-Return Profiles?
📌 Investment Value Summary:
- AURASOL characteristics: Community-driven memecoin with shorter operational history, higher volatility profile, lower market capitalization, and recent positive 24-hour performance (+16.36%)
- ZIL characteristics: Established blockchain infrastructure project with longer operational track record since 2018, focus on scalability through sharding technology, mid-tier market capitalization ranking, and more modest recent price movement (+0.65%)
✅ Considerations for Different Investor Types:
- Newer market participants: May benefit from thorough research into fundamental differences between memecoin projects and infrastructure-focused blockchains; consider starting with smaller position sizes and diversified portfolios including stablecoin allocations
- Experienced market participants: Could evaluate portfolio allocation based on risk tolerance, time horizon, and strategic preferences between speculative memecoin exposure versus established blockchain infrastructure; consider implementing risk management tools such as position sizing and hedging strategies
- Institutional participants: May focus on regulatory clarity, operational history, technical infrastructure maturity, and liquidity considerations when evaluating both assets within broader digital asset allocation frameworks
⚠️ Risk Disclosure: Cryptocurrency markets exhibit substantial volatility. This content does not constitute investment advice, financial guidance, or recommendations for specific investment decisions.
VII. FAQ
Q1: What are the fundamental differences between AURASOL and ZIL as investment assets?
AURASOL is a community-driven memecoin launched on the Solana blockchain in May 2024, while ZIL (Zilliqa) is an established blockchain infrastructure platform operational since January 2018 that focuses on scalability through sharding technology. AURASOL represents the speculative memecoin sector with a market cap ranking of #820 and approximately 963 million tokens in circulation, whereas ZIL occupies a mid-tier position at #356 with over 19.6 billion tokens circulating. The key distinction lies in their fundamental value propositions: AURASOL derives value from community engagement and viral social media trends, while ZIL's value is tied to its technical solutions for transaction throughput and blockchain scalability challenges.
Q2: How do the volatility profiles of AURASOL and ZIL differ based on historical performance?
AURASOL has demonstrated extreme volatility since its launch, experiencing price fluctuations from an all-time high of $0.29951 (June 18, 2025) to an all-time low of $0.01807 (January 20, 2026) within approximately eight months—representing a swing of over 94%. In contrast, ZIL exhibits a longer trading history with its all-time high of $0.255376 recorded in May 2021 and has experienced a 75.08% decline over the past year. As of January 22, 2026, AURASOL showed a 24-hour price change of +16.36% compared to ZIL's +0.65%, indicating that AURASOL typically experiences more pronounced short-term price movements while ZIL demonstrates relatively more stable daily fluctuations despite significant long-term drawdowns.
Q3: What factors should investors consider when determining portfolio allocation between AURASOL and ZIL?
Portfolio allocation decisions should account for risk tolerance levels, investment time horizons, and strategic objectives. Conservative investors might consider allocating 10-15% to AURASOL versus 20-30% to ZIL, reflecting the higher risk profile of memecoins and the relatively more established nature of infrastructure projects. Aggressive investors with higher risk tolerance might increase exposure to 25-35% for AURASOL and 30-40% for ZIL. Additional considerations include market capitalization differences ($22.9 million for AURASOL vs $100.5 million for ZIL as of January 22, 2026), liquidity constraints indicated by 24-hour trading volumes ($106,103.95 for AURASOL vs $495,042.36 for ZIL), and the current market sentiment reflected in the Fear & Greed Index reading of 20 (Extreme Fear). Implementing risk management tools such as stablecoin allocations, position sizing strategies, and cross-asset diversification can help mitigate concentration risks.
Q4: How do the price predictions for AURASOL and ZIL compare across different time horizons?
Short-term forecasts for 2026 project AURASOL ranging from $0.0225625 to $0.02945, while ZIL is estimated between $0.00444396 and $0.0061296. Mid-term predictions for 2028-2029 suggest AURASOL may reach $0.015967182 to $0.0322246764 by 2029, with ZIL potentially achieving $0.0035943070284 to $0.00880957605 during the same period. Long-term projections for 2030-2031 indicate AURASOL could range from $0.02226499421349 to $0.0465238685058 by 2031, representing a potential 39% price change from baseline, while ZIL may reach $0.008380946127287 to $0.013871910831372, suggesting an 88% price change. These projections reflect different growth trajectories, with ZIL showing higher percentage growth potential over the long term despite lower absolute price targets, while AURASOL demonstrates greater short-term volatility potential but relatively more moderate long-term growth expectations.
Q5: What are the primary regulatory and technical risks associated with each asset?
Regulatory risks differ based on asset classification: AURASOL, as a memecoin, may face evolving regulatory scrutiny regarding its speculative nature and community-driven value proposition, while ZIL, as an infrastructure-focused blockchain platform, confronts regulatory frameworks related to decentralized networks, data handling, and potential securities classifications across different jurisdictions. Technical risks for AURASOL include limited operational history since its May 2024 launch, which creates uncertainties regarding network stability and long-term development trajectory. ZIL's technical considerations involve the complexity of maintaining sharding architecture, network performance under high transaction loads, and ongoing scalability implementation challenges inherent in multi-chain coordination. Both assets are subject to broader market sentiment shifts, as evidenced by the current Extreme Fear index reading of 20, and evolving global regulatory developments that could affect trading accessibility, compliance requirements, and institutional participation.
Q6: How should newer market participants approach investment decisions between AURASOL and ZIL?
Newer market participants should prioritize comprehensive research into the fundamental differences between memecoin projects and infrastructure-focused blockchains before committing capital. Starting with smaller position sizes allows for learning market dynamics while limiting downside exposure, particularly given AURASOL's significant volatility (ranging from $0.29951 to $0.01807 within eight months) and ZIL's 75.08% decline over the past year. Building diversified portfolios that include stablecoin allocations can provide stability during periods of extreme market sentiment, such as the current Extreme Fear environment (index reading of 20). Understanding the distinct value propositions—AURASOL's community-driven memecoin characteristics versus ZIL's technical scalability solutions—enables more informed assessment of risk-return profiles. Additionally, monitoring 24-hour trading volumes ($106,103.95 for AURASOL vs $495,042.36 for ZIL) helps evaluate liquidity constraints and potential execution risks when entering or exiting positions.
Q7: What role do market capitalization rankings play in evaluating investment opportunities between these assets?
Market capitalization rankings provide insights into relative market positioning and liquidity considerations. AURASOL's ranking at #820 with a market cap of approximately $22.9 million indicates lower overall market acceptance and higher susceptibility to liquidity constraints, meaning larger orders may experience significant slippage and price impact. ZIL's mid-tier ranking at #356 with a market cap of $100.5 million suggests greater market depth and more established trading infrastructure, potentially offering improved execution quality for larger position sizes. The substantial difference in rankings (464 positions) reflects varying levels of institutional participation, exchange listing availability, and overall market confidence. Lower-ranked assets like AURASOL typically exhibit higher volatility potential and greater sensitivity to market sentiment shifts, while mid-tier assets like ZIL may demonstrate relatively more stable price action despite still being subject to broader market cycles. These ranking considerations should inform position sizing decisions, with investors potentially allocating smaller percentages to lower-ranked assets to account for increased liquidity risks.
Q8: How do recent price movements inform near-term trading strategies for AURASOL versus ZIL?
The 24-hour price changes as of January 22, 2026—AURASOL +16.36% versus ZIL +0.65%—reveal distinct momentum characteristics that can inform near-term tactical approaches. AURASOL's significantly higher daily volatility suggests opportunities for active trading strategies that capitalize on price swings, though this approach requires careful risk management given the potential for rapid reversals. ZIL's more modest daily movement indicates relatively stable short-term price action that may be more suitable for position-building strategies or longer holding periods. Current prices ($0.02381 for AURASOL and $0.005114 for ZIL) are substantially below their respective all-time highs ($0.29951 and $0.255376), suggesting both assets remain in corrective phases relative to historical peaks. The market sentiment environment (Fear & Greed Index at 20, indicating Extreme Fear) typically precedes periods of either capitulation or accumulation, making near-term trading decisions particularly dependent on broader market catalysts and individual risk tolerance rather than asset-specific fundamentals alone.
* The information is not intended to be and does not constitute financial advice or any other recommendation of any sort offered or endorsed by Gate.