This comprehensive guide compares BAND and BTC as investment options in 2024, analyzing two distinct cryptocurrency assets with different market positions. Bitcoin stands out as the established leader with the highest trading volume ($364.7M daily), institutional adoption from entities like MicroStrategy, and a fixed 21-million-coin supply creating scarcity. BAND serves as emerging data infrastructure for DeFi and AI applications with lower liquidity ($15.4K daily volume). The article examines historical price trends, supply mechanisms, institutional adoption patterns, and technical ecosystems. Price forecasts through 2031 show BTC ranging from $155K-$259K optimistically, while BAND projects $0.31-$0.80. Investment recommendations suggest conservative allocators favor 85-90% BTC allocation for stability, while aggressive investors can increase BAND exposure to 25-30% for emerging protocol exposure. Both assets offer distinct risk-return profiles suitable for different investor objectives.
Introduction: Comparing BAND and BTC as Investment Options
In the cryptocurrency market, the comparison between BAND vs BTC has become a topic of considerable interest among investors. The two assets differ significantly in market capitalization ranking, application scenarios, and price performance, representing distinct positions within the crypto asset landscape.
BAND: Launched in 2019, Band Protocol has positioned itself as a data layer infrastructure that trains AI engines and powers blockchain applications. By enabling developers, institutions, and users to access real-time data with zero counterparty risk, it serves DeFi, GameFi, and AI agents through its open data infrastructure designed for blockchains and large language models.
BTC (Bitcoin): Since its introduction in 2008, Bitcoin has been regarded as digital gold and remains the cryptocurrency with the highest trading volume and market capitalization globally, functioning as a decentralized digital currency based on P2P network technology.
This article will provide a comprehensive analysis of BAND vs BTC investment value comparison, examining historical price trends, supply mechanisms, institutional adoption, technical ecosystems, and future projections. We aim to address the question that concerns investors most:
"Which is the better buy right now?"
I. Historical Price Comparison and Current Market Overview
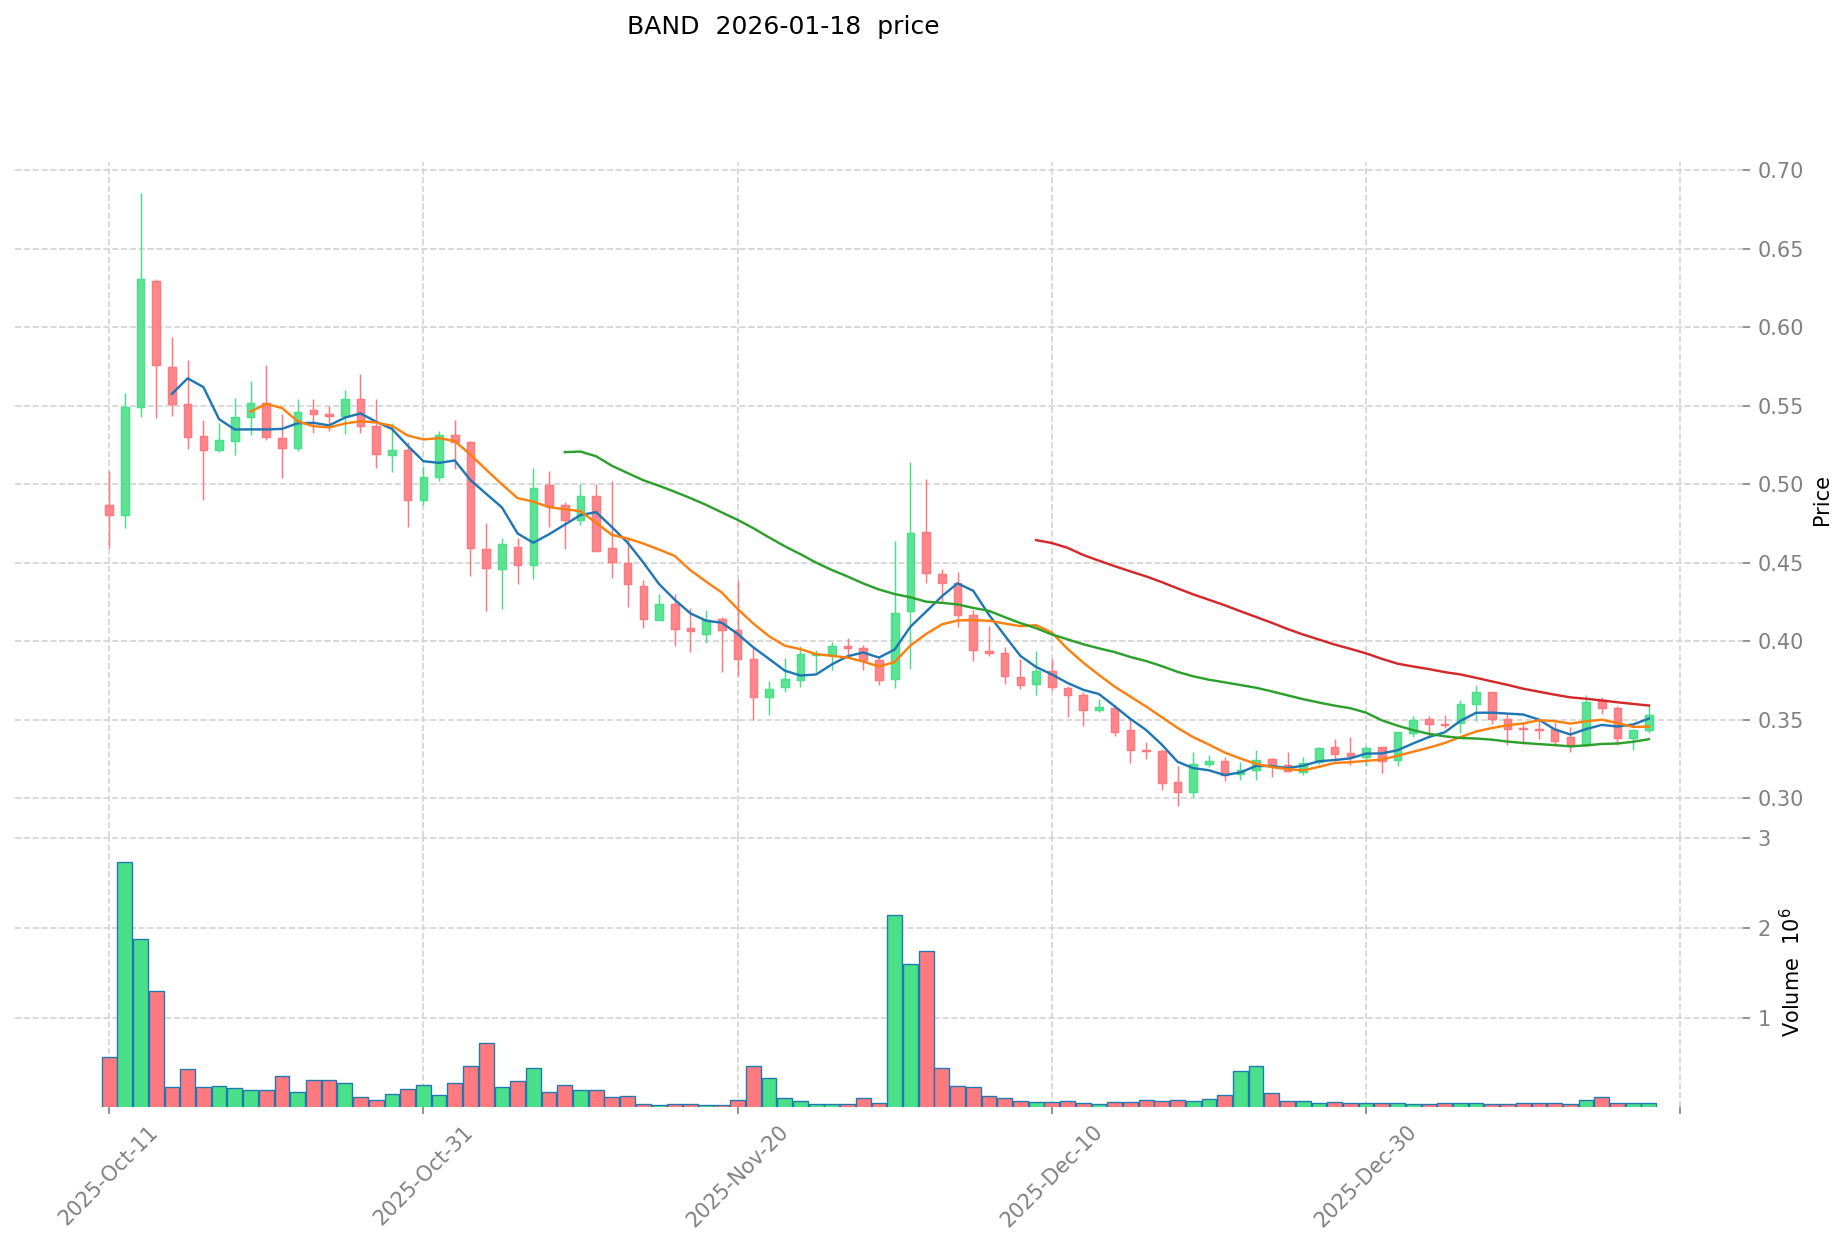
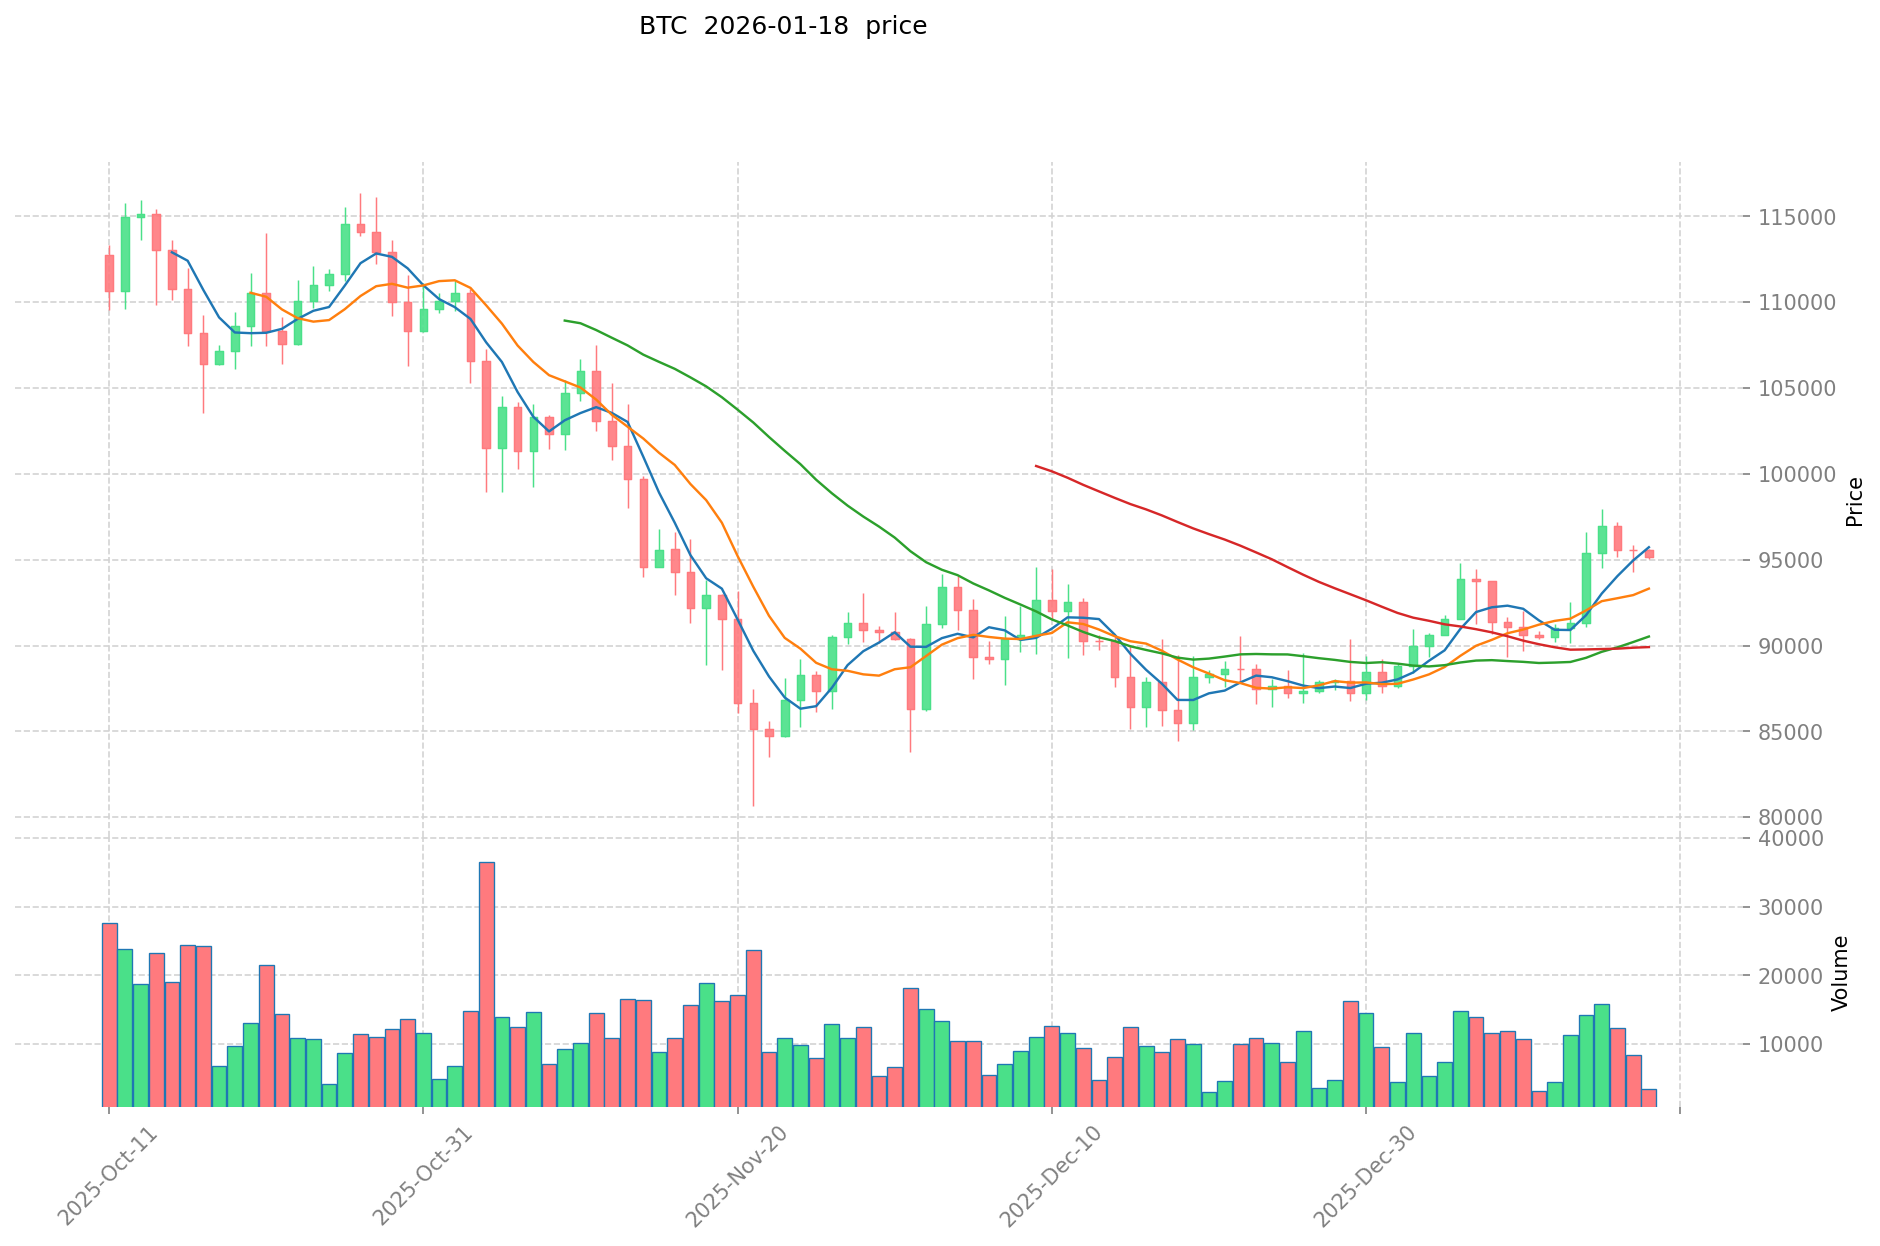
Band (BAND) and Bitcoin (BTC) Historical Price Trends
- 2021: BAND experienced notable volatility, with market movements influenced by broader DeFi sector dynamics. Price fluctuations were observed as the token navigated through various market cycles.
- 2021: BTC reached significant price levels around November, with market activity influenced by institutional adoption trends and macroeconomic factors. Price movements reflected evolving market sentiment.
- Comparative Analysis: During market cycles, BAND moved from higher levels to a low of approximately $0.20 in late 2019, while BTC demonstrated its own cyclical patterns, with price movements from peaks to various support levels throughout different periods.
Current Market Status (January 19, 2026)
- BAND Current Price: $0.3531
- BTC Current Price: $95,321.2
- 24-Hour Trading Volume: BAND at $15,480.73 vs BTC at $364,759,626.99
- Market Sentiment Index (Fear & Greed Index): 49 (Neutral)
View real-time prices:
II. Core Factors Affecting BAND vs BTC Investment Value
Supply Mechanism Comparison (Tokenomics)
- BAND: The reference materials do not provide specific information regarding BAND's supply mechanism or tokenomics structure.
- BTC: Features a capped supply of 21 million coins, creating artificial scarcity that serves as a fundamental value proposition. This fixed supply model is designed to maintain value over time, with issuance controlled through a halving mechanism approximately every four years.
- 📌 Historical Pattern: Bitcoin's halving events have historically been associated with significant price cycle movements, as reduced issuance rates interact with sustained or growing demand. The predetermined supply ceiling differentiates BTC from traditional fiat currencies subject to monetary expansion.
Institutional Adoption and Market Application
- Institutional Holdings: BTC has gained substantial institutional recognition, with entities like MicroStrategy accumulating over 640,000 bitcoins valued at more than $68 billion as of recent reports. The company's stock price increased by 1,660% over five years, reflecting market validation of bitcoin treasury strategies.
- Enterprise Adoption: Bitcoin continues to receive recognition from policymakers and mainstream financial institutions, demonstrating growing acceptance in traditional finance. The reference materials indicate optimism for the second half of 2025, driven by economic sentiment, increased corporate adoption, and regulatory clarity.
- National Policies: Regulatory environments are becoming more defined in certain jurisdictions. For example, USDT faces varying regulatory treatment across regions, with some EU platforms delisting it due to non-compliance with MiCA regulations, while USDC operates under more established regulatory frameworks in multiple jurisdictions.
Technical Development and Ecosystem Building
- BAND Technical Upgrades: The reference materials do not contain specific information about BAND's technical development roadmap or recent upgrades.
- BTC Technical Development: Bitcoin's technical infrastructure continues to evolve, with December 2024 marking a significant milestone as BTC crossed the $100,000 threshold for the first time. The materials discuss factors driving this breakthrough, including technological trends and shifting industry perceptions.
- Ecosystem Comparison: Bitcoin maintains strong network effects and brand recognition as the first and most valuable cryptocurrency globally. While the materials reference DeFi, NFT, and payment applications in the broader crypto space, specific comparative ecosystem data for BAND versus BTC is not detailed in the provided sources.
Macroeconomic Environment and Market Cycles
- Performance Under Inflation: Bitcoin is positioned as a potential inflation hedge, with its fixed supply mechanism designed to resist the purchasing power erosion that affects fiat currencies. Historical analysis references gold's performance during the 1970s oil crisis-driven inflation, drawing parallels to bitcoin's theoretical inflation-resistant properties.
- Macroeconomic Monetary Policy: Interest rates, dollar index movements, and broader monetary policy shifts influence cryptocurrency valuations. Investor Dan Tapiero projects bitcoin could reach $180,000 in the current cycle, citing demand growth combined with global monetary dynamics as key factors.
- Geopolitical Factors: Bitcoin's scarce supply, global trading attributes, and capacity to operate outside traditional financial systems are becoming core value supports amid uncertainty. Cross-border transaction demand and international developments continue to affect cryptocurrency market dynamics, though specific quantitative impacts vary across different scenarios.
III. 2026-2031 Price Forecast: BAND vs BTC
Short-term Forecast (2026)
- BAND: Conservative $0.286092 - $0.3532 | Optimistic $0.3532 - $0.480352
- BTC: Conservative $48,599.889 - $95,293.9 | Optimistic $95,293.9 - $110,540.924
Mid-term Forecast (2028-2029)
- BAND may enter a consolidation phase, with estimated price range of $0.30809957412 - $0.559319226864
- BTC may enter an expansion phase, with estimated price range of $87,351.18070811418 - $184,671.865111734
- Key drivers: institutional capital inflows, ETF developments, ecosystem growth
Long-term Forecast (2031)
- BAND: Baseline scenario $0.314335509500188 - $0.60449136442344 | Optimistic scenario $0.60449136442344 - $0.803973514683175
- BTC: Baseline scenario $87,351.18070811418 - $181,172.81924645904 | Optimistic scenario $181,172.81924645904 - $259,077.1315224364272
View detailed price predictions for BAND and BTC
Disclaimer
BAND:
| Year |
Predicted High Price |
Predicted Average Price |
Predicted Low Price |
Price Change |
| 2026 |
0.480352 |
0.3532 |
0.286092 |
0 |
| 2027 |
0.51263448 |
0.416776 |
0.37926616 |
18 |
| 2028 |
0.4832934496 |
0.46470524 |
0.394999454 |
31 |
| 2029 |
0.559319226864 |
0.4739993448 |
0.30809957412 |
34 |
| 2030 |
0.69232344301488 |
0.516659285832 |
0.44949357867384 |
46 |
| 2031 |
0.803973514683175 |
0.60449136442344 |
0.314335509500188 |
71 |
BTC:
| Year |
Predicted High Price |
Predicted Average Price |
Predicted Low Price |
Price Change |
| 2026 |
110540.924 |
95293.9 |
48599.889 |
0 |
| 2027 |
126588.41676 |
102917.412 |
74100.53664 |
7 |
| 2028 |
162949.1384196 |
114752.91438 |
91802.331504 |
20 |
| 2029 |
184671.865111734 |
138851.0263998 |
129131.454551814 |
45 |
| 2030 |
200584.19273715108 |
161761.445755767 |
87351.18070811418 |
69 |
| 2031 |
259077.1315224364272 |
181172.81924645904 |
155808.6245519547744 |
89 |
IV. Investment Strategy Comparison: BAND vs BTC
Long-term vs Short-term Investment Strategies
- BAND: May be suitable for investors seeking exposure to data infrastructure and oracle solutions within the blockchain ecosystem, with a focus on DeFi and AI application scenarios. The token's characteristics suggest potential alignment with investors interested in emerging infrastructure protocols.
- BTC: May be suitable for investors seeking portfolio diversification with an asset that exhibits store-of-value characteristics, anti-inflation properties, and established market recognition. Bitcoin's institutional adoption patterns suggest relevance for investors focused on long-term value preservation strategies.
Risk Management and Asset Allocation
- Conservative Investors: BAND 10-15% vs BTC 85-90%
- Aggressive Investors: BAND 25-30% vs BTC 70-75%
- Hedging Tools: Stablecoin allocation, options strategies, cross-asset portfolio diversification
V. Potential Risk Comparison
Market Risk
- BAND: The token exhibits volatility patterns influenced by DeFi sector dynamics and broader market cycles. Trading volume of $15,480.73 indicates lower liquidity compared to major assets, which may result in increased price sensitivity to market movements.
- BTC: While Bitcoin demonstrates cyclical price patterns, its substantial trading volume of $364,759,626.99 and market dominance provide relative liquidity. Price movements remain influenced by macroeconomic factors, institutional flows, and regulatory developments across jurisdictions.
Technical Risk
- BAND: Network scalability and operational stability considerations exist as with data infrastructure protocols, though specific technical risk parameters are not detailed in available materials.
- BTC: Mining concentration patterns and network security considerations continue to be monitored by market participants. The established network operates with proven infrastructure, though evolution in mining distribution and technological developments remain ongoing factors.
Regulatory Risk
- Global regulatory frameworks exhibit varying approaches to different cryptocurrency assets. Bitcoin faces evolving policy environments across jurisdictions, with some regions developing clearer frameworks for institutional custody and trading. Infrastructure tokens like BAND may encounter different regulatory considerations related to data services and blockchain applications. Regulatory clarity in major markets continues to develop, with implications for both assets varying by jurisdiction and use case classification.
VI. Conclusion: Which Is the Better Buy?
📌 Investment Value Summary:
- BAND Highlights: Positioned within data infrastructure sector serving DeFi and AI applications; early-stage protocol with development potential in oracle and data layer services.
- BTC Highlights: Established market position with highest capitalization and trading volume; institutional adoption trajectory with entities like MicroStrategy demonstrating corporate treasury strategies; fixed supply mechanism creating scarcity dynamics; growing recognition as potential inflation hedge with store-of-value characteristics.
✅ Investment Recommendations:
- New Investors: May consider beginning with established assets like BTC that demonstrate greater liquidity and institutional recognition, while allocating a smaller portion to emerging protocols like BAND based on individual risk tolerance and research.
- Experienced Investors: Could evaluate portfolio allocation strategies incorporating both established assets and infrastructure protocols, with weightings reflecting risk preferences, market cycle positioning, and ecosystem development trajectories.
- Institutional Investors: May assess BTC for treasury diversification and inflation hedging strategies, with potential consideration of infrastructure protocols like BAND for exposure to data layer developments, subject to due diligence and regulatory compliance requirements.
⚠️ Risk Disclosure: Cryptocurrency markets exhibit high volatility characteristics. This analysis does not constitute investment advice. Individuals should conduct independent research and consult qualified professionals before making investment decisions.
VII. FAQ
Q1: What are the fundamental differences between BAND and BTC in terms of use cases?
BAND serves as data infrastructure for blockchain applications, while BTC functions as digital gold and a store of value. BAND Protocol is designed to provide real-time data feeds to DeFi, GameFi, and AI agents with zero counterparty risk, positioning itself as an oracle and data layer solution. In contrast, Bitcoin operates as a decentralized digital currency and has evolved into a widely recognized store of value with characteristics similar to precious metals, particularly gold.
Q2: How do the supply mechanisms of BAND and BTC differ?
BTC has a fixed cap of 21 million coins with a predictable halving schedule, while BAND's specific supply mechanism details are not comprehensively documented in available materials. Bitcoin's capped supply creates artificial scarcity that serves as a fundamental value proposition, with issuance reducing approximately every four years through halving events. This predetermined supply ceiling differentiates BTC from traditional fiat currencies and contributes to its inflation-resistant properties.
Q3: Which asset demonstrates stronger institutional adoption?
BTC exhibits significantly stronger institutional adoption compared to BAND. Bitcoin has gained substantial institutional recognition, with entities like MicroStrategy accumulating over 640,000 bitcoins valued at more than $68 billion as of recent reports. The company's stock price increased by 1,660% over five years, reflecting market validation of bitcoin treasury strategies. Bitcoin continues to receive recognition from policymakers and mainstream financial institutions, demonstrating growing acceptance in traditional finance.
Q4: How do trading volumes compare between BAND and BTC?
BTC's 24-hour trading volume of $364,759,626.99 vastly exceeds BAND's $15,480.73, indicating significantly different liquidity profiles. This substantial volume difference suggests that Bitcoin offers greater market depth, tighter bid-ask spreads, and reduced price slippage for large transactions. The lower trading volume for BAND may result in increased price sensitivity to market movements and potentially wider spreads during periods of volatility.
Q5: What are the projected price trajectories for BAND vs BTC through 2031?
Both assets show positive long-term projections with different growth patterns. For 2031, BAND's baseline scenario projects $0.314335509500188 - $0.60449136442344, with an optimistic scenario reaching up to $0.803973514683175. BTC's 2031 baseline scenario projects $87,351.18070811418 - $181,172.81924645904, with an optimistic scenario reaching up to $259,077.1315224364272. Bitcoin's projections reflect expectations for continued institutional adoption and macroeconomic positioning, while BAND's forecasts depend on ecosystem development in data infrastructure applications.
Q6: How should conservative investors approach portfolio allocation between BAND and BTC?
Conservative investors may consider allocating 10-15% to BAND and 85-90% to BTC. This allocation strategy reflects Bitcoin's established market position, higher liquidity, and institutional adoption trajectory, which align with capital preservation objectives. The smaller BAND allocation provides exposure to emerging data infrastructure protocols while limiting risk from lower liquidity and earlier-stage development status. Conservative strategies should also incorporate stablecoin holdings and consider hedging tools such as options strategies for additional risk management.
Q7: What are the primary risks associated with investing in BAND compared to BTC?
BAND faces higher market risk due to lower trading volume and liquidity, while BTC's primary risks relate to regulatory developments and macroeconomic factors. BAND's $15,480.73 daily trading volume indicates potential for increased price volatility and wider spreads during market stress. Additionally, BAND's positioning within the data infrastructure sector exposes it to technical risks related to network scalability and operational stability. Bitcoin, while more liquid, faces evolving regulatory frameworks across jurisdictions and sensitivity to institutional capital flows and global monetary policy shifts.
Q8: How do macroeconomic conditions affect BAND and BTC differently?
BTC demonstrates stronger correlation with macroeconomic factors due to its positioning as an inflation hedge and institutional treasury asset. Bitcoin's fixed supply mechanism positions it as a potential store of value during periods of monetary expansion, with performance influenced by interest rates, dollar index movements, and broader monetary policy shifts. Investor Dan Tapiero projects bitcoin could reach $180,000 in the current cycle, citing demand growth combined with global monetary dynamics. BAND's price movements appear more closely tied to DeFi sector dynamics and blockchain infrastructure adoption trends rather than broad macroeconomic indicators.
* The information is not intended to be and does not constitute financial advice or any other recommendation of any sort offered or endorsed by Gate.