This comprehensive investment analysis compares BAT and ENJ, two prominent blockchain tokens with distinct applications in digital advertising and gaming respectively. BAT operates with a fixed 1.5 billion token supply within the Brave browser ecosystem, while ENJ implements dynamic supply mechanisms tied to NFT creation and destruction. The article examines historical price trends, tokenomics differences, institutional adoption patterns, and technological developments across both ecosystems. Current market data shows BAT trading at $0.2021 with higher liquidity ($157K daily volume) versus ENJ at $0.03131 with lower volume, reflecting different risk-reward profiles. Price forecasts through 2031 suggest divergent trajectories based on ecosystem expansion and adoption rates. The analysis provides allocation strategies for conservative and aggressive investors, detailed risk assessments, and real-time price comparisons available on Gate exchange.
Introduction: Investment Comparison Between BAT and ENJ
In the cryptocurrency market, the comparison between BAT vs ENJ has consistently drawn investor attention. These two assets exhibit significant differences in market cap ranking, application scenarios, and price performance, while representing distinct positioning within the crypto asset landscape.
BAT (Basic Attention Token): Launched in 2017, it has gained market recognition through its focus on digital advertising solutions and user attention monetization within the Brave browser ecosystem.
ENJ (Enjin Coin): Introduced in 2017, it has been positioned as a blockchain-based gaming and virtual goods platform, serving millions of gamers through the Enjin ecosystem.
This article will comprehensively analyze the investment value comparison between BAT vs ENJ through historical price trends, supply mechanisms, adoption patterns, technological ecosystems, and future outlook, attempting to address investors' primary concern:
"Which asset presents more favorable risk-reward characteristics under current market conditions?"
I. Historical Price Comparison and Market Overview
BAT and ENJ Historical Price Trends
-
2021: BAT experienced significant price volatility, with its price reaching approximately $1.90 in November 2021. This period coincided with increased interest in decentralized digital advertising and the broader cryptocurrency market rally.
-
2021: ENJ witnessed notable price movement during the same period, reaching approximately $4.82 in November 2021. This surge was associated with growing enthusiasm for NFTs and blockchain-based gaming solutions.
-
Comparative Analysis: During the 2021-2022 market cycle, BAT declined from its peak of $1.90 to lower levels, while ENJ experienced a more pronounced decline from $4.82, reflecting different market dynamics and sector-specific factors affecting each token.
Current Market Status (2026-01-15)
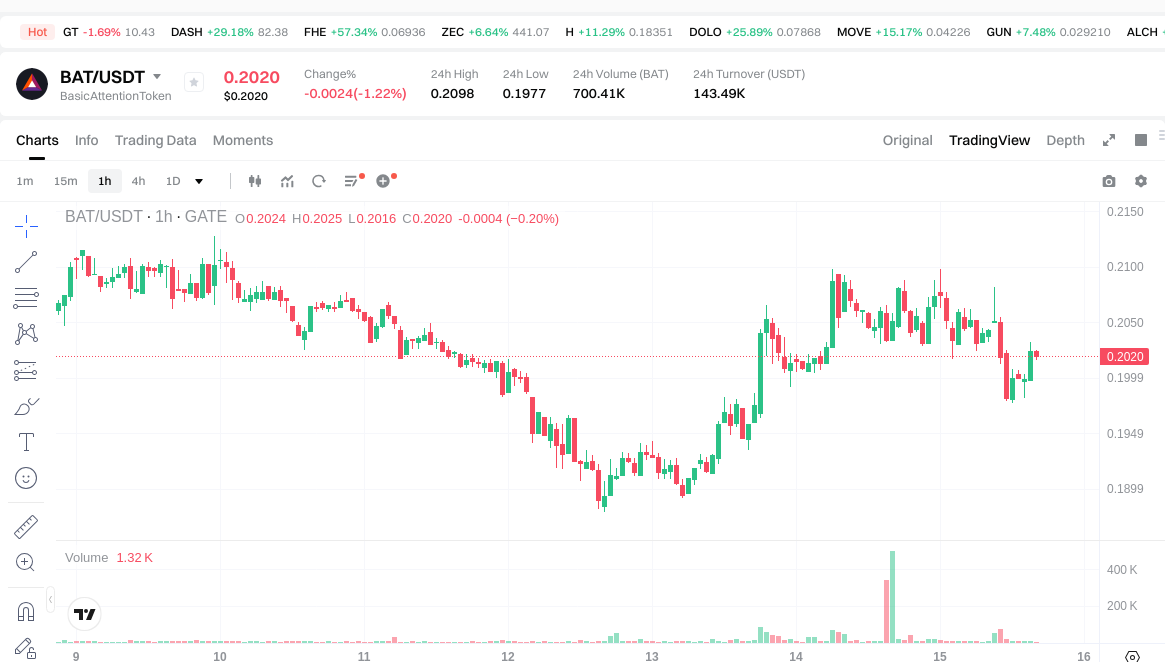
- BAT Current Price: $0.2021
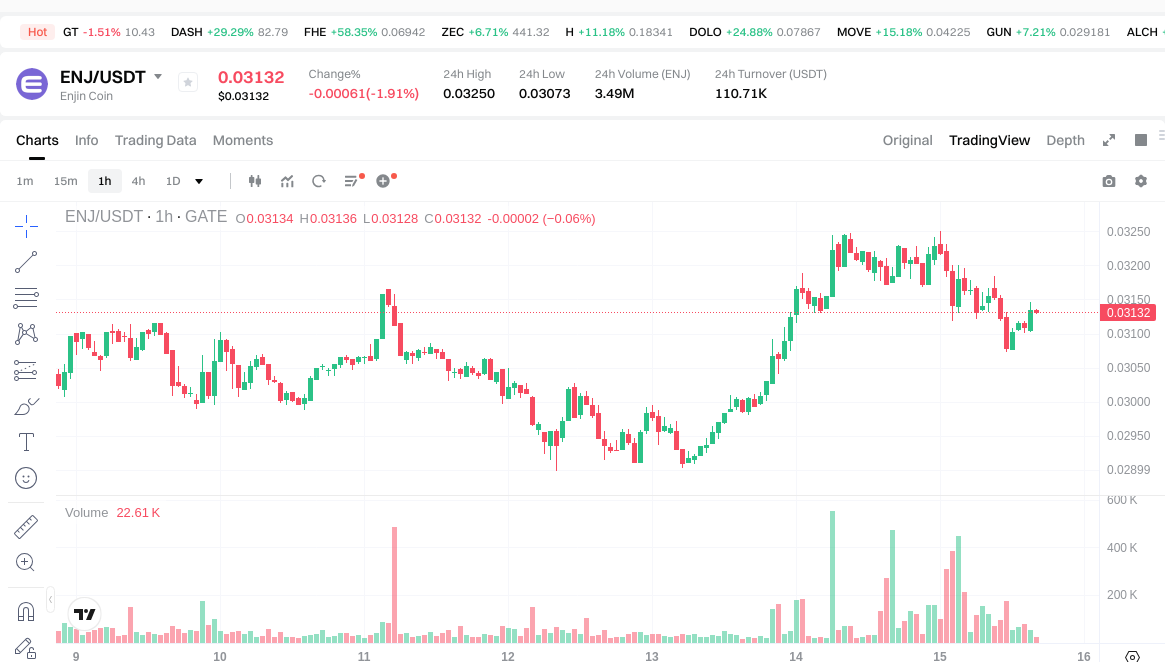
- ENJ Current Price: $0.03131
- 24-Hour Trading Volume: BAT recorded $157,005.93 compared to ENJ's $112,646.75
- Market Sentiment Index (Fear & Greed Index): 61 (Greed)
View real-time prices:
II. Core Factors Influencing BAT vs ENJ Investment Value
Supply Mechanism Comparison (Tokenomics)
-
BAT: Features a fixed supply model with a maximum of 1.5 billion tokens. The token distribution includes allocations for users, content creators, and advertisers within the Brave ecosystem. No new tokens are minted, creating a deflationary pressure as adoption grows.
-
ENJ: Implements a flexible supply mechanism where tokens can be minted and melted based on NFT creation and destruction. When NFTs are created, ENJ is locked; when destroyed, ENJ is returned to circulation. This creates dynamic supply adjustments tied to ecosystem activity.
-
📌 Historical Pattern: Fixed supply models tend to demonstrate price appreciation during periods of increased adoption, while dynamic supply mechanisms may exhibit volatility correlated with ecosystem usage patterns.
Institutional Adoption and Market Application
-
Institutional Holdings: Both projects show varying degrees of institutional interest. BAT has garnered attention from traditional venture capital firms focused on browser technology and digital advertising disruption. ENJ has attracted investment from gaming-focused funds and blockchain infrastructure investors.
-
Enterprise Adoption: BAT focuses on digital advertising transformation through the Brave browser, targeting publishers and advertisers seeking alternative monetization models. ENJ concentrates on gaming integration, providing blockchain infrastructure for game developers and virtual asset management.
-
National Policy: Regulatory approaches differ by jurisdiction. Digital advertising tokens face scrutiny regarding user data and privacy compliance, while gaming tokens encounter varied treatment depending on whether authorities classify them as utility tokens or securities.
Technology Development and Ecosystem Building
-
BAT Technology Upgrades: The project continues enhancing privacy features within the Brave browser, developing cross-platform compatibility, and expanding creator monetization tools. These improvements aim to increase user adoption and advertiser participation.
-
ENJ Technology Development: Focus areas include scaling solutions for NFT transactions, integration with multiple blockchain networks, and development of tools simplifying NFT creation for game developers. The project emphasizes interoperability across gaming platforms.
-
Ecosystem Comparison: BAT operates primarily within the digital advertising and content monetization space, with limited DeFi or NFT integration. ENJ demonstrates stronger presence in NFT markets and gaming applications, with emerging connections to metaverse projects and cross-game asset portability initiatives.
Macroeconomic Factors and Market Cycles
-
Performance in Inflationary Environments: Digital assets with fixed supplies may benefit from inflation hedging narratives, though market sentiment and adoption rates remain primary drivers. Gaming-related tokens tend to correlate more closely with discretionary spending patterns.
-
Macroeconomic Monetary Policy: Interest rate changes affect risk asset valuations broadly. Higher rates typically reduce speculative capital flow into alternative digital assets, impacting both projects similarly. Dollar strength influences international purchasing power for these tokens.
-
Geopolitical Factors: Cross-border digital advertising and gaming markets face varying regulatory landscapes. Privacy-focused projects may gain traction amid data sovereignty concerns, while gaming tokens benefit from growing digital entertainment consumption in emerging markets.
III. 2026-2031 Price Forecast: BAT vs ENJ
Short-term Forecast (2026)
- BAT: Conservative $0.17-$0.20 | Optimistic $0.20-$0.23
- ENJ: Conservative $0.023-$0.031 | Optimistic $0.031-$0.044
Medium-term Forecast (2028-2029)
- BAT may enter a consolidation phase, with projected price range of $0.16-$0.37
- ENJ may enter a growth phase, with projected price range of $0.024-$0.049
- Key drivers: institutional capital inflows, ETF developments, ecosystem expansion
Long-term Forecast (2030-2031)
- BAT: Baseline scenario $0.22-$0.38 | Optimistic scenario $0.38-$0.45
- ENJ: Baseline scenario $0.029-$0.046 | Optimistic scenario $0.046-$0.050
View detailed price predictions for BAT and ENJ
Disclaimer
BAT:
| Year |
Predicted High Price |
Predicted Average Price |
Predicted Low Price |
Price Change |
| 2026 |
0.230052 |
0.2018 |
0.17153 |
0 |
| 2027 |
0.31741122 |
0.215926 |
0.1511482 |
6 |
| 2028 |
0.3120022737 |
0.26666861 |
0.1573344799 |
31 |
| 2029 |
0.370349365568 |
0.28933544185 |
0.23146835348 |
43 |
| 2030 |
0.4287951248217 |
0.329842403709 |
0.21769598644794 |
63 |
| 2031 |
0.447596141833113 |
0.37931876426535 |
0.220004883273903 |
87 |
ENJ:
| Year |
Predicted High Price |
Predicted Average Price |
Predicted Low Price |
Price Change |
| 2026 |
0.0441048 |
0.03128 |
0.0231472 |
0 |
| 2027 |
0.04334626 |
0.0376924 |
0.026761604 |
20 |
| 2028 |
0.0429504898 |
0.04051933 |
0.0255271779 |
29 |
| 2029 |
0.049247193682 |
0.0417349099 |
0.024206247742 |
33 |
| 2030 |
0.04685578334473 |
0.045491051791 |
0.02911427314624 |
45 |
| 2031 |
0.049867290973294 |
0.046173417567865 |
0.039709139108363 |
47 |
IV. Investment Strategy Comparison: BAT vs ENJ
Long-term vs Short-term Investment Strategies
-
BAT: May suit investors interested in digital advertising transformation and browser-based monetization models. The fixed supply mechanism and established user base within the Brave ecosystem could align with medium to long-term positioning strategies.
-
ENJ: May appeal to investors focusing on gaming industry blockchain integration and NFT infrastructure development. The dynamic supply model tied to ecosystem activity suggests potential alignment with growth-oriented investment approaches.
Risk Management and Asset Allocation
-
Conservative Investors: BAT 40% vs ENJ 30%, with remaining allocation to stablecoins and established cryptocurrencies. This approach emphasizes capital preservation while maintaining exposure to sector-specific opportunities.
-
Aggressive Investors: BAT 30% vs ENJ 45%, with higher concentration in growth-oriented assets. This allocation reflects greater risk tolerance and focus on potential upside from ecosystem expansion.
-
Hedging Tools: Stablecoin allocation for liquidity management, options strategies for downside protection, cross-asset diversification including established cryptocurrencies to reduce concentration risk.
V. Potential Risk Comparison
Market Risk
-
BAT: Subject to volatility in digital advertising market sentiment, browser adoption rates, and competition from traditional and decentralized advertising platforms. Price movements may correlate with shifts in privacy-focused technology adoption.
-
ENJ: Faces exposure to gaming industry cycles, NFT market sentiment fluctuations, and competition from alternative gaming blockchain platforms. Price performance may demonstrate correlation with broader metaverse and digital collectibles trends.
Technology Risk
-
BAT: Development considerations include scalability of the Brave browser ecosystem, maintaining cross-platform functionality, and sustaining user engagement with attention-based rewards. Network stability depends on continued browser adoption and advertiser participation.
-
ENJ: Technical challenges encompass scaling NFT transaction throughput, maintaining interoperability across multiple blockchain networks, and ensuring security of minting and melting mechanisms. Infrastructure must support increasing gaming platform integrations.
Regulatory Risk
- Global regulatory frameworks continue evolving regarding digital advertising tokens and gaming-related cryptocurrencies. Privacy regulations may impact BAT's attention-tracking mechanisms, while ENJ faces potential classification questions regarding NFT and gaming token status across different jurisdictions. Compliance requirements vary significantly by region, creating uncertainty for cross-border operations.
VI. Conclusion: Which Is the Better Buy?
📌 Investment Value Summary:
-
BAT Characteristics: Fixed supply model with established browser ecosystem integration, focus on digital advertising disruption, and privacy-oriented positioning. Current market positioning reflects consolidation following previous cycle peaks.
-
ENJ Characteristics: Dynamic supply mechanism tied to NFT creation activity, gaming industry infrastructure positioning, and cross-platform interoperability focus. Price levels suggest recovery potential from significant prior corrections.
✅ Investment Considerations:
-
Beginning Investors: Consider smaller position sizes with emphasis on understanding each project's fundamental use case. Diversification across multiple asset classes remains important for risk management.
-
Experienced Investors: May evaluate portfolio allocation based on sector exposure preferences, technical analysis of price trends, and assessment of ecosystem development progress. Risk-adjusted position sizing according to individual portfolio strategy.
-
Institutional Investors: Assessment may include liquidity analysis, regulatory compliance considerations, and alignment with sector-specific investment mandates. Due diligence regarding custody solutions and market depth.
⚠️ Risk Disclosure: Cryptocurrency markets demonstrate significant volatility. This content does not constitute investment advice. Market conditions, regulatory environments, and project developments may change materially. Individuals should conduct independent research and consult qualified financial advisors before making investment decisions.
VII. FAQ
Q1: What are the fundamental differences between BAT and ENJ token supply mechanisms?
BAT operates on a fixed supply model with a maximum of 1.5 billion tokens, creating deflationary pressure as adoption increases. ENJ implements a dynamic supply mechanism where tokens can be minted and melted based on NFT creation and destruction—when NFTs are created, ENJ is locked; when destroyed, ENJ returns to circulation. This fundamental difference means BAT's scarcity is predetermined, while ENJ's circulating supply adjusts according to ecosystem activity levels.
Q2: Which token has shown stronger resilience during market corrections?
Both tokens experienced significant corrections from their 2021 peaks, with BAT declining from $1.90 and ENJ from $4.82 to current levels of $0.2021 and $0.03131 respectively. ENJ demonstrated a more pronounced percentage decline, suggesting higher volatility characteristics. BAT's relatively smaller correction indicates potentially stronger price stability during bearish market conditions, though both remain substantially below historical highs.
Q3: How do regulatory considerations differ between BAT and ENJ?
BAT faces regulatory scrutiny primarily focused on digital advertising practices, user data privacy, and attention-tracking mechanisms under evolving privacy regulations. ENJ encounters different regulatory challenges related to NFT classification, gaming token status, and potential securities law considerations across various jurisdictions. The regulatory landscape for digital advertising tokens differs significantly from gaming-related cryptocurrencies, creating distinct compliance requirements for each project.
Q4: What are the primary ecosystem applications for each token?
BAT functions primarily within the Brave browser ecosystem, facilitating monetization for content creators, advertisers, and users through attention-based rewards in the digital advertising space. ENJ serves as infrastructure for blockchain gaming, enabling NFT creation, management, and cross-platform asset portability within gaming environments and virtual worlds. The ecosystems have minimal overlap—BAT targets advertising transformation while ENJ focuses on gaming industry blockchain integration.
Q5: Which token presents better alignment with current market trends?
Current market trends show increased institutional interest in both privacy-focused technologies and gaming/NFT infrastructure. BAT benefits from growing privacy concerns and alternative advertising model adoption, while ENJ aligns with expanding metaverse, gaming, and digital collectibles sectors. The Fear & Greed Index at 61 (Greed) suggests moderate risk appetite. ENJ's gaming focus may capture discretionary spending increases, while BAT's advertising model could benefit from traditional market digital transformation efforts.
Q6: How do trading volumes and liquidity compare between BAT and ENJ?
As of January 15, 2026, BAT recorded 24-hour trading volume of $157,005.93 compared to ENJ's $112,646.75, indicating higher liquidity for BAT. Greater trading volume typically translates to tighter bid-ask spreads and reduced slippage for position entries and exits. This liquidity advantage makes BAT potentially more suitable for larger position sizing or frequent trading strategies, while ENJ's lower volume suggests increased consideration for execution timing and order size management.
Q7: What allocation strategies are recommended for different investor profiles?
Conservative investors may consider BAT 40% versus ENJ 30% with remaining allocation to stablecoins and established cryptocurrencies, emphasizing capital preservation. Aggressive investors might position BAT 30% versus ENJ 45% with higher growth-oriented concentration, reflecting greater risk tolerance. Both strategies require complementary hedging through stablecoin liquidity reserves, options for downside protection, and cross-asset diversification to manage concentration risk appropriately.
Q8: What are the key price catalysts to monitor for 2026-2027?
For BAT, monitor Brave browser adoption metrics, advertiser platform integration announcements, and privacy regulation developments affecting digital advertising models. For ENJ, track gaming platform partnership announcements, NFT transaction volume trends, metaverse project integrations, and blockchain scalability improvements. Macroeconomic factors including interest rate policies, institutional capital flows, and potential ETF developments will influence both tokens' price trajectories during this period.
* The information is not intended to be and does not constitute financial advice or any other recommendation of any sort offered or endorsed by Gate.