This comprehensive guide decodes the Bitcoin Fear and Greed Index, an essential sentiment indicator for cryptocurrency traders. The article explores how this 0-100 scale measures market emotions through six key factors: volatility, trading volume, social media sentiment, surveys, Bitcoin dominance, and Google Trends. Drawing parallels to traditional stock market indices, it explains why extreme fear or greed often signals trading opportunities. Traders leverage this metric on Gate to make informed decisions and reduce investment risks. The guide emphasizes combining the Fear and Greed Index with technical analysis and fundamental research for optimal trading strategies, while acknowledging its limitations as a standalone predictor.
Understanding the Bitcoin Fear and Greed Index
The Bitcoin Fear and Greed Index serves as a valuable tool for understanding cryptocurrency market sentiment. While market investment carries significant risks, this clear indicator can help reduce those risks to some extent. It provides hints about upcoming trends in the market.
 Although it may seem like simple speculation, professional cryptocurrency traders also benefit greatly from this data.
Cryptocurrency market speculation involves not only financial risks but also significant psychological pressure. Many investors become emotional during the trading process, which is precisely why professional traders created the cryptocurrency Fear and Greed Index. This index represents the overall market sentiment and helps traders decide when to take risks or when to adopt safer positions. Understanding market psychology through this metric can be the difference between successful and unsuccessful trading strategies.
Both extreme fear and extreme greed can lead to profit opportunities. For example, when investors are excessively greedy, it typically means the market will experience a downward trend or correction period toward more neutral levels. Warren Buffett, the Oracle of Omaha, famously said: "Be fearful when others are greedy, and be greedy when others are fearful." This wisdom applies perfectly to cryptocurrency trading, where emotional extremes often signal potential market reversals.
Indicator Trading
Before diving deeper into the Fear and Greed Index, let's first examine indicator trading. This trading method involves performing technical analysis using various indicators to identify trends or action signals. Through well-crafted mathematical formulas or visual representations of data, indicators can reveal much about asset price behavior. Traders use these signals to make predictions and establish positions in the market.
There are thousands of indicators in the market, with new ones constantly emerging. While you can develop unique strategies centered around specific indicator combinations, today we will focus exclusively on the Fear and Greed Index. Understanding how this particular indicator works and how to interpret its signals is crucial for anyone serious about cryptocurrency trading. The index combines multiple data sources to provide a comprehensive view of market sentiment, making it one of the most reliable tools for gauging investor psychology.
History of the Fear and Greed Index
The cryptocurrency Fear and Greed Index was derived from traditional stock markets. Three elements—greed, fear, and herd mentality—are always present in all financial markets. The overwhelming presence of any emotion typically serves as a precursor to bull or bear markets. Analysts have always examined fear or greed levels to formulate hypotheses about market direction. This index is intensively studied to explore investor rationality and predict potential market movements.
Traditional Stock Market Fear and Greed Index
In stock trading, CNN's Fear and Greed Index is a widely used and recognized resource for traders. The index displays results on a scale from 0 to 100, where 0 represents when traders are most cautious and 100 represents when they are most greedy. When market participants are greedy, stock prices tend to rise. When participants are fearful, significant selling occurs, leading to corresponding price declines. This relationship between emotion and market movement has been observed consistently across different market cycles and asset classes.
How Fear and Greed Are Measured in Traditional Markets
Generally, the traditional Fear and Greed Index consists of six main indicators that work together to provide a comprehensive market sentiment reading.
Market Momentum
The market momentum indicator critically analyzes the ratio of advancing stocks versus declining stocks. It also explores the volume of surging stocks versus declining stocks. For example, examining how much the S&P 500 has risen or fallen over the past 100 days reveals momentum. This long-term perspective helps filter out short-term noise and provides a clearer picture of underlying market trends.
Stock Price Strength
The stock price strength indicator checks the number of stocks hitting 52-week highs versus those hitting 52-week lows. A higher ratio of stocks at new highs suggests strong market confidence and potential continued upward momentum, while more stocks at new lows indicates widespread weakness and potential further declines.
Stock Market Options
The stock market options indicator analyzes the ratio of put options to call options. When there are more call options than put options, it indicates greed and bullish sentiment. Conversely, when there are more put options than call options, it signifies fear and bearish expectations. Options traders are often considered sophisticated investors, making this indicator particularly valuable for understanding institutional sentiment.
Volatility Index
This indicator represents a real-time index showing expectations for market volatility over the next 30 days. A high VIX indicates fear and uncertainty, but when stocks rise and VIX falls, it indicates greed and confidence. The VIX, often called the "fear gauge," is one of the most closely watched indicators in financial markets.
Junk Bond Demand
This measures the rate at which traders invest in high-risk assets like junk bonds. When investors adopt this trading strategy, it's a sign of greed toward the market. High junk bond demand suggests investors are comfortable taking on additional risk in pursuit of higher returns, indicating overall market confidence.
Safe-Haven Demand
Safe-haven demand is a strong fear indicator. During uncertain times, investors try to save in the least risky assets possible. The safe-haven demand index measures the rate at which investors search for low-risk investments and adopt safer strategies among them. Assets like gold, government bonds, and stable currencies typically see increased demand during fearful market periods.
Each of these indicators is measured on a scale from 0 to 100. The Fear and Greed Index is then calculated with an average score of these six components, providing a balanced view of overall market sentiment.
Bitcoin Fear and Greed Index Indicators
The cryptocurrency Fear and Greed Index is dominated by Bitcoin. This is because the altcoin market is closely related to Bitcoin's movements. When Bitcoin prices surge, altcoins soon follow. When Bitcoin's price falls, most other altcoins also decline. This correlation makes Bitcoin sentiment a reliable proxy for the entire cryptocurrency market.
The Bitcoin Fear and Greed Index can be calculated from the following factors:
-
Volatility – 25%: Abnormal increases in volatility indicate extreme fear about the cryptocurrency market. High volatility often precedes significant price movements and reflects uncertainty among market participants.
-
Volume – 25%: Consistently high trading volume indicates a greedy market. Increased volume suggests strong participation and confidence, often accompanying upward price trends.
-
Social Media – 15%: Twitter sentiment can be calculated by measuring posts, mentions, and other activities related to cryptocurrency hashtags. An abnormally high presence on Twitter indicates a greedy market, as increased social media activity often correlates with FOMO (fear of missing out).
-
Surveys – 15%: Polls about what users think about the current market are conducted on various platforms. These direct sentiment measurements provide valuable insights into retail investor psychology.
-
Bitcoin Dominance – 10%: Looking at how much more money is going into Bitcoin compared to other cryptocurrencies reveals how greedy or fearful investors are about assets. Higher Bitcoin dominance often indicates a flight to quality during uncertain times.
-
Google Trends – 10%: Google Trends data for various Bitcoin-related search terms surprisingly well demonstrates investor sentiment. For example, a surge in searches for "best Bitcoin investment" is a clear indicator of extreme greed and heightened retail interest.
Criticism of the Bitcoin Fear and Greed Index
The Bitcoin Fear and Greed Index is not 100% accurate and is not always useful for predictions. In other words, this index only shows current market sentiment, and other indicators are needed for investment decisions. Furthermore, while extreme greed or fear may signal an impending reversal, it is impossible to predict how long the market can remain in either of these conditions. Markets can remain irrational longer than traders can remain solvent, as the famous saying goes.
As always, you should conduct your own research, practice, and backtesting to ensure that any strategy using this indicator is actually profitable. The Fear and Greed Index should be viewed as one tool among many in a comprehensive trading toolkit. Successful traders combine multiple indicators, fundamental analysis, and risk management strategies to make informed decisions. While the index provides valuable insights into market psychology, it should never be the sole basis for trading decisions. Consider it a complementary tool that works best when combined with other technical and fundamental analysis methods.
FAQ
What is Bitcoin Fear and Greed Index (比特币恐惧和贪婪指数)? How is it calculated?
Bitcoin Fear and Greed Index measures market sentiment ranging from extreme fear to extreme greed. It calculates using volatility (25%), trading volume (25%), social media sentiment (15%), dominance (10%), and Google trends (10%), providing investors with market emotion insights for trading decisions.
How to use Fear and Greed Index to guide Bitcoin investment decisions?
Monitor the index to gauge market sentiment: extreme fear may signal buying opportunities at lower prices, while extreme greed could indicate selling opportunities. Combine it with fundamental analysis for rational decision-making rather than emotion-driven trading.
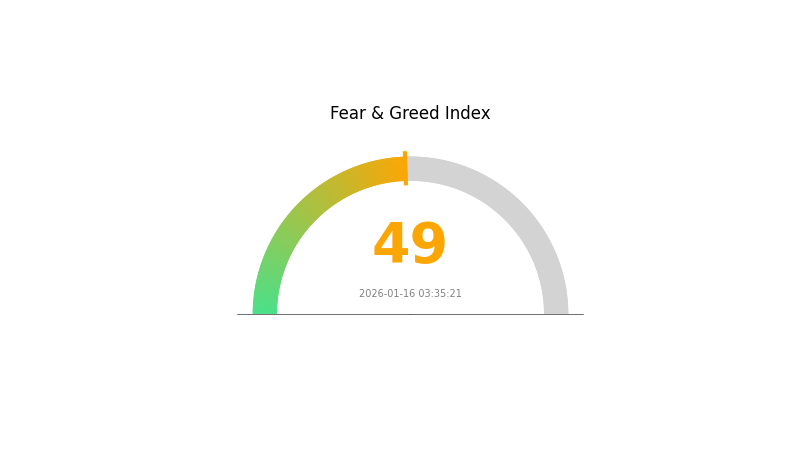
What do different values (0-100) of the Fear and Greed Index represent?
The Fear and Greed Index ranges from 0-100, where lower values indicate extreme fear among investors, while higher values indicate extreme greed. Values near 0 represent maximum fear, values near 100 represent maximum greed, with mid-range values reflecting neutral market sentiment.
What is the relationship between the Fear and Greed Index and Bitcoin price fluctuations?
The Fear and Greed Index typically shows an inverse relationship with Bitcoin price. High greed readings often correlate with price increases, while high fear readings correlate with price declines. This index reflects market sentiment and drives investor behavior.
Why should investors pay attention to Bitcoin Fear and Greed Index? What are its advantages and limitations?
Investors should monitor Bitcoin Fear and Greed Index to gauge market sentiment and identify potential trading opportunities. Advantages include multi-factor analysis of volatility, transaction volume, and social media trends. Limitations: it's not a standalone price predictor and works best combined with technical analysis and other market indicators.
What happened historically when the Fear and Greed Index reached extreme values? What are some examples?
Extreme fear historically precedes market bottoms and buying opportunities, like March 2020 pandemic crash. Extreme greed signals potential market peaks, as seen in late 2017 and late 2021 bull runs. These extremes often mark crucial inflection points for contrarian traders.
Besides the Fear and Greed Index, are there other indicators to measure cryptocurrency market sentiment?
Yes. Technical analysis, market liquidity, trading volume, and on-chain metrics are key alternatives. Social sentiment analysis and derivative market data also reflect market psychology and investor positioning effectively.
* The information is not intended to be and does not constitute financial advice or any other recommendation of any sort offered or endorsed by Gate.