This comprehensive Bitcoin price analysis examines BTC's recent decline below $95,000 amid macroeconomic uncertainty and data gaps following U.S. government shutdown. The article analyzes key market pressures including Federal Reserve policy ambiguity, weakening sentiment indicators, and technical breakdown of major support levels. Expert insights reveal Bitcoin approaching a critical decision zone between $92,000-$99,000 resistance, with potential downside targets at $91,600 and $83,000 if selling pressure intensifies. Institutional positioning data and Fear & Greed Index readings indicate defensive market structure, yet long-term fundamentals remain intact. The guide provides actionable trading strategies for investors, historical context on Bitcoin's recovery patterns, and clarifies relationships between crypto markets and macroeconomic factors, helping traders navigate current volatility on Gate and assess optimal entry points for accumulation.
Economic Data Gap Fuels Market Stress
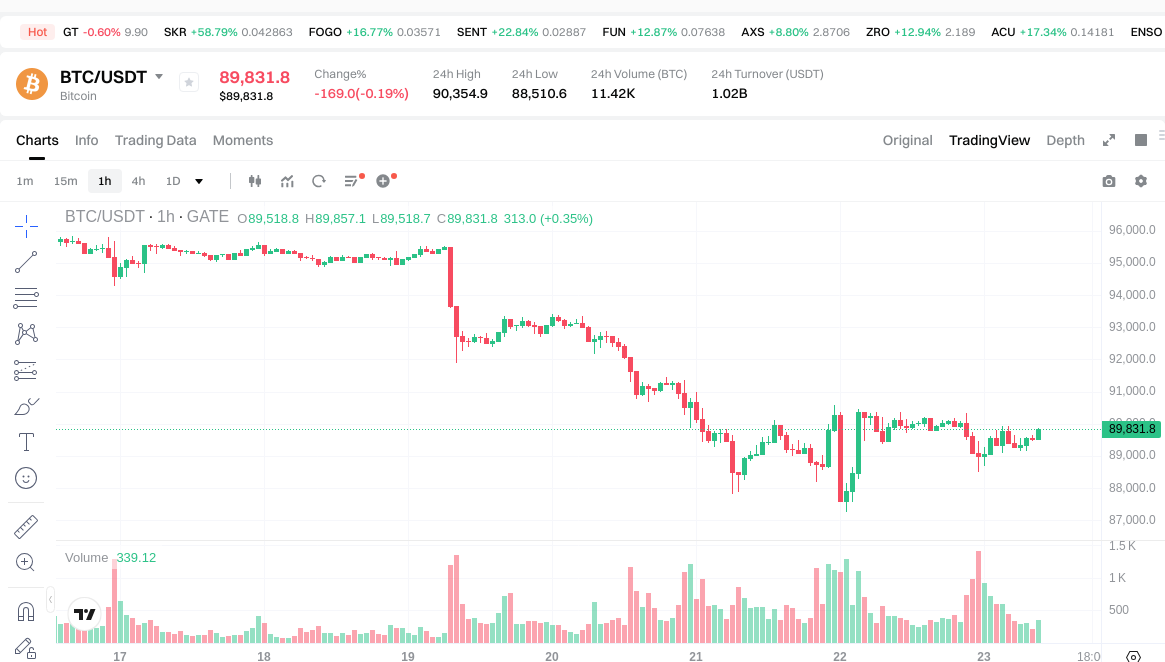
Bitcoin has recently fallen back below the $95,000 threshold, marking its weakest level since earlier in the year. This decline has raised concerns among market participants that a deeper correction may be unfolding. The downward trend represents a continuation of a month-long loss of momentum that began shortly after the all-time high reached in the previous quarter, leaving BTC approximately 20% lower and forcing traders to reassess the sustainability of the recent bull cycle.
The latest shock to the market came as analysts warned that several key U.S. economic releases for the recent reporting period may not be published at all following a prolonged government shutdown. The absence of core economic metrics, including Consumer Price Index (CPI) data, employment figures, and consumer trend reports, has left the Federal Reserve with significantly limited visibility ahead of its year-end policy meeting.
Nic Puckrin, co-founder of The Coin Bureau, described the situation as a "black hole in the data pipeline," noting that policymakers are being forced to navigate sensitive economic conditions with far less information than usual. This data vacuum creates additional uncertainty in an already volatile market environment.
The Federal Reserve resumed its rate-cut cycle in the latter half of the year, delivering two reductions while keeping the door open for further adjustments. However, traders now see only a 50% probability of another rate cut in the upcoming policy meeting, according to CME FedWatch data, down sharply from earlier projections during the same week.
Concerns deepened after Goldman Sachs suggested the U.S. might have experienced one of the largest monthly declines in employment since the 2020 pandemic period, a risk that remains difficult to verify without official government reports. As uncertainty continues to grow, investors have increasingly shifted toward safe-haven assets, creating downward pressure on high-beta assets like Bitcoin and other cryptocurrencies.
Market Sentiment Turns Defensive
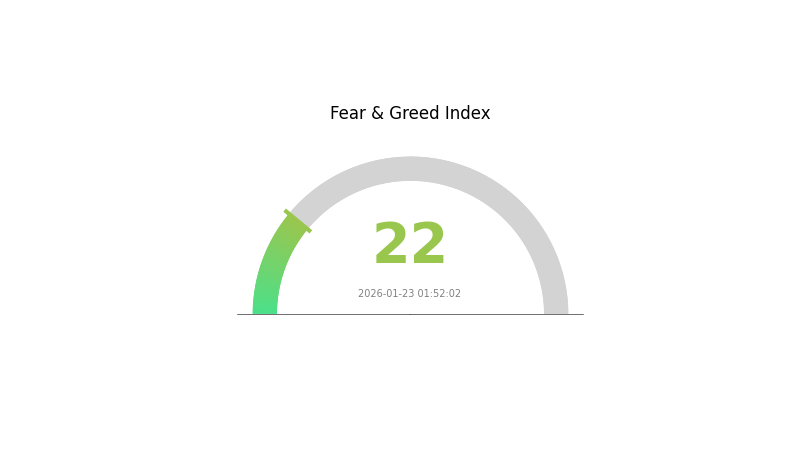
Crypto markets have responded swiftly to the deteriorating macroeconomic picture. The widely-tracked Fear & Greed Index, a key sentiment indicator for digital assets, slid to 22, representing its lowest reading since earlier in the year and signaling growing anxiety across the cryptocurrency market.
Analysts have noted that Bitcoin's recent decoupling from rallies in traditional equities and precious metals may indicate a deeper level of risk aversion among institutional and retail investors alike. This divergence suggests that crypto-specific factors, rather than broader market trends, may be driving the current price action.
Several key sentiment pressures are currently weighing on the market:
- Rising uncertainty over Federal Reserve policy direction: The lack of clear economic data makes it difficult for traders to anticipate the Fed's next moves, creating a risk-off environment
- Weak visibility on U.S. inflation and labor market trends: Without reliable economic indicators, market participants struggle to assess the true state of the economy
- Slowing liquidity inflows into digital assets: On-chain data suggests that new capital entering the crypto market has decreased significantly in recent weeks
- Declining volatility levels: Historically, periods of compressed volatility often precede sharp directional moves in either direction
The defensive positioning is also reflected in derivatives markets, where open interest in Bitcoin futures has declined while put option volumes have increased, indicating that traders are positioning for potential downside protection.
Bitcoin Technical Outlook: BTC Approaches a Decision Zone
From a technical analysis perspective, Bitcoin's daily chart shows a clean break below a long-term ascending trendline that had supported price action for several months, effectively shifting the market structure into a developing downtrend. A clear rejection candle formation at the $99,000 level underscored that sellers maintain control of the market, while current price action hovers above a critical liquidity band between $94,500 and $92,000.
The Relative Strength Index (RSI) currently rests near 31, indicating significant selling pressure but not yet confirming a definitive bottom. This level suggests the asset is approaching oversold territory but may still have room to decline further before a technical bounce occurs.
The current price action resembles a classic "break-and-retest" pattern commonly observed in trending markets: Bitcoin pierced through a key support level, attempted to reclaim it as new support, and ultimately failed to hold above it. This pattern is often a precursor to extended downside movement, as it confirms that the previous support has now become resistance.
From a network architecture perspective, it's worth noting that Bitcoin's Layer 0 infrastructure—the foundational protocol layer that ensures security and decentralization—continues to function flawlessly despite price volatility. The Layer 0 consensus mechanism, which forms the bedrock of Bitcoin's security model, has maintained its integrity throughout this market turbulence. This distinction between price action and fundamental network health is crucial for long-term investors to understand.
A further rejection at the $97,000–$99,000 resistance zone would likely expose the next major support at $91,600, followed by a potentially deeper move toward $83,000, which represents a significant volume node from earlier in the current market cycle. These levels are closely watched by both technical analysts and algorithmic trading systems.
Conversely, a bullish reversal scenario remains possible if buyers can decisively reclaim the $99,000 level with a strong daily candle close above this threshold. Such a move would open a recovery path toward $104,600 as the first target, followed by $116,200 as a more ambitious objective.
As volatility continues to compress within this range, the next significant breakout—whether to the upside or downside—may define the overall tone for year-end trading activity and potentially set the stage for early-cycle accumulation patterns ahead of the next major expansion phase in the cryptocurrency market cycle.
FAQ
What are the main reasons for Bitcoin dropping below $100,000?
Bitcoin's decline below $100,000 stems from profit-taking after its rally, increased market volatility, macroeconomic uncertainties, and shifts in institutional investor sentiment. Regulatory concerns and technical resistance levels also contributed to the pullback, triggering cascading sell orders across major trading volumes.
From a historical perspective, has Bitcoin experienced similar price pullbacks before? What were the final outcomes?
Yes, Bitcoin has experienced multiple significant pullbacks. After the 2017 rally, BTC dropped 65% but recovered to new highs by 2021. Similar corrections in 2018 and 2022 were followed by strong recoveries. These cycles typically precede new all-time highs within 12-24 months.
Does the current decline mean a bear market is coming, or is it just normal market adjustment?
This pullback appears to be normal consolidation rather than a bear market start. Bitcoin has experienced similar corrections during bull runs. Key support levels remain intact, and long-term momentum suggests the uptrend continues. Market fundamentals remain strong.
What strategy should investors adopt when Bitcoin prices drop? Should they buy the dip or wait and see?
Bitcoin pullbacks often present accumulation opportunities for long-term investors. Consider dollar-cost averaging to build positions gradually, rather than attempting perfect timing. Strong fundamentals support gradual accumulation during downturns for those with conviction in BTC's long-term trajectory.
Bitcoin price decline impacts on the overall cryptocurrency market
Bitcoin price drops typically trigger market-wide corrections as BTC dominates crypto sentiment. Altcoins often experience sharper declines, trading volumes decrease, and investor confidence weakens. However, such pullbacks can create buying opportunities and strengthen market fundamentals long-term.
What are the next support levels for BTC based on technical and fundamental analysis?
Based on current technical analysis, BTC's primary support levels are around $95,000-$97,000, with secondary support at $90,000. Fundamental factors suggest stronger holding potential above $92,000, where institutional accumulation typically activates.
How do institutional investors typically operate when Bitcoin price drops?
Institutional investors often view Bitcoin dips as buying opportunities, accumulating at lower prices. They may increase holdings, deploy capital from reserves, or execute strategic purchases to strengthen long-term positions. Some hedge through derivatives while maintaining core exposure.
What is the relationship between Bitcoin price and macroeconomic factors such as Federal Reserve policy and inflation?
Bitcoin price closely correlates with Fed policy and inflation. Hawkish Fed rates typically pressure BTC lower as investors shift to safer assets. Rising inflation drives Bitcoin demand as a hedge, supporting prices. Economic uncertainty and currency devaluation generally strengthen Bitcoin's appeal as digital gold.
* The information is not intended to be and does not constitute financial advice or any other recommendation of any sort offered or endorsed by Gate.