This comprehensive analysis examines Bitcoin price prediction for 2024, integrating expert forecasts with current market trends. The article projects a corrective window of 114-174 days with a probable price low between $70,000-$80,000, while emphasizing the critical importance of reclaiming the $98,000-$106,800 confluence zone for sustained bull market structure. Unlike the bearish 2021-22 environment, macro conditions now favor risk assets through cooling inflation, dovish Fed policy, and quantitative tightening conclusion. Technical analysis reveals Bitcoin trading within a descending channel with key resistance at $90,774 and $93,966. The article addresses crucial questions about Bitcoin market sentiment, institutional positioning, and Federal Reserve policy impacts, providing traders and investors actionable insights for navigating 2024's volatile cryptocurrency landscape and identifying optimal entry points on platforms like Gate.
Bitcoin Price Prediction
Bitcoin has experienced a significant 20% weekly decline, reigniting discussions about a potential deeper market downturn. However, market analysts suggest that one critical factor—the emergence or absence of a counter-trend rally—may ultimately determine the trajectory of the broader cycle. According to market analyst Kevin's comprehensive analysis, the present selloff appears to fit within the parameters of a typical mid-cycle correction rather than representing a confirmed market top.
Several structural breaks have contributed to the prevailing bearish sentiment in the market. Bitcoin has fallen below both the 2-day 200 EMA (Exponential Moving Average) and SMA (Simple Moving Average), breached the 50-week SMA, and lost the critical $98,000–$106,800 confluence zone. This price range is particularly significant as it contains multiple long-term Fibonacci retracement markers that have historically acted as strong support levels. Additionally, cycle return profiles currently resemble patterns typically observed in late-cycle phases, adding further pressure to market sentiment.
Based on historical patterns and technical analysis, Kevin projects a corrective window spanning approximately 114–174 days. During this period, a probable price low is expected to form within the $70,000 to $80,000 range. What happens after this correction will be the defining moment: the subsequent counter-trend rally will reveal whether the broader bull cycle remains structurally intact or if a more prolonged bear phase is beginning.
The key technical benchmark to watch is the reclaim of the $98,000–$106,800 zone. A successful recapture of this range would signal renewed upward momentum and suggest that the bull market structure remains valid. Conversely, a rejection at these levels would indicate that the market may be transitioning into a deeper and more sustained bearish phase. This makes the upcoming price action particularly critical for both short-term traders and long-term investors.
Macro Backdrop Shows a Different Landscape
When evaluating the present market environment, it is essential to distinguish it from the conditions that prevailed during the 2021–22 market peak. During that period, several negative macroeconomic factors converged simultaneously: inflation was accelerating rapidly, the Federal Reserve was implementing aggressive interest rate hikes, and quantitative tightening (QT) had just commenced. These factors created a hostile environment for risk assets, including cryptocurrencies.
The macroeconomic backdrop in the present cycle stands in stark contrast to those conditions:
- Inflation trajectory: Inflation continues to show a cooling trend, reducing pressure on monetary policy
- Federal Reserve policy: The Fed is preparing to ease monetary conditions rather than tighten them further
- Quantitative tightening: The Fed's balance sheet reduction program is scheduled to conclude in December, removing a significant headwind for risk assets
- Economic indicators: PMI (Purchasing Managers' Index) readings remain below the 50 threshold, which historically has been supportive for risk assets as it indicates potential for monetary stimulus
These macroeconomic conditions suggest a fundamentally different environment that may not support the same type of prolonged bear market that occurred in 2021–22. The combination of easing inflation, dovish central bank policy, and weakening economic indicators typically creates a more favorable backdrop for risk assets over the medium term.
Market sentiment indicators also diverge significantly from typical cycle peak characteristics. Social media metrics and engagement levels have declined to multi-year lows, standing in sharp contrast to the euphoria and widespread retail participation that typically marks major market tops. This subdued sentiment suggests that the market may not have reached the excessive optimism levels that precede significant bear markets. Instead, the present conditions may represent a mid-cycle correction within an ongoing bull market, creating potential opportunities for strategic accumulation.
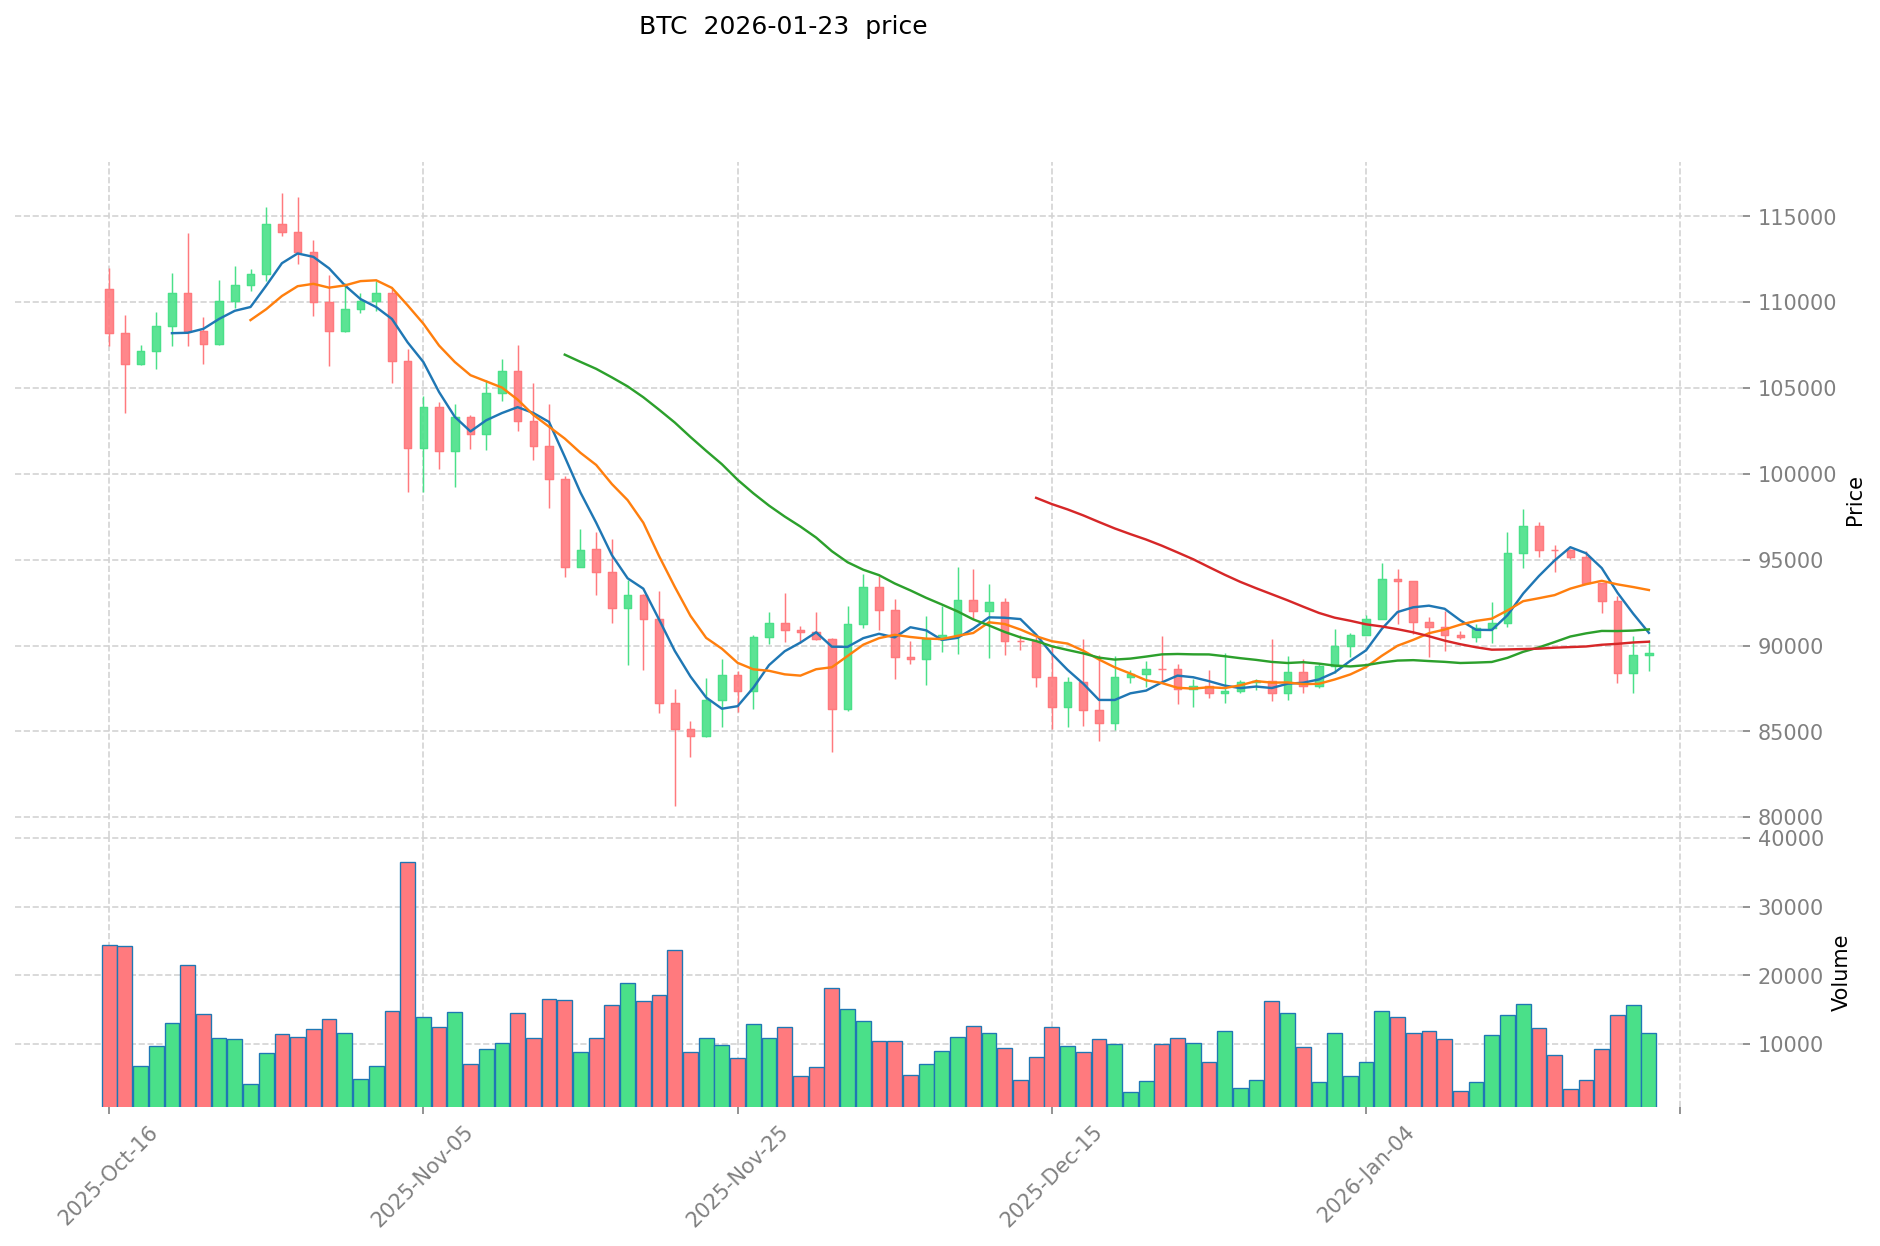
Bitcoin Technical Outlook: BTC Stabilizes Inside a Downward Channel
From a technical analysis perspective, Bitcoin continues to trade within a well-defined descending channel pattern. Since October, every significant rally attempt has been capped by the upper boundary of this channel, creating a consistent pattern of lower highs that defines the present downtrend structure.
The price remains positioned below both the 20-day and 200-day Exponential Moving Averages, which are critical dynamic resistance levels that often dictate medium-term trend direction. The most recent bounce from lower levels has not yet produced the strong bullish candles and volume characteristics typically associated with full trend reversals. This suggests that while selling pressure may be diminishing, buying conviction has not yet reached levels sufficient to confirm a reversal.
The Relative Strength Index (RSI) has lifted off oversold territory, indicating that the most extreme selling pressure has subsided. However, the RSI has not yet formed a bullish divergence pattern—a technical signal that would suggest underlying strength despite lower prices. This absence of divergence means that the technical setup remains neutral to bearish until stronger confirmation signals emerge.
Immediate resistance levels to monitor are positioned at $90,774 and $93,966, corresponding to the 0.382 and 0.50 Fibonacci retracement levels respectively. These levels represent natural points where previous sellers may attempt to exit positions, creating resistance zones. A decisive breakout above the descending channel, combined with a daily close above the 20-day EMA, would represent a significant shift in market structure.
Such a breakout would open a path toward $97,135 as the next intermediate target, with potential extension toward $107,358. This higher target aligns with the next major resistance cluster that includes the previously mentioned confluence zone of long-term technical indicators. Achievement of these levels would suggest that the corrective phase has concluded and a new leg of the bull market is underway.
As price volatility compresses within the descending channel, the market is approaching a critical decision point. The upcoming rally attempt—or the failure to sustain one—will serve as the definitive signal for whether Bitcoin is preparing for a renewed advance toward new highs or entering a more prolonged period of consolidation and potential decline. Traders and investors should pay close attention to volume patterns, momentum indicators, and the behavior of price at these critical technical levels to position themselves appropriately for the next major market move.
FAQ
Why is the current market generally bearish on Bitcoin prices?
Market pessimism stems from macroeconomic headwinds, including persistent inflation concerns, potential interest rate hikes, and weakening institutional demand. Additionally, regulatory uncertainty and profit-taking after recent rallies have intensified bearish sentiment among traders.
What type of events could trigger a reversal in Bitcoin market sentiment?
Major regulatory approval like Bitcoin ETF adoption, significant institutional investment, macroeconomic policy shifts, technological breakthroughs in blockchain, or major geopolitical developments affecting traditional finance could flip market sentiment from bearish to bullish.
What are the main methods for Bitcoin price prediction?
Bitcoin price prediction relies on technical analysis (charts, indicators), fundamental analysis (adoption, regulation), on-chain metrics (transaction volume, holder behavior), market sentiment analysis, and macroeconomic factors like inflation and interest rates.
In a bearish market, where are Bitcoin's support and resistance levels?
In the current bearish market, Bitcoin's key support level sits around $42,000-$45,000, while resistance is near $50,000-$52,000. Breaking below $40,000 would signal stronger downside, while reclaiming $55,000 could reverse the bearish trend significantly.
How do Federal Reserve policies and economic data affect Bitcoin price?
Federal Reserve rate decisions and economic data directly influence Bitcoin through market sentiment and capital flows. Tight monetary policy typically pressures Bitcoin, while accommodative policies and inflation concerns boost demand. Economic indicators like inflation, employment, and GDP growth shape investor appetite for risk assets like Bitcoin.
Does the shift in institutional investor sentiment signal a market reversal?
Yes. Institutional investor sentiment is a powerful market indicator. When major institutions shift from bearish to bullish positions, it typically precedes significant price rallies. Increased institutional buying activity and positive positioning changes often catalyze broader market reversals, especially in Bitcoin markets where whale movements significantly influence price direction.
What is the historical impact of Bitcoin halving and ETF approvals on price?
Bitcoin halving events historically triggered significant price rallies within 12 months, with 2012 and 2016 halvings followed by major bull runs. Spot Bitcoin ETF approvals in 2024 massively increased institutional adoption and trading volume, driving sustained price appreciation. These catalytic events typically create sustained uptrends through increased demand and mainstream accessibility.
What signals do Bitcoin's technical and fundamental aspects currently show?
Technical indicators show mixed signals with resistance near key levels, while fundamentals remain strong supported by institutional adoption and network growth. Market sentiment appears oversold, suggesting potential recovery opportunity ahead.
* The information is not intended to be and does not constitute financial advice or any other recommendation of any sort offered or endorsed by Gate.