This analysis examines whether Bitcoin's recent 20% decline represents a mid-cycle correction or a confirmed bear market top. The critical missing element is a successful counter-trend rally at the $98,000–$106,800 support zone, which will determine the entire bull cycle trajectory. Technical analysis shows Bitcoin trading within a descending channel below key moving averages, with potential price targets between $70,000–$80,000. Crucially, macroeconomic conditions differ sharply from the 2021–22 bear market: inflation is moderating, the Federal Reserve signals rate cuts, and quantitative tightening ends soon. Market sentiment metrics remain subdued, lacking the euphoria typical of cycle peaks. This comprehensive framework helps investors understand Bitcoin price dynamics through technical indicators and fundamental catalysts on Gate and other trading platforms.
Market Sentiment Shift and the Missing Catalyst
A dramatic sentiment shift has swept through cryptocurrency markets following Bitcoin's significant 20% decline over a week-long period. However, beneath the surface pessimism lies a critical missing element that could fundamentally reshape every Bitcoin price prediction for this market cycle.
 The absence of a counter-trend rally, which typically emerges during mid-cycle corrections, may ultimately determine the entire trajectory of the ongoing bull market.
Analyst Kevin, in his comprehensive market analysis, presents a compelling case that the prevailing selloff aligns more closely with a typical mid-cycle correction rather than signaling a confirmed market top. This distinction carries profound implications for investors attempting to navigate the volatile cryptocurrency landscape.
Several structural breaks have intensified the bearish narrative surrounding Bitcoin. The cryptocurrency has fallen below critical technical levels, including the 2-day 200 Exponential Moving Average (EMA) and Simple Moving Average (SMA). Additionally, Bitcoin has breached the 50-week SMA and lost support at the crucial $98,000–$106,800 confluence zone. This price range holds particular significance as it represents an area densely packed with long-term Fibonacci retracement markers, which many technical traders use as key decision points.
Further complicating the outlook, cycle return profiles have begun to resemble patterns typically observed during late-cycle market phases, adding additional pressure to short-term price expectations. Kevin's analysis estimates a corrective window spanning 114–174 days, with a probable price bottom forming somewhere between $70,000 and $80,000. This range represents a healthy correction of approximately 25-35% from recent highs, which historically falls within normal parameters for Bitcoin bull market pullbacks.
What follows this correction period represents the pivotal moment for the entire market cycle: the emergence and strength of a counter-trend rally. This rally will serve as the critical test revealing whether the broader bull cycle remains structurally intact or whether the market has entered a more prolonged bearish phase. A successful reclaim of the $98,000–$106,800 zone would signal renewed upward momentum and potentially validate the mid-cycle correction thesis. Conversely, a rejection at these levels would indicate a deeper bear phase may be underway, forcing market participants to reassess their longer-term bullish assumptions.
Macro Backdrop Shows a Different Landscape
A careful examination of the macroeconomic environment reveals a landscape dramatically different from the 2021–22 market top, when Bitcoin reached its previous all-time high before entering a prolonged bear market. The analyst emphasizes the importance of not drawing false parallels between these two distinct periods, as the underlying economic conditions have shifted substantially.
During the 2021–22 period, inflation was accelerating rapidly, reaching multi-decade highs that forced central banks worldwide into aggressive action. The Federal Reserve was raising interest rates at the fastest pace in decades, implementing multiple 75 basis point hikes in quick succession. Quantitative tightening had just commenced, removing liquidity from financial markets at an unprecedented rate. This combination of factors created an extremely hostile environment for risk assets, including cryptocurrencies.
The prevailing backdrop presents a stark contrast across multiple dimensions:
-
Inflation dynamics: Inflation continues to moderate and move closer to central bank targets, reducing the urgency for restrictive monetary policy. Recent data shows a sustained downward trend in core inflation metrics, suggesting the most aggressive phase of inflation has passed.
-
Federal Reserve policy stance: The Fed has signaled its preparation to ease monetary policy, with market participants anticipating potential rate cuts in the coming quarters. This represents a fundamental shift from the tightening cycle that characterized the previous market top.
-
Quantitative tightening timeline: The Fed's balance sheet reduction program is scheduled to conclude by the end of the year, marking a transition point that historically has been supportive for risk assets. The end of quantitative tightening often precedes renewed liquidity injections into the financial system.
-
Economic activity indicators: Purchasing Managers' Indices (PMIs) remain below the 50 threshold, indicating economic contraction. While this might seem negative on the surface, historical patterns demonstrate that such conditions often prove supportive for risk assets, as they increase the likelihood of accommodative monetary policy and fiscal stimulus.
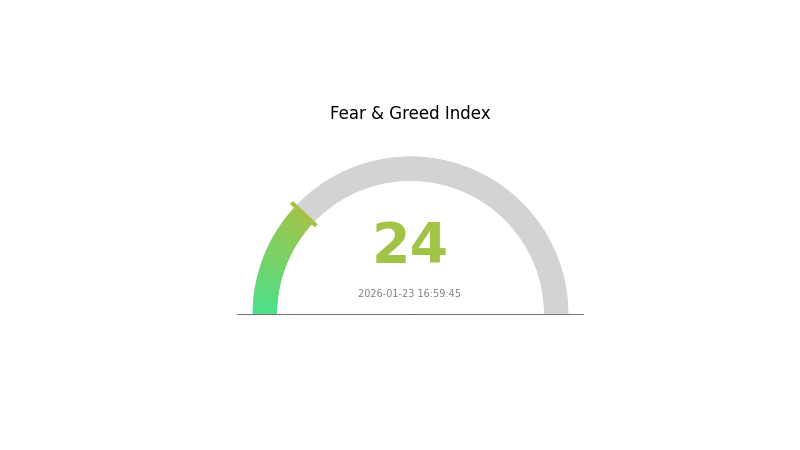
Equally important, market sentiment metrics do not resemble those typically observed at major cycle peaks. Social media engagement metrics, search volume data, and retail participation indicators have all dropped to multi-year lows. This stands in sharp contrast to the euphoric conditions that typically mark significant market tops, when mainstream media coverage reaches fever pitch and retail investors rush to enter positions. The absence of this euphoria suggests the market may have considerable room for upward movement before reaching true cycle peak conditions.
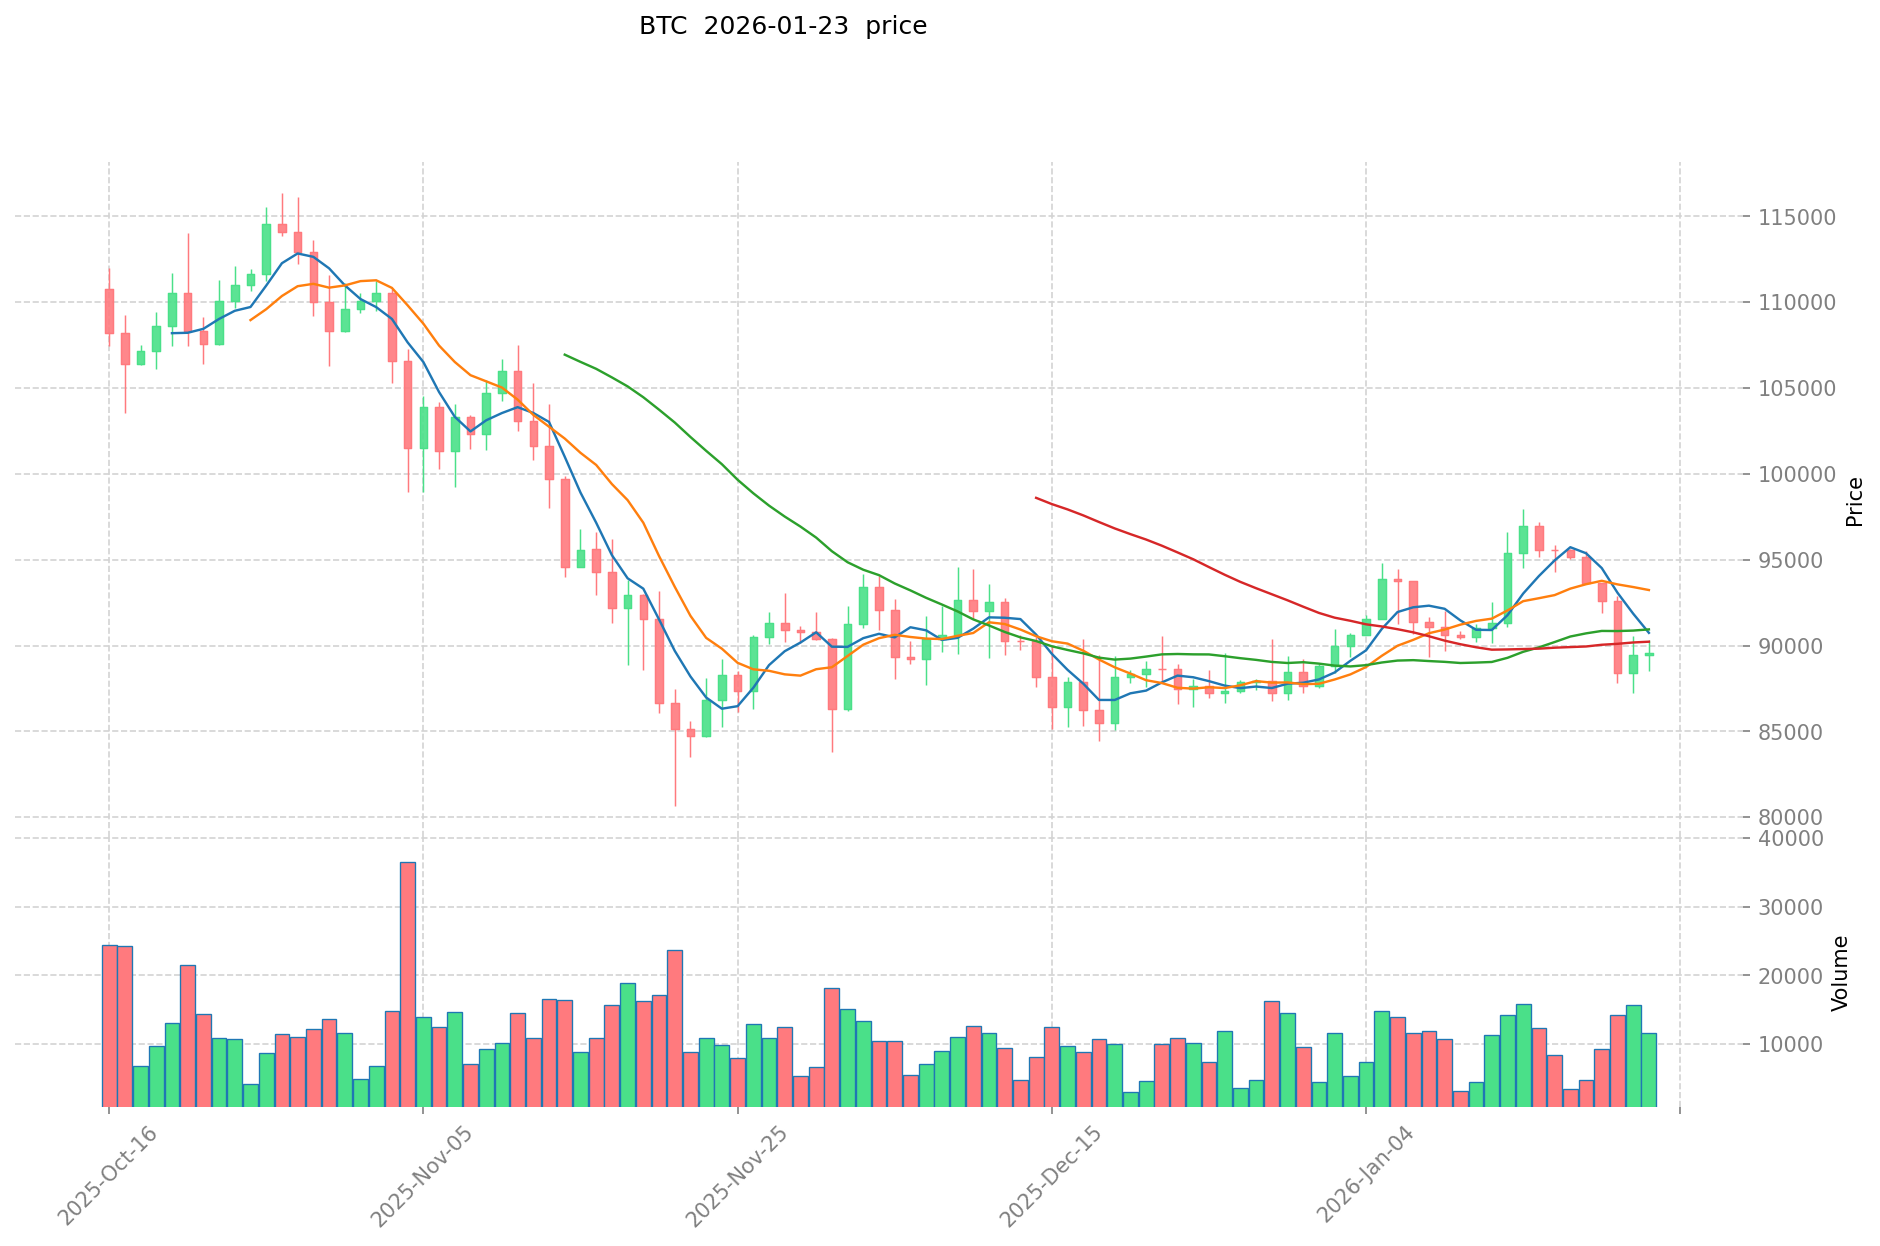
Bitcoin Technical Outlook: BTC Stabilizes Inside a Downward Channel
From a technical analysis perspective, Bitcoin continues to trade within a clearly defined descending channel pattern that has constrained price action since October. This channel represents a bearish structure where each rally attempt has been systematically capped by the upper boundary, preventing any sustained breakout to the upside. Understanding this technical framework is essential for anticipating potential reversal points or continuation of the downtrend.
The price remains positioned below both the 20-day and 200-day Exponential Moving Averages (EMAs), which serve as dynamic resistance levels. The 20-day EMA typically represents short-term momentum, while the 200-day EMA is widely regarded as a dividing line between bull and bear markets. The fact that Bitcoin trades below both suggests the path of least resistance remains to the downside in the near term.
The most recent bounce from oversold levels has not yet produced the strong bullish candles and volume characteristics typically associated with full trend reversals. Instead, the recovery has been characterized by relatively weak buying pressure and limited follow-through, indicating that sellers maintain control of the market structure. This tepid response to oversold conditions suggests that additional downside testing may be necessary before a more robust recovery can take hold.
The Relative Strength Index (RSI) has lifted off deeply oversold territory, moving from extreme readings back toward neutral levels. However, the RSI has not yet formed a bullish divergence pattern, which would occur if the indicator makes higher lows while price makes lower lows. Such divergences often precede significant trend reversals and remain a key signal that technical analysts monitor closely.
Immediate resistance levels that warrant close attention sit at $90,774 and $93,966, corresponding to the 0.382 and 0.50 Fibonacci retracement levels respectively. These mathematical levels represent common retracement points where previous trends often resume. A breakout above the descending channel combined with a daily close above the 20-day EMA would represent a significant shift in market structure, potentially opening a path toward $97,135 and eventually $107,358. These higher targets align with the next major resistance cluster, where multiple technical indicators and historical price levels converge.
Support levels remain equally critical to monitor. The $70,000–$80,000 range represents a key demand zone where long-term holders and institutional buyers may step in to defend the market. A breakdown below this range would invalidate the mid-cycle correction thesis and suggest a more serious structural breakdown may be underway.
As volatility compresses within the descending channel, the market approaches a critical inflection point. The strength and sustainability of the coming rally, or the failure to generate one, will ultimately determine whether Bitcoin is preparing for a renewed advance toward new all-time highs or entering a broader, more prolonged downturn that could last multiple quarters. Market participants should remain vigilant and prepared for increased volatility as this critical juncture approaches, while maintaining disciplined risk management regardless of their directional bias.
FAQ
What are the main methods for Bitcoin price prediction? How are technical analysis and fundamental analysis applied?
Bitcoin price prediction uses technical analysis(chart patterns, moving averages, RSI indicators)and fundamental analysis(adoption rates, regulatory changes, macroeconomic factors). Technical analysis identifies trends, while fundamental analysis evaluates long-term value drivers. Combined analysis provides comprehensive market outlook.
What are the main reasons for the bearish sentiment on Bitcoin in the current market?
Current bearish sentiment stems from macroeconomic concerns including potential rate hikes, inflation uncertainties, and geopolitical tensions. Additionally, regulatory pressures, large-scale liquidations, and profit-taking after recent rallies have weakened short-term momentum.
Which events or factors could cause a reversal in Bitcoin market sentiment?
Major catalysts include institutional adoption announcements, regulatory clarity, macroeconomic shifts favoring risk assets, significant transaction volume increases, technology upgrades, and geopolitical developments affecting global markets.
What are some historical cases of Bitcoin sentiment shifting from bearish to bullish?
Bitcoin has experienced multiple bearish-to-bullish reversals: 2015 after the Mt. Gox collapse recovery, 2017 institutional adoption catalysts, 2020 pandemic-driven adoption surge, and 2023 spot ETF approval. Each reversal was triggered by regulatory clarity, institutional inflow, or macro economic shifts that fundamentally changed market perception.
How to assess the reliability of Bitcoin price predictions? What indicators should be monitored?
Evaluate predictions by tracking on-chain metrics like whale transactions and exchange flows, monitor technical indicators such as RSI and MACD, analyze trading volume trends, watch macro catalysts including regulatory news and macroeconomic events, and assess predictor track records. Multiple data sources increase reliability.
In bearish markets, consider dollar-cost averaging to reduce timing risk, accumulate quality assets at lower prices, diversify your portfolio, and maintain long-term conviction. Market downturns often precede significant rallies, making strategic positioning crucial for maximizing future gains.
* The information is not intended to be and does not constitute financial advice or any other recommendation of any sort offered or endorsed by Gate.