This comprehensive guide explores how to trade Bitcoin during bearish market trends by analyzing current technical patterns and macroeconomic factors. The article examines Bitcoin's 20% weekly decline within the context of mid-cycle corrections versus confirmed bear phases, highlighting the critical importance of counter-trend rallies. Technical analysis reveals Bitcoin trading within a descending channel below key moving averages, with Fibonacci retracement levels serving as crucial resistance zones. The macroeconomic backdrop differs significantly from the 2021-2022 bear market, featuring cooling inflation, upcoming Fed easing, and the conclusion of quantitative tightening by December. Traders will discover specific entry strategies, resistance targets at $90,774 and $93,966, and how to identify potential reversals using RSI and moving average crossovers. This analysis equips cryptocurrency traders with actionable insights for navigating volatile markets and identifying opportunities through Gate trading pl
Overview of Bitcoin's Current Market Position
Bitcoin has experienced a significant 20% weekly decline that has reignited discussions about a potential deeper market correction. However, according to analyst Kevin's recent market analysis, one critical factor remains absent — a counter-trend rally that could fundamentally reshape the trajectory of the entire cycle.
 This missing element may ultimately determine whether the asset enters a prolonged bear phase or continues within the broader bull market structure.
Kevin's analysis suggests that this selloff aligns more closely with a typical mid-cycle correction rather than representing a confirmed market top. This distinction is crucial for traders and investors attempting to position themselves appropriately for the next phase of price movement. Understanding the difference between a temporary pullback and a structural reversal can mean the difference between capitalizing on opportunity and suffering significant losses.
Several technical indicators have broken down in ways that support the bearish narrative currently dominating market sentiment. Bitcoin has fallen below both the 2-day 200 EMA and SMA, which are widely regarded as long-term trend indicators. Additionally, the asset has breached the 50-week SMA, another critical level that often serves as support during bull markets. Perhaps most significantly, Bitcoin has lost the $98,000–$106,800 confluence zone, an area densely populated with long-term Fibonacci retracement levels that had previously provided strong support.
The cycle return profiles currently being observed bear resemblance to late-cycle readings, which naturally adds pressure to the market outlook and fuels concerns about whether the bull run has reached its conclusion. These metrics compare current price performance against historical cycle patterns, and when they begin to mirror late-stage characteristics, it typically warrants increased caution from market participants.
Based on historical patterns and current market structure, Kevin estimates a corrective window lasting between 114 and 174 days. Within this timeframe, he anticipates a probable low forming in the $70,000 to $80,000 range. This projection is derived from analyzing previous mid-cycle corrections and applying similar mathematical frameworks to the current situation. However, what happens after this potential bottom forms is where the critical inflection point lies.
The counter-trend rally that follows any corrective low will serve as the definitive test of whether the broader bull cycle remains intact. If Bitcoin can reclaim the $98,000–$106,800 confluence zone during this rally, it would signal that buyers retain control and that the upward momentum can resume. Conversely, if price is rejected at this zone and fails to establish support above it, this would indicate that the market has entered a deeper bear phase requiring a more extended period of consolidation or decline before any sustainable recovery can begin.
Macro Backdrop Shows a Different Landscape
When evaluating the current market environment, Kevin emphasizes the importance of avoiding direct comparisons with the 2021-2022 market top. While surface-level similarities might exist in terms of price decline percentages, the underlying macroeconomic conditions differ substantially, and these differences could prove decisive in determining future price direction.
During the 2021-2022 period, inflation was accelerating rapidly, reaching multi-decade highs that forced central banks into aggressive action. The Federal Reserve responded by implementing one of the fastest rate-hiking cycles in modern history, dramatically tightening financial conditions. Simultaneously, quantitative tightening had just commenced, removing liquidity from the financial system at a time when markets were already under pressure. This combination created an extremely hostile environment for risk assets, including Bitcoin and other cryptocurrencies.
The current macroeconomic backdrop presents a markedly different picture across several key dimensions. Inflation has been cooling steadily over recent quarters, moving closer to central bank targets and reducing the urgency for restrictive monetary policy. This disinflationary trend removes one of the primary headwinds that weighed on risk assets during the previous downturn.
Furthermore, the Federal Reserve is now preparing to ease monetary policy rather than tighten it. This represents a fundamental shift in the policy stance that typically proves supportive for assets like Bitcoin that are sensitive to liquidity conditions. When central banks move toward easing, it generally signals improving conditions for risk assets and can provide a tailwind for price appreciation.
Perhaps most significantly, quantitative tightening is scheduled to conclude in December. The cessation of balance sheet reduction means that one of the key mechanisms for removing liquidity from the financial system will no longer be in operation. This shift could prove particularly important for Bitcoin and other cryptocurrencies, which have historically shown sensitivity to changes in global liquidity conditions.
Additionally, Purchasing Managers' Indexes (PMIs) remain below the 50 threshold, which separates expansion from contraction. Historically, when PMIs hover in this range, it has often coincided with periods where central banks maintain accommodative policies longer than they otherwise might, creating conditions that have proven supportive for risk assets. This dynamic suggests that the macro environment may be more favorable for Bitcoin than the recent price action would indicate.
Market sentiment metrics also fail to resemble the characteristics typically observed at major cycle peaks. Social media engagement and search interest related to Bitcoin have dropped to multi-year lows, standing in stark contrast to the euphoria and mainstream attention that typically marks significant market tops. When retail interest wanes to this degree, it often indicates that speculative excess has been wrung out of the market, potentially setting the stage for the next accumulation phase rather than signaling the end of the bull cycle.
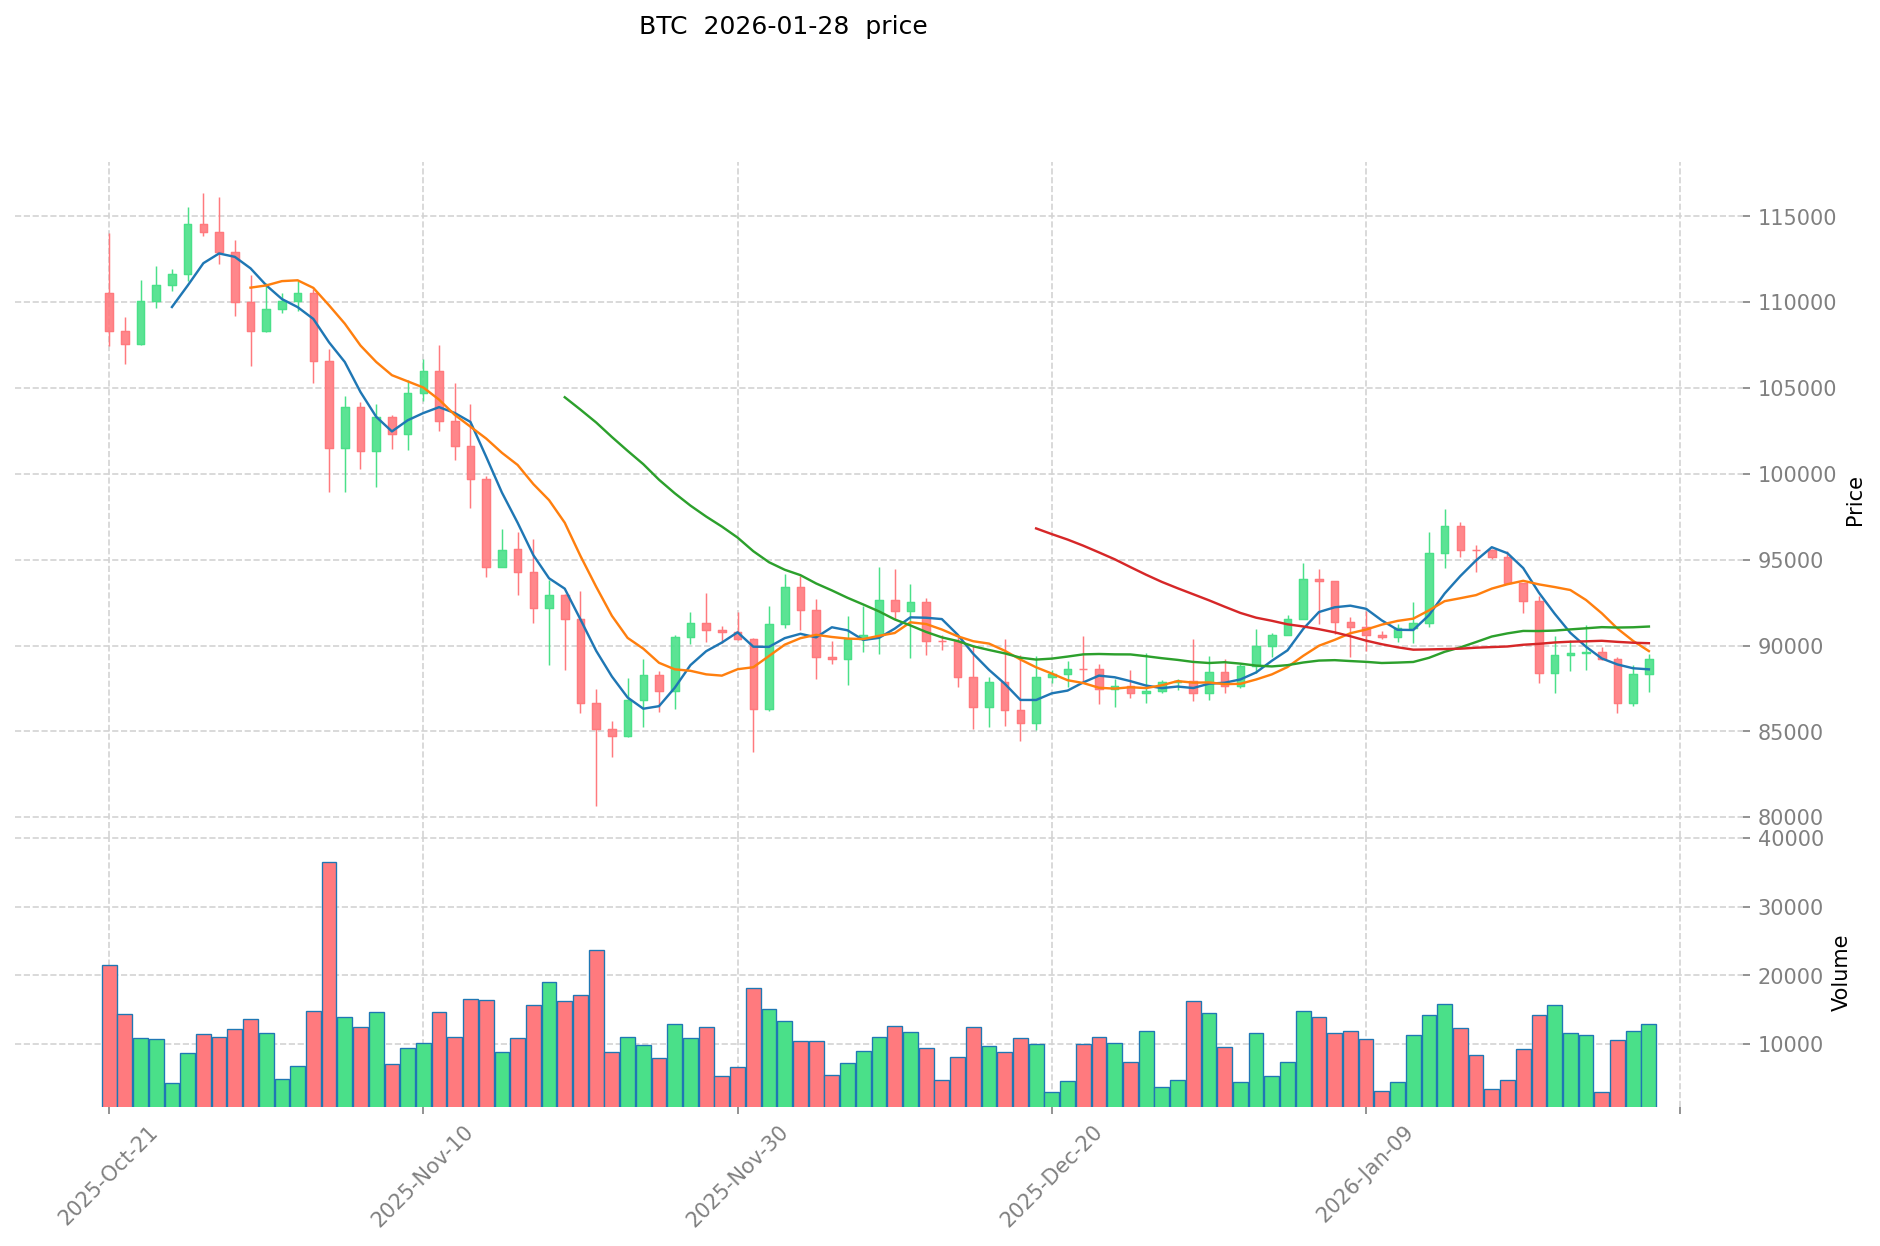
Bitcoin Technical Outlook: BTC Stabilizes Inside a Downward Channel
From a technical analysis perspective, Bitcoin continues to trade within a well-defined descending channel pattern that has governed price action since October. This channel has proven remarkably consistent, with every significant rally attempt being capped by the upper boundary of the formation. This repeated rejection at the channel resistance demonstrates that sellers remain in control at higher price levels, at least for the time being.
Price currently remains positioned below both the 20-day and 200-day Exponential Moving Averages, which are widely monitored trend indicators. The 20-day EMA typically represents short-term trend direction, while the 200-day EMA serves as a barometer for long-term trend health. Trading below both of these levels confirms that the immediate trend remains bearish across multiple timeframes, and reclaiming these moving averages would be necessary to signal a meaningful shift in momentum.
The most recent bounce from lower levels has not yet produced the type of strong, decisive candles that are typically associated with full trend reversals. Instead, the recovery has been characterized by relatively modest gains and limited follow-through, suggesting that buyer conviction remains tentative. This lack of forceful buying pressure indicates that market participants are not yet confident enough to commit significant capital to the long side.
The Relative Strength Index (RSI) has lifted off oversold territory, which is a positive development in that it shows selling pressure has diminished from extreme levels. However, the RSI has not yet formed bullish divergence, which would occur if price made lower lows while RSI made higher lows. Such divergence often precedes meaningful reversals, and its absence suggests that the technical setup for a sustained rally is not yet complete.
The immediate resistance levels that warrant close attention are positioned at $90,774 and $93,966, which correspond to the 0.382 and 0.50 Fibonacci retracement levels respectively. These mathematical levels are derived from the recent decline and represent areas where previous buyers may be positioned, potentially creating selling pressure as those participants look to exit positions near breakeven. Successfully clearing these levels would be an important step in rebuilding bullish momentum.
A breakout above the descending channel combined with a daily close above the 20-day EMA would represent a significant technical development. Such a move would open a path toward $97,135 as the next upside target, with $107,358 serving as a more ambitious objective that aligns with the major resistance cluster discussed earlier. Reaching these higher levels would require sustained buying pressure and would likely coincide with improving sentiment across the broader cryptocurrency market.
As volatility compresses within the descending channel, the market is approaching a critical juncture. The coming rally attempt, or the failure to sustain one, will determine whether Bitcoin is preparing for a renewed advance within the context of the ongoing bull cycle, or whether it is entering a broader and more extended downturn that will require additional time and potentially lower prices before establishing a durable bottom. Traders and investors should monitor these technical levels closely, as the price action around these zones will provide valuable insights into the balance of power between buyers and sellers and offer clues about the most probable path forward for Bitcoin in the coming weeks and months.
FAQ
Why is the current market sentiment on Bitcoin generally bearish? What are the main reasons?
Current bearish sentiment stems from increased price decline expectations and investor concerns over regulatory policy changes. Additionally, macro economic uncertainties and profit-taking pressures contribute to the negative outlook on Bitcoin.
Which major events or policy changes could cause Bitcoin price reversal?
Regulatory relaxation and government support for crypto strengthen market confidence. Economic uncertainty boosts Bitcoin's safe-haven appeal. Institutional adoption increases and macroeconomic shifts from monetary tightening to easing could trigger significant price reversals.
In a bearish market environment, what are the bases and methods for Bitcoin price prediction?
Bitcoin price predictions rely on technical analysis, on-chain metrics, market sentiment indicators, regulatory developments, macroeconomic trends, and institutional adoption rates. These factors combined help assess potential price movements despite current bearish conditions.
What historical instances have shown Bitcoin price sentiment shifting from bearish to bullish?
Bitcoin experienced major bearish-to-bullish reversals in 2017 and 2021, with significant surges from mid-year through year-end. Key catalysts included halving events, supply contractions, institutional adoption announcements, and macroeconomic factors that reignited market confidence.
How should investors assess Bitcoin risks and opportunities in a bearish market?
In bearish markets, focus on options market sentiment and demand exhaustion risks. Identify panic-driven buying opportunities while maintaining flexible positioning strategies to navigate uncertainty and capitalize on short-term volatility.
* The information is not intended to be and does not constitute financial advice or any other recommendation of any sort offered or endorsed by Gate.