This comprehensive investment guide compares BLD (Agoric) and BNB (Binance Coin), two distinct cryptocurrency assets with different market positioning and growth trajectories. BLD, an early-stage JavaScript-based smart contract platform, currently trades at $0.005269 with a $3.64 million market cap, while BNB, the established Binance ecosystem token, trades at $848.4 with a $115.69 billion market cap. The article analyzes historical price performance, revealing BLD's 98.6% decline from its 2024 peak and BNB's consistent growth trajectory. Through detailed 2026-2031 price forecasts, supply mechanism analysis, and liquidity comparisons, the guide evaluates both tokens across multiple dimensions including institutional adoption, technological ecosystems, and regulatory considerations. Investment allocation recommendations range from conservative (BLD 5-10%, BNB 20-30%) to aggressive profiles, with particular emphasis on risk management strategies. This analysis addresses key investor questions about market posit
Introduction: BLD vs BNB Investment Comparison
In the cryptocurrency market, the comparison between BLD and BNB has become a topic of interest for investors. The two differ significantly in market cap ranking, application scenarios, and price performance, representing distinct positioning within the crypto asset landscape.
Agoric (BLD): A general-purpose smart contract platform designed for building web3 applications using JavaScript, featuring native interoperability with Cosmos and other Layer 1 blockchains through the Inter-blockchain Communication Protocol (IBC).
Binance Coin (BNB): Launched in July 2017 as a decentralized digital asset issued by Binance, it serves as the fuel for the Binance ecosystem with utilities including transaction fee discounts and payment functions, maintaining a position among the top cryptocurrencies globally.
This article will provide a comprehensive analysis of BLD vs BNB investment value comparison, covering historical price trends, supply mechanisms, institutional adoption, technical ecosystems, and future outlook, attempting to address investors' key question:
"Which is the better buy right now?"
I. Historical Price Comparison and Current Market Status
BLD (Agoric) and BNB (Binance Coin) Historical Price Trends
- 2024: BLD reached its all-time high of $0.29342 on January 8, 2024, reflecting early market enthusiasm for the Agoric platform.
- 2025: BLD experienced significant downward pressure, falling to its all-time low of $0.004011 in September 2025, representing a decline of approximately 98.6% from its peak.
- 2017-2025: BNB demonstrated substantial growth from its all-time low of $0.0398177 in October 2017 to its all-time high of $1,369.99 in October 2025, reflecting the expansion of the Binance ecosystem.
- Comparative Analysis: During the 2024-2025 market cycle, BLD declined from $0.29342 to $0.004011, while BNB showed resilience with growth of approximately 26.77% over the past year, despite recent short-term volatility.
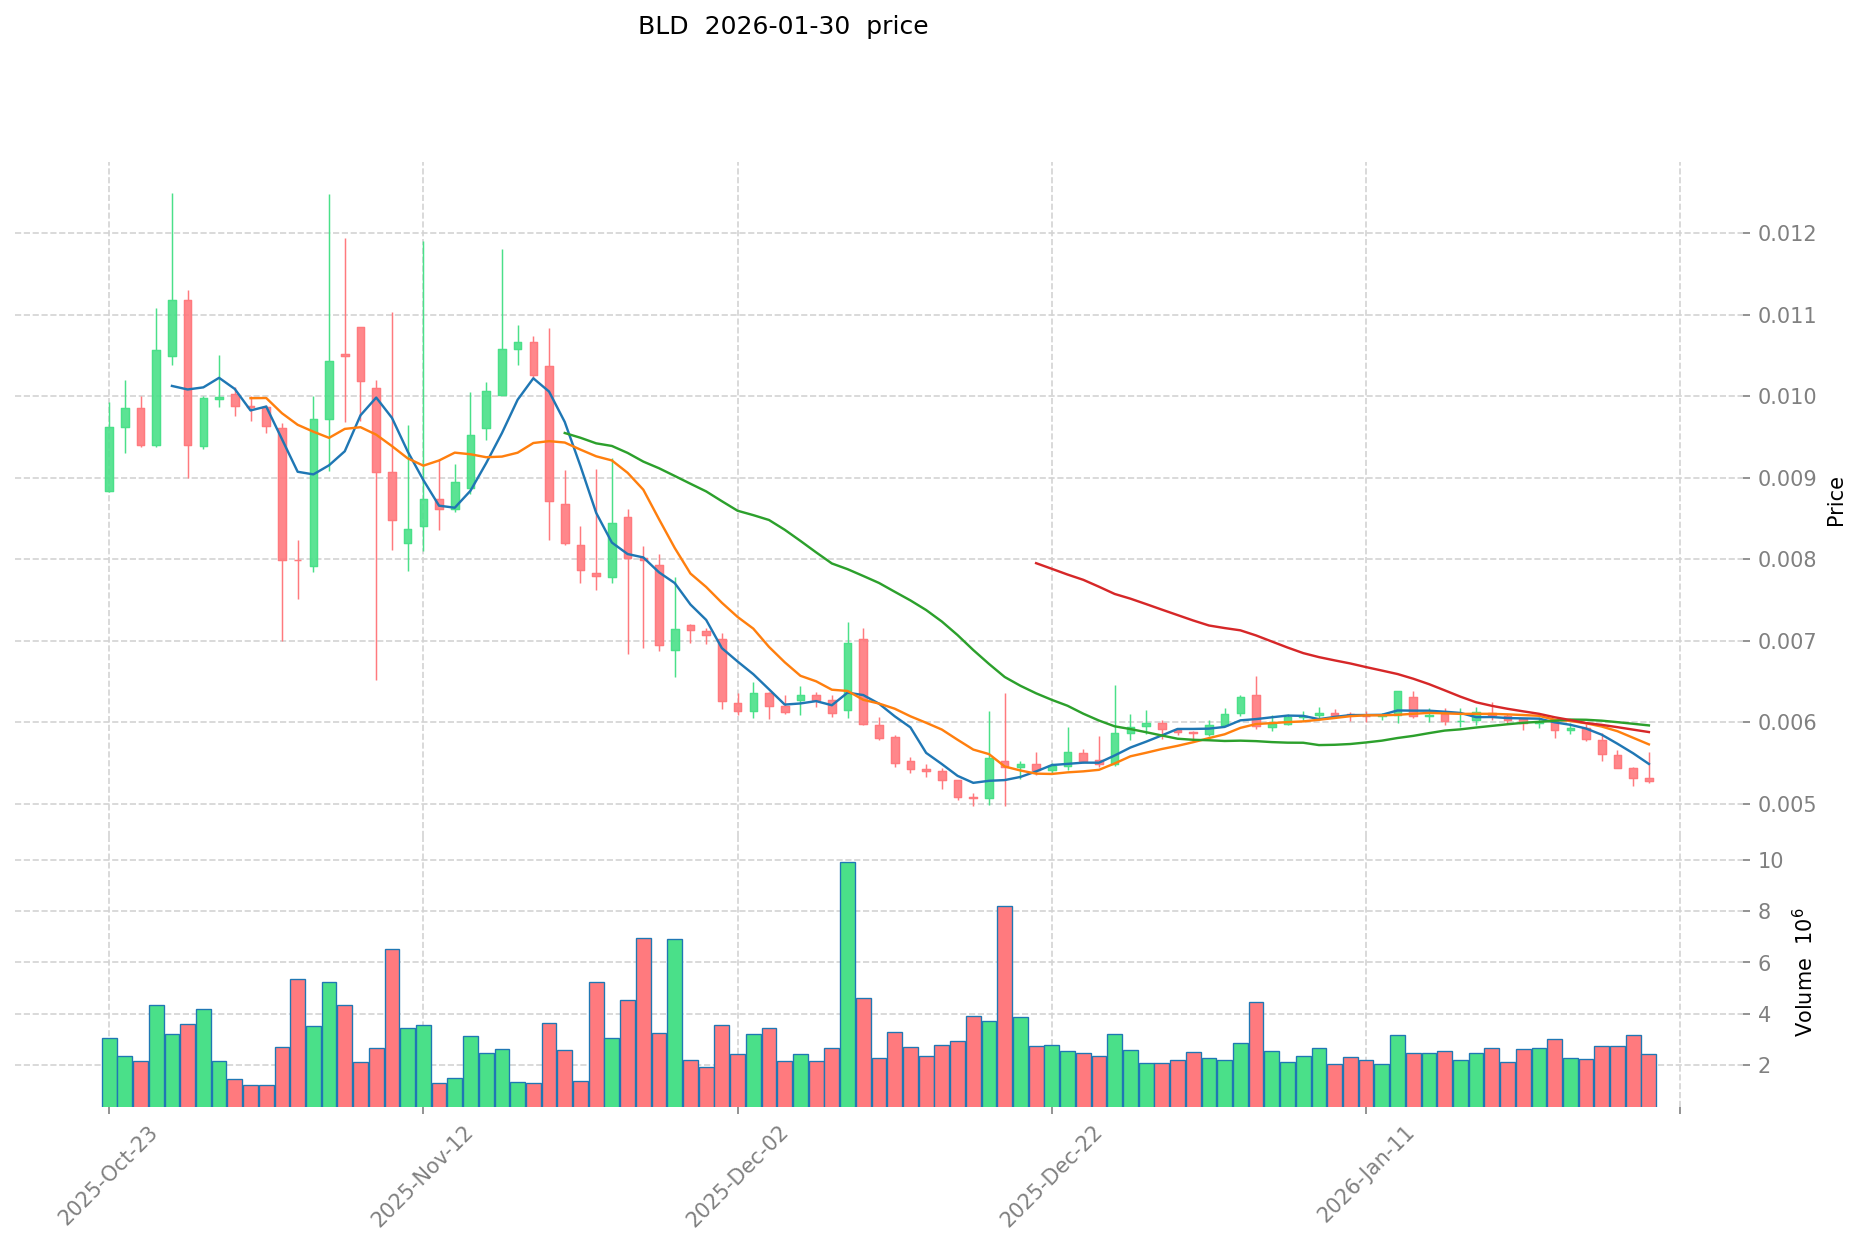
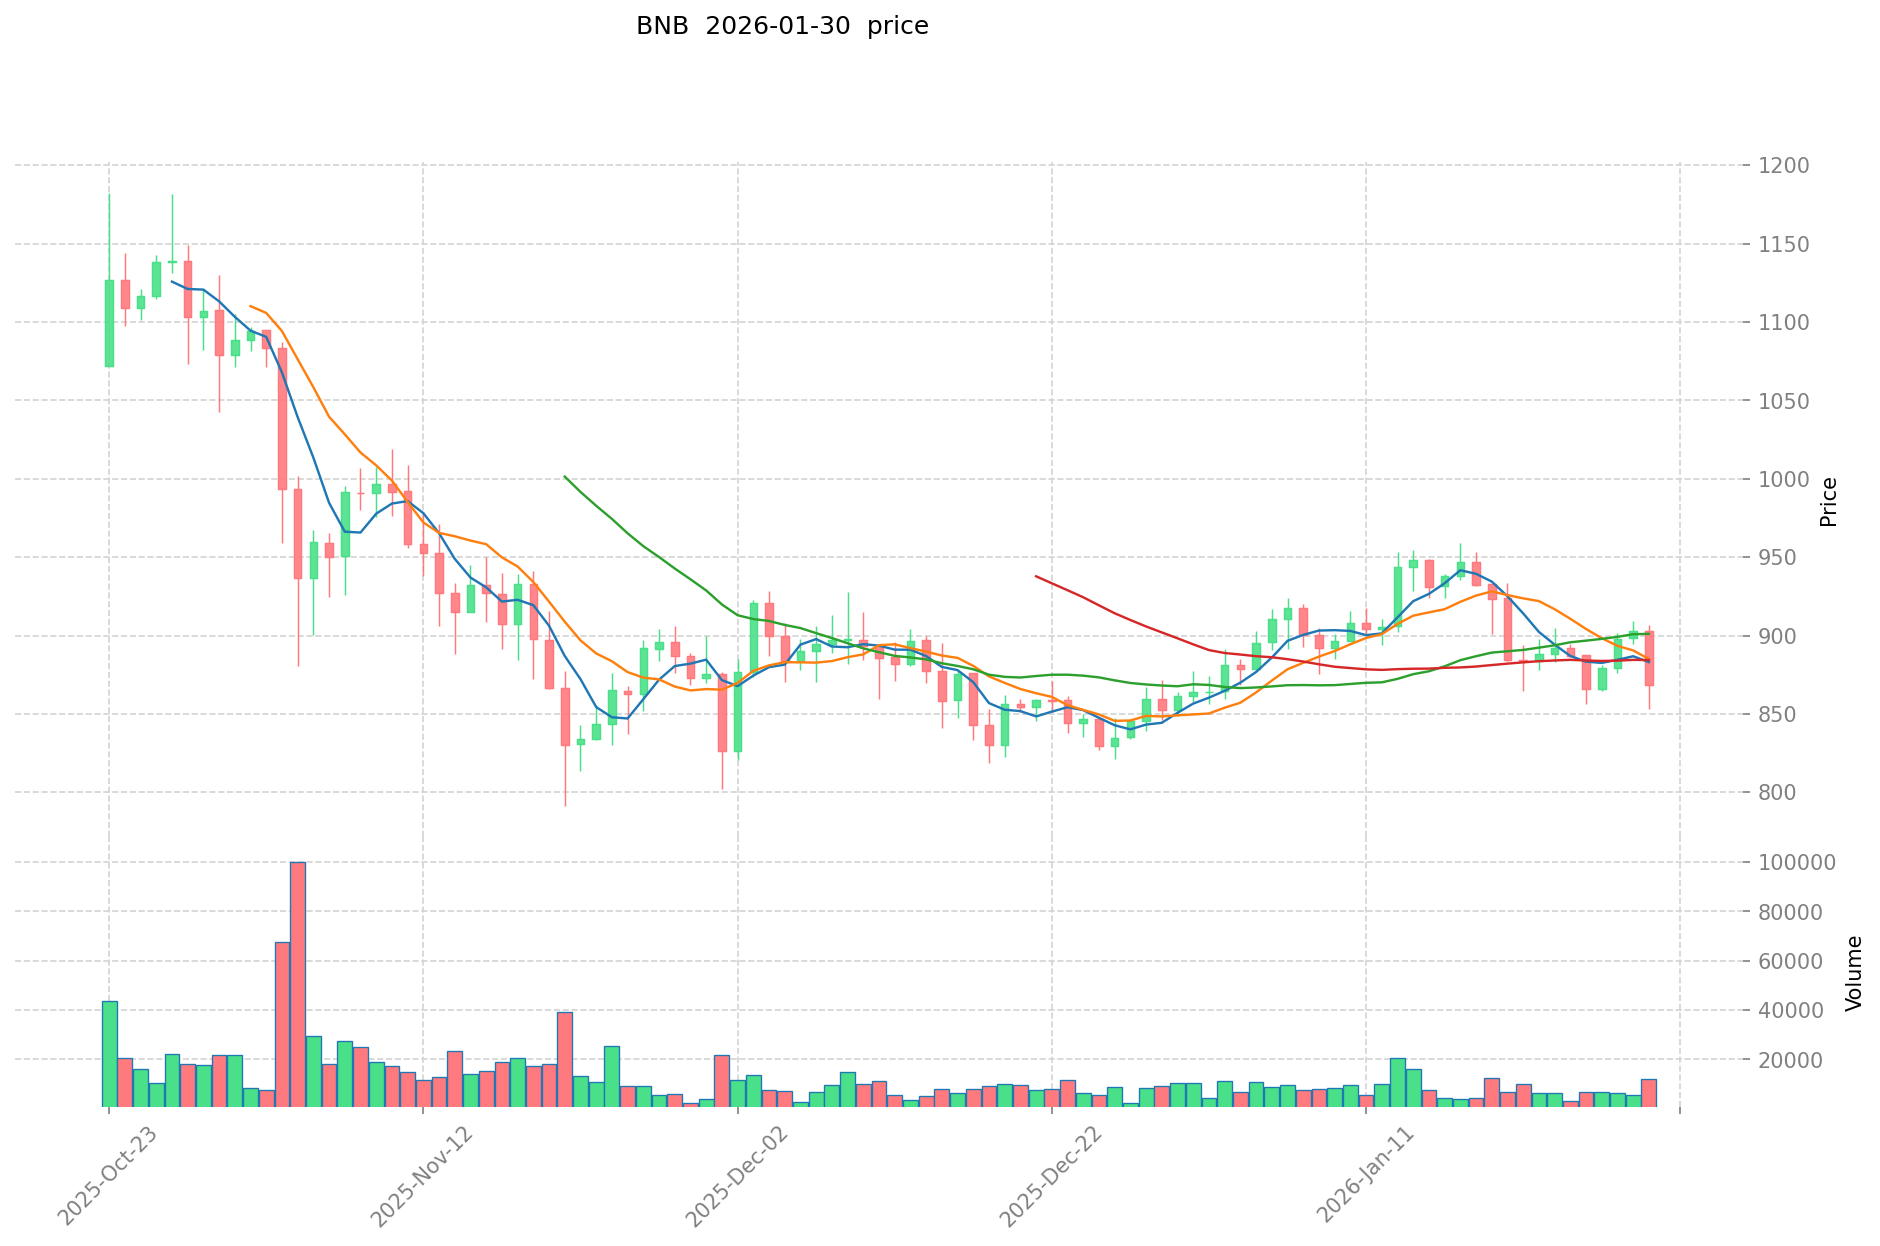
Current Market Status (2026-01-30)
- BLD Current Price: $0.005269
- BNB Current Price: $848.4
- 24-Hour Trading Volume: BLD $13,037.54 vs BNB $13,442,832.68
- Market Capitalization: BLD $3.64 million vs BNB $115.69 billion
- Market Sentiment Index (Fear & Greed Index): 16 (Extreme Fear)
View real-time prices:
- Check BLD current price Market Price
- Check BNB current price Market Price
II. Core Factors Influencing BLD vs BNB Investment Value
Supply Mechanism Comparison (Tokenomics)
- BNB: Features a limited supply model with a pre-mined total of 200 million tokens, with no additional tokens to be generated. This fixed supply represents a key factor in BNB's value proposition.
- BLD: Reference materials do not provide specific information regarding BLD's supply mechanism or tokenomics structure.
- 📌 Historical Pattern: Limited supply mechanisms have historically contributed to price appreciation during periods of increased demand, though actual market performance depends on multiple variables.
Institutional Adoption and Market Application
- Institutional Holdings: BNB benefits from its integration within the Binance ecosystem, which may attract institutional interest through its utility functions.
- Enterprise Adoption: BNB serves multiple functions within the Binance platform, including transaction fee discounts and ecosystem participation. Information regarding BLD's enterprise adoption is not available in the provided materials.
- Regulatory Environment: Different jurisdictions maintain varying regulatory approaches toward digital assets, which can influence accessibility and institutional participation.
Technological Development and Ecosystem Building
- BNB Technology: BNB operates within the Binance ecosystem, supporting various blockchain-based services and applications.
- BLD Technology: Reference materials do not contain information regarding BLD's technological framework or development roadmap.
- Ecosystem Comparison: BNB demonstrates integration across multiple use cases within its native ecosystem. Comparative data for BLD regarding DeFi, NFT, payment systems, or smart contract implementation is not available.
Macroeconomic Environment and Market Cycles
- Inflation Environment Performance: Digital assets may demonstrate varying responses to inflationary conditions based on their utility, adoption, and market positioning.
- Macroeconomic Monetary Policy: Interest rate adjustments and currency strength fluctuations can influence digital asset valuations through changes in risk appetite and capital flows.
- Geopolitical Factors: Cross-border transaction requirements and international developments may affect demand for digital assets with payment or settlement utilities.
III. 2026-2031 Price Forecast: BLD vs BNB
Short-term Forecast (2026)
- BLD: Conservative $0.00495 - $0.00527 | Optimistic $0.00527 - $0.00706
- BNB: Conservative $490 - $846 | Optimistic $846 - $1,184
Mid-term Forecast (2028-2029)
- BLD may enter a consolidation phase, with projected prices ranging from $0.00435 to $0.00841
- BNB may enter an expansion phase, with projected prices ranging from $760 to $1,781
- Key drivers: institutional capital flows, ETF developments, ecosystem growth
Long-term Forecast (2030-2031)
- BLD: Baseline scenario $0.00424 - $0.00786 | Optimistic scenario $0.00786 - $0.01100
- BNB: Baseline scenario $1,170 - $1,763 | Optimistic scenario $1,763 - $2,521
View detailed price predictions for BLD and BNB
Disclaimer
BLD:
| Year |
Predicted High Price |
Predicted Average Price |
Predicted Low Price |
Price Change |
| 2026 |
0.00706046 |
0.005269 |
0.00495286 |
0 |
| 2027 |
0.0075209706 |
0.00616473 |
0.0056715516 |
17 |
| 2028 |
0.008416705869 |
0.0068428503 |
0.005953279761 |
29 |
| 2029 |
0.007858671427035 |
0.0076297780845 |
0.004348973508165 |
44 |
| 2030 |
0.00797655149844 |
0.007744224755767 |
0.004336765863229 |
46 |
| 2031 |
0.011004543377945 |
0.007860388127104 |
0.004244609588636 |
49 |
BNB:
| Year |
Predicted High Price |
Predicted Average Price |
Predicted Low Price |
Price Change |
| 2026 |
1183.7 |
845.5 |
490.39 |
0 |
| 2027 |
1359.564 |
1014.6 |
740.658 |
19 |
| 2028 |
1661.9148 |
1187.082 |
759.73248 |
40 |
| 2029 |
1780.623 |
1424.4984 |
826.209072 |
68 |
| 2030 |
1923.07284 |
1602.5607 |
1169.869311 |
89 |
| 2031 |
2520.8279811 |
1762.81677 |
1427.8815837 |
108 |
IV. Investment Strategy Comparison: BLD vs BNB
Long-term vs Short-term Investment Strategies
- BLD: May attract investors interested in early-stage blockchain platforms with JavaScript-based development environments, though limited market data suggests higher risk profiles
- BNB: May appeal to investors seeking exposure to established exchange ecosystems with demonstrated utility across multiple blockchain services
Risk Management and Asset Allocation
- Conservative Investors: BLD 5-10% vs BNB 20-30% (within overall digital asset allocation)
- Aggressive Investors: BLD 15-20% vs BNB 40-50% (within overall digital asset allocation)
- Hedging Tools: stablecoin allocations, options strategies, cross-asset diversification
V. Potential Risk Comparison
Market Risk
- BLD: Limited liquidity with 24-hour trading volume of $13,037.54 may result in increased price volatility; market capitalization of $3.64 million suggests concentration risk
- BNB: Despite larger market capitalization of $115.69 billion, remains subject to broader cryptocurrency market cycles and platform-specific developments
Technical Risk
- BLD: Information regarding scalability, network stability, and technical infrastructure is not available in reference materials
- BNB: Operational dependencies on ecosystem performance and platform security measures require ongoing monitoring
Regulatory Risk
- Evolving regulatory frameworks across jurisdictions may impact both assets differently based on their utility functions, with exchange-related tokens potentially facing distinct compliance requirements compared to platform-specific tokens
VI. Conclusion: Which Is the Better Buy?
📌 Investment Value Summary:
- BLD Characteristics: Early-stage platform positioning with JavaScript development focus; limited current market presence with $3.64 million market capitalization
- BNB Characteristics: Established ecosystem integration with $115.69 billion market capitalization; demonstrated utility within exchange operations; limited supply mechanism
✅ Investment Considerations:
- Beginning Investors: May consider BNB for its established market presence and ecosystem integration, while carefully evaluating risk tolerance
- Experienced Investors: May assess both assets based on individual portfolio strategies, risk parameters, and investment timeframes
- Institutional Investors: May evaluate ecosystem fundamentals, liquidity metrics, and regulatory compliance frameworks when considering allocation decisions
⚠️ Risk Disclosure: Cryptocurrency markets demonstrate significant volatility. This content does not constitute investment advice. Independent research and professional consultation are recommended before making investment decisions.
VII. FAQ
Q1: What are the main differences between BLD and BNB in terms of market positioning?
BLD is an early-stage smart contract platform focused on JavaScript development with a market cap of $3.64 million, while BNB is an established exchange ecosystem token with a market cap of $115.69 billion. BLD (Agoric) positions itself as a general-purpose smart contract platform designed for building web3 applications using JavaScript, featuring native interoperability with Cosmos and other Layer 1 blockchains through IBC. In contrast, BNB serves as the fuel for the Binance ecosystem with utilities including transaction fee discounts and payment functions, maintaining a position among the top cryptocurrencies globally since its launch in July 2017.
Q2: How do the price performances of BLD and BNB compare over recent market cycles?
BLD experienced a significant decline of approximately 98.6% from its all-time high of $0.29342 (January 2024) to its all-time low of $0.004011 (September 2025), while BNB demonstrated resilience with approximately 26.77% growth over the past year. During the 2024-2025 market cycle, BLD faced substantial downward pressure, reflecting challenges in maintaining early market enthusiasm. Meanwhile, BNB showed relative stability, growing from its all-time low of $0.0398177 (October 2017) to its all-time high of $1,369.99 (October 2025), demonstrating the strength of the Binance ecosystem expansion despite short-term volatility.
Q3: What are the projected price ranges for BLD and BNB through 2031?
For short-term (2026), BLD is projected at $0.00495-$0.00706 while BNB is projected at $490-$1,184; for long-term (2030-2031), BLD baseline scenario ranges from $0.00424-$0.01100 while BNB ranges from $1,170-$2,521. The mid-term forecast (2028-2029) suggests BLD may enter a consolidation phase with prices ranging from $0.00435 to $0.00841, while BNB may enter an expansion phase with prices ranging from $760 to $1,781. Key drivers for these projections include institutional capital flows, ETF developments, and ecosystem growth, though actual performance depends on multiple market variables.
Q4: How do the liquidity profiles of BLD and BNB differ for investors?
BLD shows significantly lower liquidity with a 24-hour trading volume of $13,037.54 compared to BNB's $13,442,832.68, representing approximately 1,000 times less trading activity. This substantial liquidity difference suggests that BLD may experience increased price volatility and potential challenges in executing large orders without significant price impact. The limited liquidity combined with BLD's small market capitalization of $3.64 million indicates concentration risk, while BNB's larger market capitalization of $115.69 billion and higher trading volume provide greater market depth for investors seeking to enter or exit positions.
Q5: What supply mechanisms distinguish BLD from BNB?
BNB features a clearly defined limited supply model with a pre-mined total of 200 million tokens and no additional token generation, while specific information regarding BLD's supply mechanism is not available in current reference materials. The fixed supply mechanism of BNB represents a key factor in its value proposition, as limited supply historically contributes to price appreciation during periods of increased demand. This deflationary characteristic differs from tokens with inflationary supply models, though actual market performance depends on multiple variables including adoption rates, utility expansion, and overall market conditions.
Q6: Which asset better suits different investor profiles?
Conservative investors might consider allocating 5-10% to BLD versus 20-30% to BNB (within overall digital asset allocation), while aggressive investors might allocate 15-20% to BLD versus 40-50% to BNB. Beginning investors may consider BNB for its established market presence and ecosystem integration, while carefully evaluating risk tolerance. Experienced investors may assess both assets based on individual portfolio strategies, risk parameters, and investment timeframes. Institutional investors may evaluate ecosystem fundamentals, liquidity metrics, and regulatory compliance frameworks when considering allocation decisions, with particular attention to the operational dependencies and platform-specific developments of each asset.
Q7: What are the primary risks associated with investing in BLD versus BNB?
BLD faces market risk from limited liquidity and small market capitalization, potentially resulting in increased price volatility and concentration risk, while BNB, despite its larger market cap, remains subject to broader cryptocurrency market cycles and platform-specific developments. Both assets face regulatory risk from evolving frameworks across jurisdictions, though exchange-related tokens like BNB may face distinct compliance requirements compared to platform-specific tokens. Technical risks for BLD include uncertainties regarding scalability and network stability (information not available in reference materials), while BNB has operational dependencies on ecosystem performance and platform security measures requiring ongoing monitoring.
Q8: How does the current market sentiment affect BLD and BNB investment considerations?
The current market sentiment index stands at 16 (Extreme Fear), indicating a risk-averse market environment that may impact both assets differently based on their market positioning and liquidity profiles. In extreme fear conditions, assets with lower liquidity like BLD (trading volume $13,037.54) may experience more pronounced price movements compared to more liquid assets like BNB (trading volume $13,442,832.68). This market sentiment, combined with BLD's current price of $0.005269 and BNB's current price of $848.4, suggests investors should carefully evaluate their risk tolerance and investment timeframes, as extreme fear conditions historically present both opportunities and risks depending on subsequent market developments and individual asset fundamentals.
* The information is not intended to be and does not constitute financial advice or any other recommendation of any sort offered or endorsed by Gate.