This comprehensive guide compares BOSON and QNT, two distinct blockchain solutions serving different market segments. BOSON operates as a decentralized commerce infrastructure layer with a $3.43M market cap, while QNT provides enterprise blockchain interoperability with a $1.03B valuation. The article analyzes critical factors including historical price performance (BOSON down 97% from launch, QNT down 83% from peak), liquidity disparities ($20K vs $665K trading volumes), and technological positioning. Readers gain insight into tokenomics, institutional adoption patterns, and ecosystem development trajectories across both platforms. The guide presents 2026-2031 price forecasts, risk assessments, and tailored investment strategies for beginner, experienced, and institutional investors, helping determine whether BOSON's higher-risk emerging commerce positioning or QNT's established enterprise solutions better align with individual investment objectives and risk tolerance.
Introduction: Investment Comparison Between BOSON and QNT
In the cryptocurrency market, the comparison between BOSON vs QNT has been a topic that investors cannot avoid. The two not only show significant differences in market cap ranking, application scenarios, and price performance, but also represent different crypto asset positioning.
BOSON (BOSON): Since its launch in 2021, it has gained market recognition through its positioning as "the decentralized commerce layer of the agentic economy."
QNT (QNT): Since its inception in 2018, it has been recognized as a "blockchain interoperability solution provider" and is one of the cryptocurrencies with considerable trading volume and market capitalization globally.
This article will comprehensively analyze the investment value comparison of BOSON vs QNT around historical price trends, supply mechanisms, institutional adoption, technological ecosystems, and future predictions, and attempt to answer the question that investors are most concerned about:
"Which is the better buy right now?"
I. Historical Price Comparison and Current Market Status
BOSON (Coin A) and QNT (Coin B) Historical Price Trends
-
2021: BOSON experienced significant price activity following its launch in April 2021, with an initial offering price of $0.75. QNT reached a notable price level of $427.42 in September 2021, reflecting strong market interest during the broader crypto market rally.
-
2018-2021: QNT demonstrated substantial growth from its historical low of $0.215773 in August 2018 to its peak in 2021, showing considerable appreciation over this period. BOSON launched later in this cycle at $0.75.
-
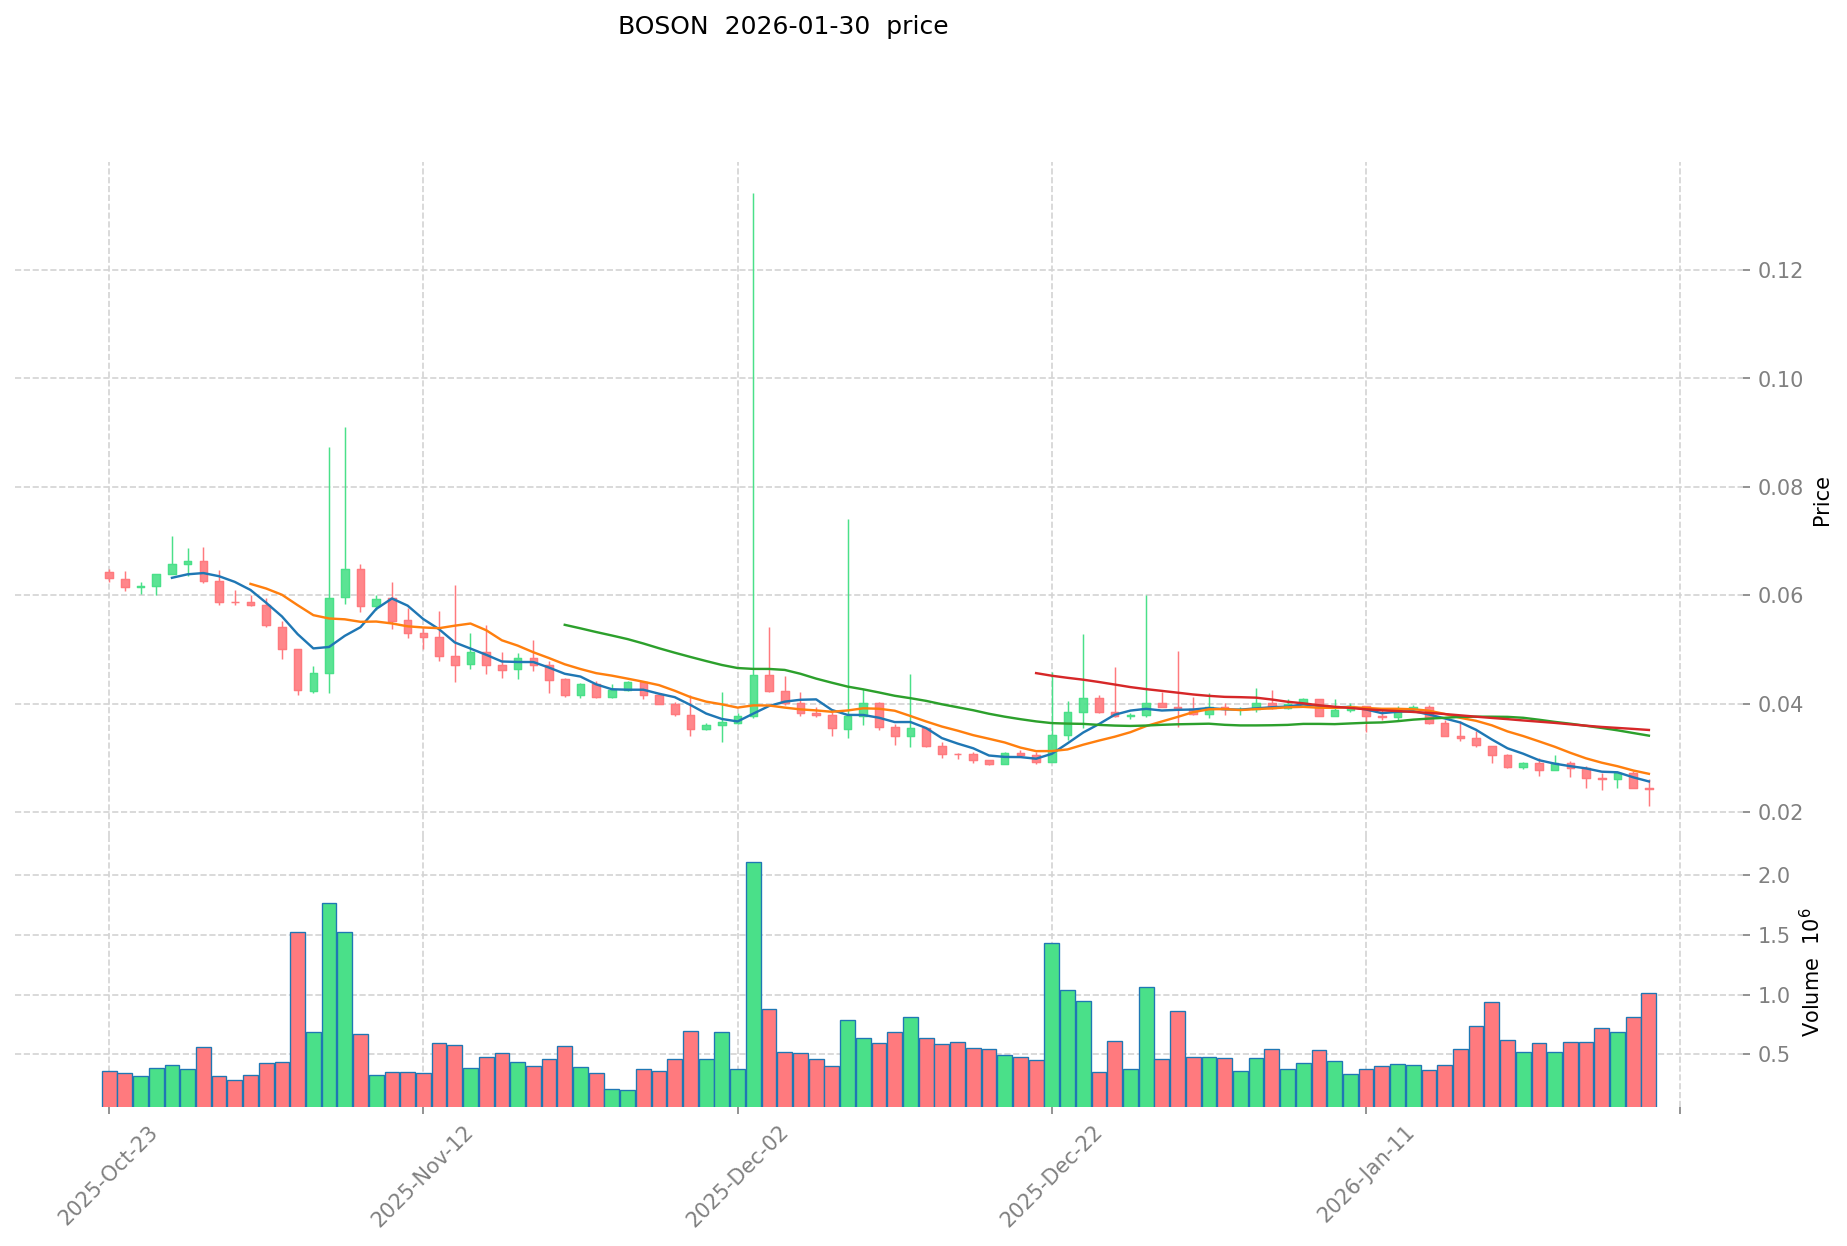
2026: As of January 2026, both assets have experienced substantial declines from their previous peaks. BOSON recorded a historical low of $0.02213851 on January 29, 2026, representing a significant decrease from its launch price. QNT has declined to levels substantially below its 2021 peak.
-
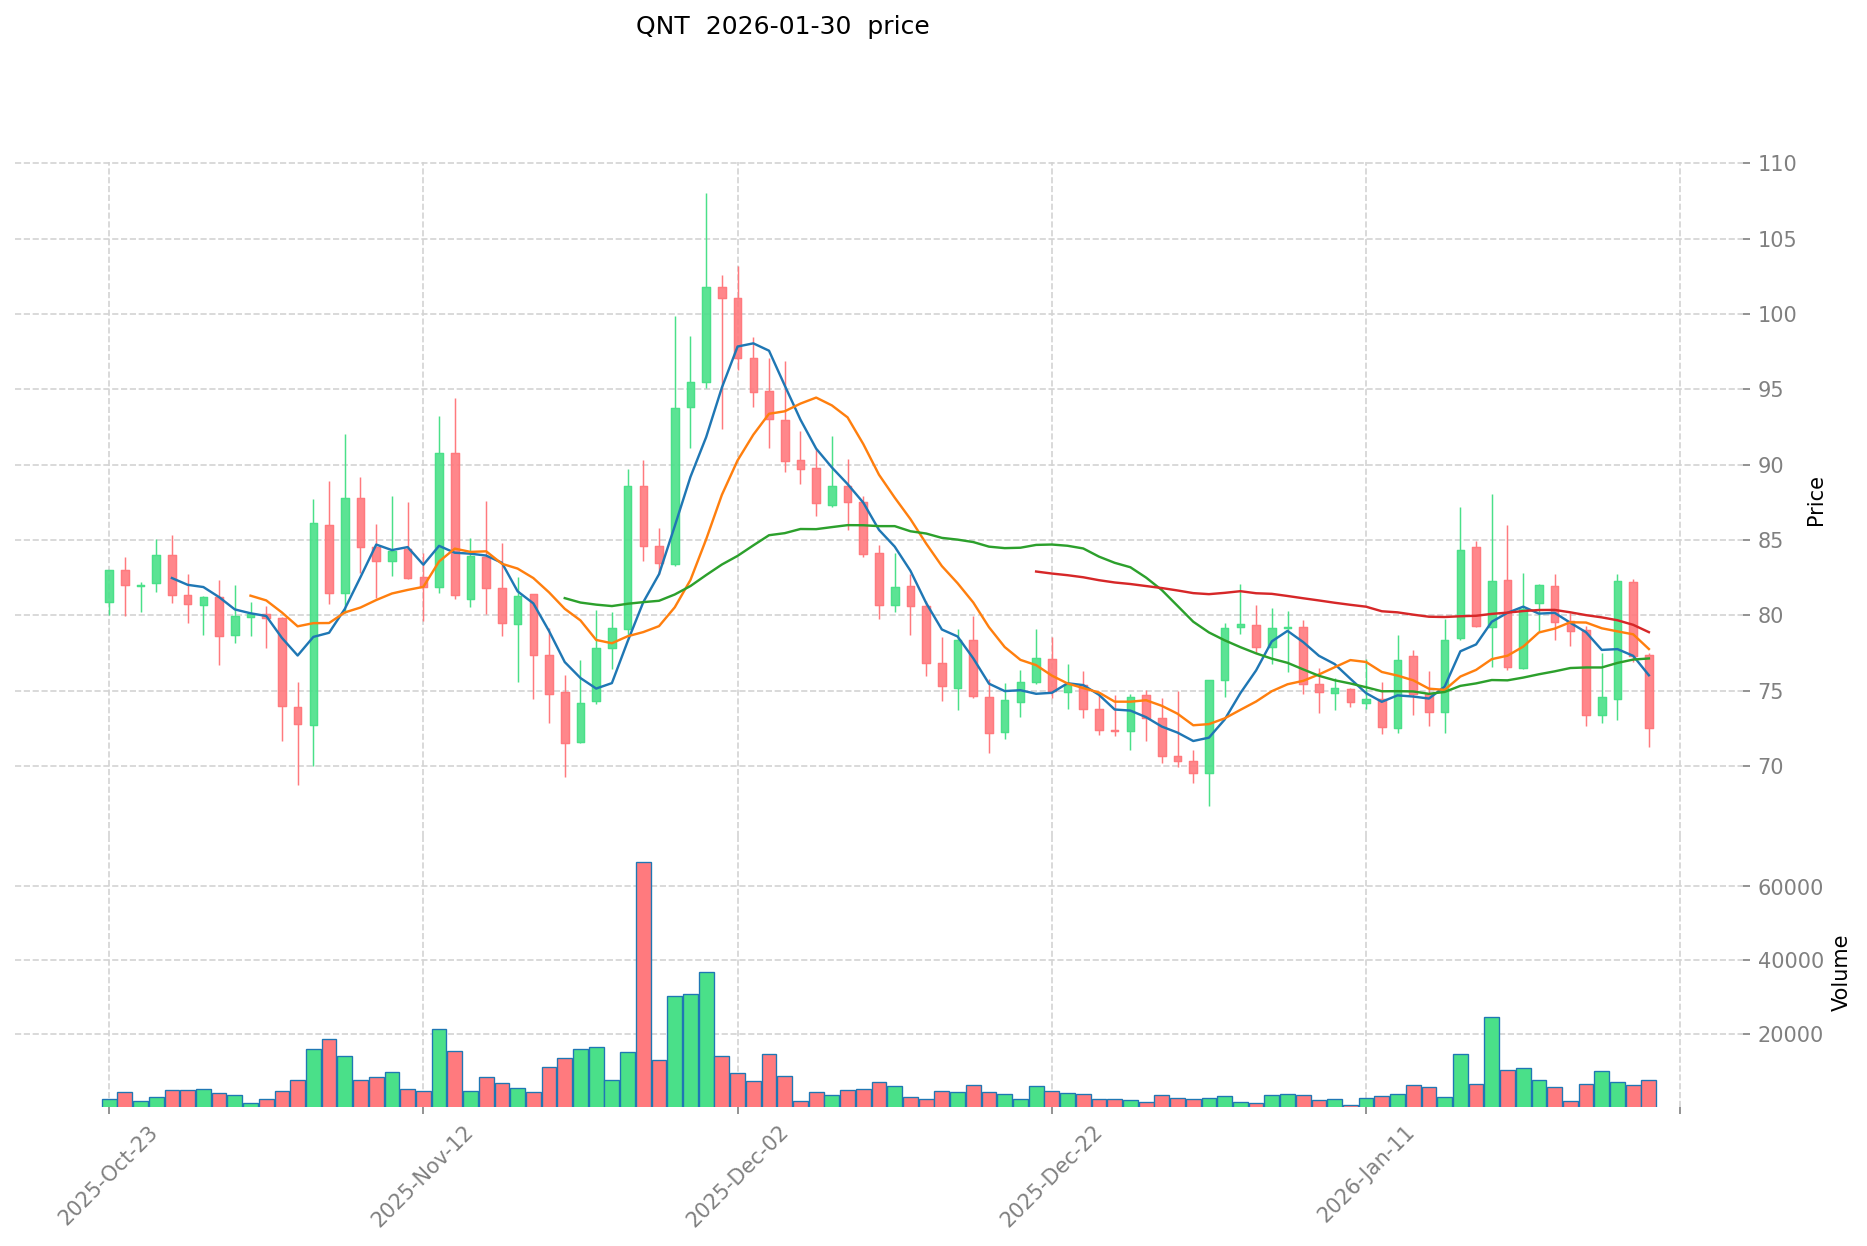
Comparative Analysis: During the recent market cycle, BOSON has declined from its launch price of $0.75 to its current levels around $0.02372, while QNT has decreased from its peak of $427.42 to approximately $71.04, showing different magnitude of corrections relative to their respective historical ranges.
Current Market Status (2026-01-30)
- BOSON Current Price: $0.02372
- QNT Current Price: $71.04
- 24-Hour Trading Volume: BOSON $20,342.31 vs QNT $665,713.51
- 24-Hour Price Change: BOSON -3.18% vs QNT -5.71%
- 7-Day Performance: BOSON -20.36% vs QNT -10.67%
- Market Capitalization: BOSON $3.43M vs QNT $1.03B
- Market Sentiment Index (Fear & Greed Index): 16 (Extreme Fear)
View real-time prices:
- Check BOSON current price Market Price
- Check QNT current price Market Price
II. Core Factors Influencing BOSON vs QNT Investment Value
Supply Mechanism Comparison (Tokenomics)
- BOSON: The supply mechanism and scarcity characteristics play a role in shaping its market dynamics, though specific tokenomics details require further verification from official sources.
- QNT: Supply structure and distribution models influence its long-term value proposition within the enterprise blockchain sector.
- 📌 Historical Pattern: Supply mechanisms have historically demonstrated their capacity to influence price cycles through scarcity dynamics and emission schedules.
Institutional Adoption and Market Application
- Institutional Holdings: Both assets exhibit varying degrees of institutional interest, with adoption patterns reflecting their respective use cases and market positioning.
- Enterprise Adoption: BOSON focuses on decentralized commerce applications, while QNT targets enterprise interoperability solutions, representing distinct market segments with different adoption trajectories.
- Regulatory Landscape: Jurisdictional approaches to both tokens vary, with evolving frameworks affecting their accessibility and compliance requirements across different markets.
Technology Development and Ecosystem Building
- BOSON Technology Advancement: The project's focus on technology and ecosystem development within decentralized commerce infrastructure continues to evolve, with potential implications for marketplace adoption.
- QNT Technology Development: Quant Network's interoperability solutions target enterprise-grade blockchain connectivity, with ongoing development aimed at cross-ledger functionality.
- Ecosystem Comparison: BOSON concentrates on commerce and NFT-related applications, while QNT emphasizes enterprise integration, payment systems, and cross-chain smart contract capabilities, representing different developmental trajectories.
Macroeconomic Environment and Market Cycles
- Performance in Inflationary Environments: Both assets demonstrate sensitivity to broader macroeconomic conditions, though their correlation with traditional inflation hedges varies based on market sentiment and adoption metrics.
- Macroeconomic Monetary Policy: Interest rate adjustments, dollar index movements, and central bank policies affect liquidity conditions and risk appetite across the crypto asset class, influencing both BOSON and QNT valuations.
- Geopolitical Factors: Cross-border transaction demand and international developments create varying impacts on adoption potential, particularly for assets targeting enterprise and commerce applications.
III. 2026-2031 Price Forecast: BOSON vs QNT
Short-term Forecast (2026)
- BOSON: Conservative $0.0126 - $0.0238 | Optimistic $0.0238 - $0.0278
- QNT: Conservative $50.45 - $71.05 | Optimistic $71.05 - $78.87
Mid-term Forecast (2028-2029)
- BOSON may enter a gradual growth phase, with estimated price range of $0.0265 - $0.0442 in 2028 and $0.0357 - $0.0520 in 2029
- QNT may enter a consolidation and expansion phase, with estimated price range of $55.36 - $83.83 in 2028 and $43.17 - $117.29 in 2029
- Key drivers: institutional capital inflows, ETF developments, ecosystem expansion
Long-term Forecast (2030-2031)
- BOSON: Base scenario $0.0319 - $0.0449 (2030), $0.0311 - $0.0546 (2031) | Optimistic scenario $0.0449 - $0.0643 (2030), $0.0546 - $0.0606 (2031)
- QNT: Base scenario $70.55 - $99.37 (2030), $68.30 - $115.77 (2031) | Optimistic scenario $99.37 - $132.17 (2030), $115.77 - $129.66 (2031)
View detailed price predictions for BOSON and QNT
Disclaimer
BOSON:
| Year |
Predicted High Price |
Predicted Average Price |
Predicted Low Price |
Price Change |
| 2026 |
0.0278226 |
0.02378 |
0.0126034 |
3 |
| 2027 |
0.037411885 |
0.0258013 |
0.019350975 |
12 |
| 2028 |
0.0442492295 |
0.0316065925 |
0.0265495377 |
37 |
| 2029 |
0.05196123807 |
0.037927911 |
0.03565223634 |
65 |
| 2030 |
0.06427074158505 |
0.044944574535 |
0.03191064791985 |
96 |
| 2031 |
0.060614500446627 |
0.054607658060025 |
0.031126365094214 |
138 |
QNT:
| Year |
Predicted High Price |
Predicted Average Price |
Predicted Low Price |
Price Change |
| 2026 |
78.8655 |
71.05 |
50.4455 |
0 |
| 2027 |
83.2031025 |
74.95775 |
42.7259175 |
5 |
| 2028 |
83.825251825 |
79.08042625 |
55.356298375 |
11 |
| 2029 |
117.292088214 |
81.4528390375 |
43.170004689875 |
14 |
| 2030 |
132.1653766222475 |
99.37246362575 |
70.5544491742825 |
39 |
| 2031 |
129.6611905388786 |
115.76892012399875 |
68.303662873159262 |
62 |
IV. Investment Strategy Comparison: BOSON vs QNT
Long-term vs Short-term Investment Strategies
- BOSON: May be suitable for investors focusing on emerging decentralized commerce infrastructure and early-stage ecosystem development, with tolerance for higher volatility and longer development timelines
- QNT: May appeal to investors seeking exposure to enterprise blockchain interoperability solutions with established market presence and institutional-grade infrastructure
Risk Management and Asset Allocation
- Conservative Investors: BOSON 10-15% vs QNT 20-30% (within crypto allocation)
- Aggressive Investors: BOSON 25-35% vs QNT 30-40% (within crypto allocation)
- Hedging Tools: stablecoin reserves, diversification across multiple blockchain ecosystems, position sizing based on risk tolerance
V. Potential Risk Comparison
Market Risk
- BOSON: Higher volatility characteristics with 24-hour change of -3.18% and 7-day performance of -20.36%, lower liquidity with trading volume of $20,342.31, increased sensitivity to broader market sentiment shifts
- QNT: Moderate volatility with 24-hour change of -5.71% and 7-day performance of -10.67%, higher liquidity with trading volume of $665,713.51, exposure to enterprise adoption cycles and institutional demand fluctuations
Technical Risk
- BOSON: Development stage considerations for decentralized commerce infrastructure, ecosystem maturity timeline, network effect dependencies
- QNT: Enterprise integration complexity, cross-chain interoperability challenges, competitive landscape evolution in blockchain connectivity solutions
Regulatory Risk
- Global regulatory frameworks present varying implications for both assets, with BOSON facing considerations related to decentralized commerce applications and QNT navigating enterprise blockchain compliance requirements across multiple jurisdictions
VI. Conclusion: Which Is the Better Buy?
📌 Investment Value Summary:
- BOSON Characteristics: Focus on decentralized commerce infrastructure, early-stage ecosystem positioning, higher risk-reward profile with lower market capitalization of $3.43M
- QNT Characteristics: Established enterprise interoperability solutions, larger market presence with $1.03B market capitalization, institutional-grade positioning in blockchain connectivity
✅ Investment Considerations:
- Beginning Investors: Consider starting with assets that have established track records, higher liquidity, and clearer use cases before exploring emerging projects; prioritize education and risk management
- Experienced Investors: May evaluate both assets based on portfolio diversification objectives, risk tolerance, and conviction in respective technological approaches and market positioning
- Institutional Investors: Assessment may focus on regulatory clarity, liquidity profiles, enterprise adoption metrics, and alignment with broader blockchain infrastructure strategies
⚠️ Risk Disclosure: Cryptocurrency markets exhibit substantial volatility. This content does not constitute investment advice. Investors should conduct independent research and consult financial professionals before making investment decisions.
VII. FAQ
Q1: What are the main differences between BOSON and QNT in terms of market positioning?
BOSON focuses on decentralized commerce infrastructure with a market cap of $3.43M, while QNT specializes in enterprise blockchain interoperability solutions with a substantially larger market cap of $1.03B. BOSON positions itself as "the decentralized commerce layer of the agentic economy" and targets NFT-related applications and marketplace adoption. QNT, on the other hand, serves as a "blockchain interoperability solution provider" targeting enterprise-grade blockchain connectivity, payment systems, and cross-chain smart contract capabilities. This fundamental difference reflects distinct market segments—BOSON appeals to emerging decentralized commerce use cases, whereas QNT addresses institutional and enterprise integration needs with established market presence.
Q2: How do the historical price performances of BOSON and QNT compare?
Both assets have experienced significant declines from their respective peaks, but with different magnitudes. BOSON launched in April 2021 at $0.75 and reached a historical low of $0.02213851 on January 29, 2026, representing approximately a 97% decline from its launch price to current levels around $0.02372. QNT achieved its peak at $427.42 in September 2021 and has since declined to approximately $71.04, representing roughly an 83% decrease from its all-time high. QNT's historical range extends back to August 2018 when it traded at $0.215773, showing substantial appreciation before the 2021 peak. The different decline magnitudes reflect their respective market maturity stages and investor base characteristics.
Q3: What is the current liquidity situation for BOSON versus QNT?
QNT demonstrates significantly higher liquidity compared to BOSON. As of January 30, 2026, QNT's 24-hour trading volume stands at $665,713.51, while BOSON's volume is $20,342.31—approximately 33 times lower. This liquidity disparity has important implications for investors: higher liquidity in QNT allows for larger position entries and exits with reduced slippage and price impact, making it more accessible to institutional investors and traders. BOSON's lower liquidity increases transaction costs and volatility sensitivity, potentially presenting challenges for larger capital deployments but also creating opportunities for long-term investors willing to accept illiquidity premiums in early-stage projects.
Q4: What are the price forecasts for BOSON and QNT through 2031?
Price forecasts indicate different growth trajectories for each asset. For BOSON, conservative estimates suggest a range of $0.0126-$0.0238 in 2026, gradually expanding to $0.0311-$0.0546 by 2031, with optimistic scenarios reaching $0.0606. QNT forecasts show a conservative range of $50.45-$71.05 in 2026, expanding to $68.30-$115.77 by 2031, with optimistic scenarios reaching $129.66. These projections reflect assumptions about institutional capital inflows, ETF developments, ecosystem expansion, and broader market adoption. BOSON's forecasts suggest potential percentage gains from current levels may exceed QNT's due to its lower base, though with higher associated risks. Key drivers include technology development milestones, regulatory clarity, macroeconomic conditions, and sector-specific adoption rates.
Q5: How should different investor types approach BOSON versus QNT?
Investment approaches vary significantly by investor profile. Beginning investors should prioritize established assets with higher liquidity and clearer use cases—suggesting QNT may be more appropriate given its $1.03B market cap, institutional positioning, and higher trading volume of $665,713.51. Conservative investors might allocate 10-15% to BOSON and 20-30% to QNT within their crypto portfolios, while aggressive investors could consider 25-35% BOSON and 30-40% QNT allocations. Experienced investors may evaluate both based on portfolio diversification objectives and conviction in respective technological approaches. Institutional investors should assess regulatory clarity, liquidity profiles, and enterprise adoption metrics, factors that currently favor QNT's established market presence over BOSON's emerging infrastructure positioning.
Q6: What are the primary risk factors for investing in BOSON versus QNT?
Both assets face distinct risk profiles. BOSON exhibits higher volatility with a 7-day decline of -20.36% compared to QNT's -10.67%, reflecting its early-stage positioning and lower liquidity. Market risks for BOSON include development stage uncertainties, ecosystem maturity timelines, and network effect dependencies in the decentralized commerce sector. QNT faces risks related to enterprise integration complexity, cross-chain interoperability challenges, and competitive landscape evolution in blockchain connectivity solutions. Regulatory risks affect both assets differently—BOSON navigates decentralized commerce application frameworks, while QNT addresses enterprise blockchain compliance across multiple jurisdictions. Both assets demonstrate sensitivity to macroeconomic conditions, including interest rate adjustments, liquidity shifts, and broader cryptocurrency market sentiment, as evidenced by the current Fear & Greed Index reading of 16 (Extreme Fear).
Q7: What technological advantages differentiate BOSON from QNT?
The technological focus areas represent fundamentally different value propositions. BOSON concentrates on building decentralized commerce infrastructure, enabling NFT-related applications and marketplace functionalities within the emerging agentic economy framework. This technology targets direct consumer and merchant interactions in decentralized environments. QNT's technology emphasizes enterprise-grade blockchain interoperability through Quant Network's solutions, addressing cross-ledger functionality, enterprise integration, payment systems, and cross-chain smart contract capabilities. QNT's technology serves institutional and enterprise clients requiring regulatory compliance, scalability, and integration with existing systems. BOSON's advantage lies in positioning for emerging commerce paradigms, while QNT's strength resides in solving existing enterprise blockchain connectivity challenges with proven infrastructure and established client relationships.
Q8: How do current market conditions (January 2026) affect the investment outlook for BOSON and QNT?
Current market conditions indicate challenging circumstances for both assets. The Fear & Greed Index at 16 (Extreme Fear) reflects broad market pessimism, typically associated with reduced risk appetite and capital outflows from crypto assets. Both BOSON (-3.18% 24h, -20.36% 7d) and QNT (-5.71% 24h, -10.67% 7d) show negative momentum, suggesting continued bearish pressure. However, extreme fear readings historically precede market bottoms and potential accumulation opportunities for long-term investors. The substantial declines from historical peaks—BOSON at approximately 97% below launch price and QNT at roughly 83% below all-time high—may represent potential entry points for investors with multi-year investment horizons. Macroeconomic factors including monetary policy, interest rate trajectories, and institutional adoption trends will significantly influence recovery timelines and upside potential for both assets through the 2026-2031 forecast period.
* The information is not intended to be and does not constitute financial advice or any other recommendation of any sort offered or endorsed by Gate.