This comprehensive analysis compares BROCCOLI and TRX as cryptocurrency investment opportunities, examining two distinctly different blockchain assets. BROCCOLI, launched in 2025 as a fair-launch meme token on BSC network with 46,000 holders, contrasts sharply with TRX, an established blockchain infrastructure platform since 2017 boasting over 219 million holders and a $29.3 billion market cap. The article evaluates historical price trends, tokenomics, technical ecosystems, and institutional adoption while projecting potential price movements through 2031. Current market data shows TRX trading at $0.3096 with significantly stronger liquidity ($5.97M daily volume) compared to BROCCOLI at $0.0203, reflecting different risk-return profiles suitable for various investor types. Detailed investment strategies, risk assessments, and forecasts guide both novice and experienced investors in making informed decisions between established platforms and emerging community projects within the current extreme fear market se
Introduction: Investment Comparison Between BROCCOLI and TRX
In the cryptocurrency market, the comparison between BROCCOLI vs TRX has become a topic of interest for investors. Both assets demonstrate distinct differences in market cap ranking, application scenarios, and price performance, representing different positioning within the crypto asset landscape.
BROCCOLI (BROCCOLI): Launched in 2025 as a fair-launch token, it positions itself as a community-driven meme token named after CZ's Belgian Malinois dog. The project operates on the BSC network with over 46,000 holders.
TRX (TRX): Since its launch in 2017, TRON has established itself as a major blockchain infrastructure platform. With a market cap ranking of 8 and over 219 million holders, it represents one of the significant players in the blockchain ecosystem, particularly after announcing decentralized stablecoin USDD in 2022.
This article will provide a comprehensive analysis of BROCCOLI vs TRX investment value comparison, covering historical price trends, supply mechanisms, institutional adoption, technical ecosystem, and future predictions, attempting to address investors' most pressing question:
"Which is the better buy right now?"
I. Historical Price Comparison and Market Status
BROCCOLI and TRX Historical Price Trends
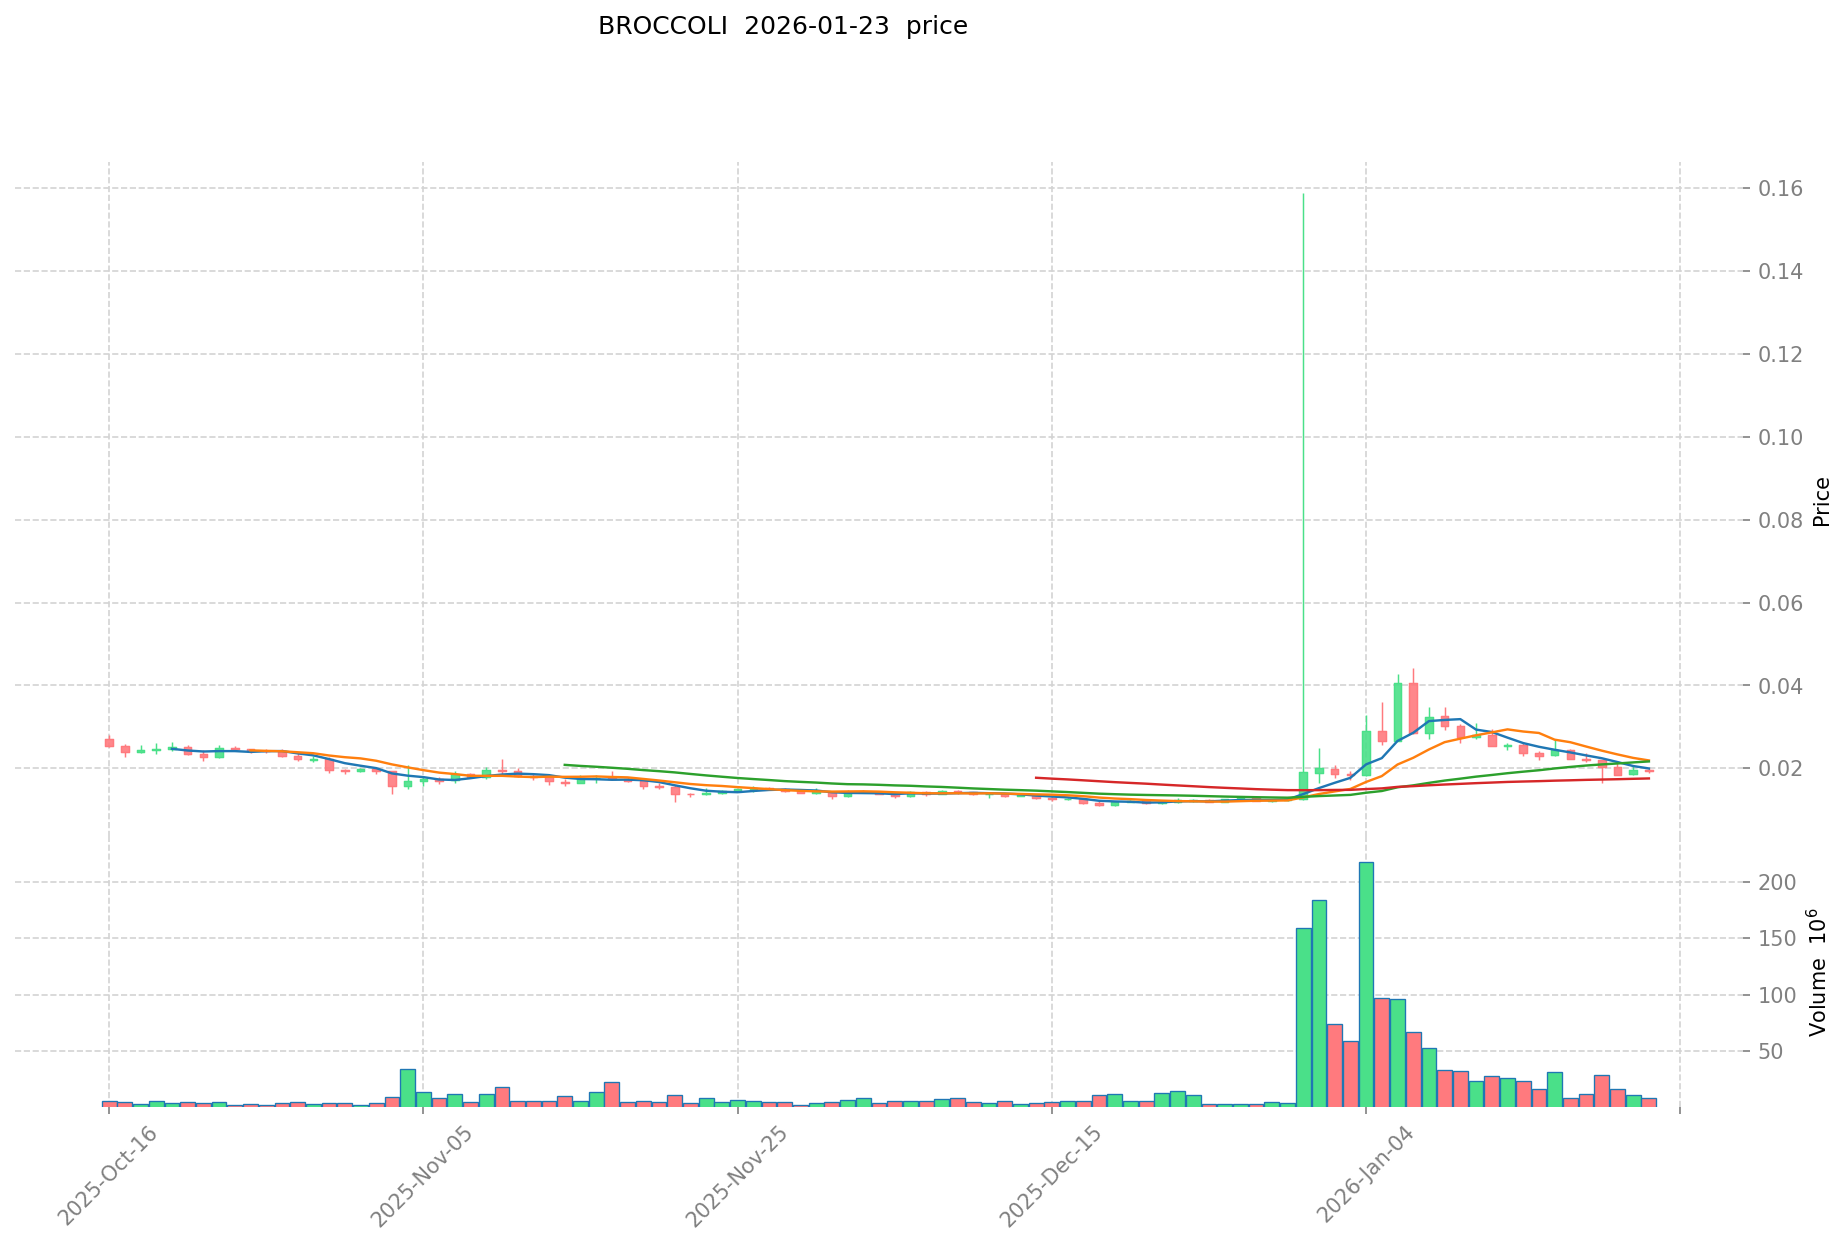
- 2025: BROCCOLI reached its all-time high of $0.28778 on February 14, 2025, following its fair launch in January 2025.
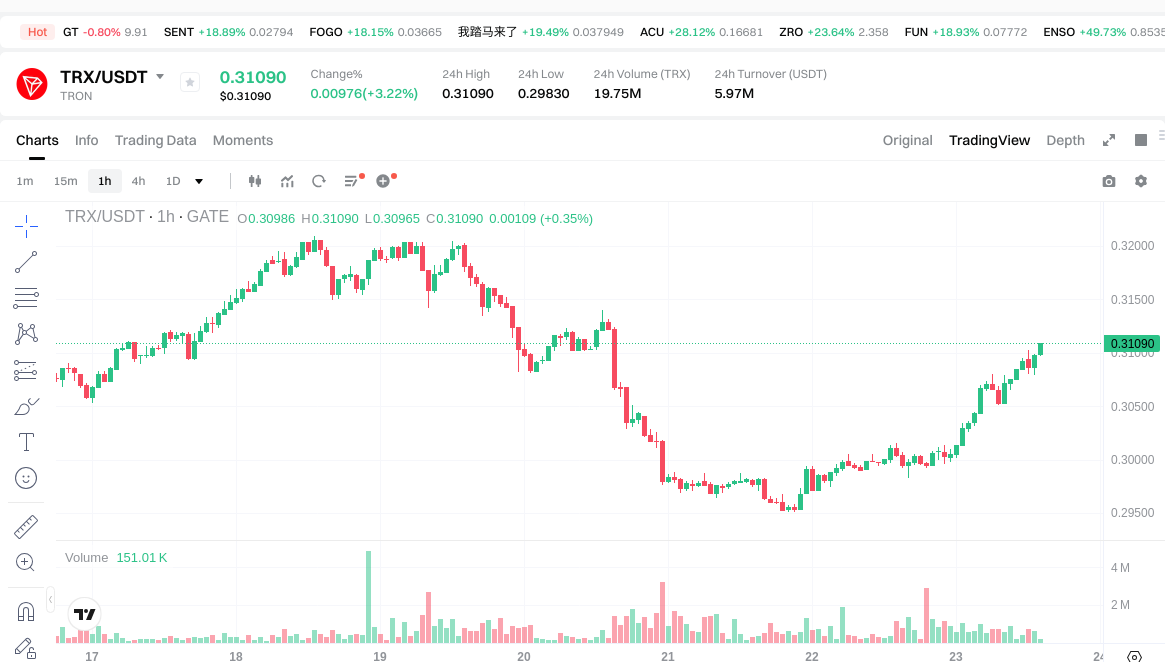
- 2024: TRX achieved its all-time high of $0.431288 on December 4, 2024, driven by market momentum during that period.
- 2017: TRX recorded its all-time low of $0.00180434 on November 12, 2017, during its early stages following launch in June 2017.
- 2025: BROCCOLI experienced its all-time low of $0.00616 on October 10, 2025, reflecting market volatility.
- Comparative Analysis: BROCCOLI has shown significant volatility since its launch, declining approximately 92.95% from its all-time high of $0.28778 to its current price of $0.0203. In contrast, TRX has demonstrated more stable performance over a longer timeframe, currently trading at $0.3096, representing a decline of approximately 28.22% from its all-time high.
Current Market Status (January 23, 2026)
- BROCCOLI Current Price: $0.0203
- TRX Current Price: $0.3096
- 24-Hour Trading Volume: BROCCOLI $178,668.82 vs TRX $5,969,012.33
- Market Sentiment Index (Fear & Greed Index): 24 (Extreme Fear)
- BROCCOLI 24-Hour Price Change: +4.4%
- TRX 24-Hour Price Change: +2.85%
- BROCCOLI Market Capitalization: $19,700,336.36
- TRX Market Capitalization: $29,322,672,673.89
- BROCCOLI Market Dominance: 0.00062%
- TRX Market Dominance: 0.92%
View Real-Time Prices:
II. Core Factors Affecting BROCCOLI vs TRX Investment Value
Supply Mechanism Comparison (Tokenomics)
Due to limited available data on the specific supply mechanisms of BROCCOLI and TRX, a detailed comparison cannot be provided at this time. Generally speaking, token supply mechanisms including fixed supply models, deflationary models, and halving mechanisms can influence price cycles through changes in circulating supply and market demand dynamics.
Institutional Adoption and Market Application
Institutional Holdings: Current data does not provide sufficient information to determine which asset receives more institutional preference.
Enterprise Adoption: Specific applications of BROCCOLI and TRX in cross-border payments, settlement systems, and investment portfolios are not detailed in available materials.
National Policies: Regulatory attitudes toward these assets vary across jurisdictions, though specific policy positions are not documented in the reference materials.
Technical Development and Ecosystem Building
Without detailed information on recent technical upgrades for either BROCCOLI or TRX, a comprehensive comparison of their technological developments cannot be established.
Ecosystem Comparison: The implementation status of DeFi protocols, NFT platforms, payment systems, and smart contract deployments for both assets requires additional data for meaningful analysis.
Macroeconomic Environment and Market Cycles
Performance in Inflationary Environments: The comparative anti-inflation properties of BROCCOLI versus TRX cannot be determined from available data.
Macroeconomic Monetary Policy: The impact of interest rates, US Dollar Index movements, and other monetary policy factors on both assets may vary, though specific correlations are not documented in the reference materials.
Geopolitical Factors: Cross-border transaction demand and international circumstances can influence cryptocurrency markets broadly, though asset-specific impacts require further analysis.
III. 2026-2031 Price Prediction: BROCCOLI vs TRX
Short-term Forecast (2026)
- BROCCOLI: Conservative $0.012234 - $0.02039 | Optimistic $0.02039 - $0.024468
- TRX: Conservative $0.2919828 - $0.31062 | Optimistic $0.31062 - $0.4286556
Mid-term Forecast (2028-2029)
- BROCCOLI may enter a gradual growth phase, with projected prices ranging from $0.0208926135 to $0.0363686235 in 2028, potentially expanding to $0.022999930195 - $0.0450674307875 by 2029
- TRX may enter a sustained expansion phase, with projected prices ranging from $0.399208824 to $0.51148630575 in 2028, potentially reaching $0.39411475306875 - $0.60740038414125 by 2029
- Key drivers: institutional capital inflows, ETF developments, ecosystem expansion
Long-term Forecast (2030-2031)
- BROCCOLI: Baseline scenario $0.020194560330945 - $0.038835692944125 | Optimistic scenario $0.03807420876875 - $0.051651471615686
- TRX: Baseline scenario $0.449847215796825 - $0.64263887970975 | Optimistic scenario $0.535532399758125 - $0.784019433245895
View detailed price predictions for BROCCOLI and TRX
Disclaimer
Price predictions are based on historical data analysis and market modeling. Actual prices may differ significantly due to market volatility, regulatory changes, technological developments, and macroeconomic factors. This information is for reference purposes only and does not constitute investment advice.
BROCCOLI:
| Year |
Predicted High Price |
Predicted Average Price |
Predicted Low Price |
Price Change |
| 2026 |
0.024468 |
0.02039 |
0.012234 |
0 |
| 2027 |
0.0291577 |
0.022429 |
0.0201861 |
10 |
| 2028 |
0.0363686235 |
0.02579335 |
0.0208926135 |
27 |
| 2029 |
0.0450674307875 |
0.03108098675 |
0.022999930195 |
53 |
| 2030 |
0.0395971771195 |
0.03807420876875 |
0.03198233536575 |
87 |
| 2031 |
0.051651471615686 |
0.038835692944125 |
0.020194560330945 |
91 |
TRX:
| Year |
Predicted High Price |
Predicted Average Price |
Predicted Low Price |
Price Change |
| 2026 |
0.4286556 |
0.31062 |
0.2919828 |
0 |
| 2027 |
0.46204725 |
0.3696378 |
0.266139216 |
19 |
| 2028 |
0.51148630575 |
0.415842525 |
0.399208824 |
34 |
| 2029 |
0.60740038414125 |
0.463664415375 |
0.39411475306875 |
49 |
| 2030 |
0.749745359661375 |
0.535532399758125 |
0.449847215796825 |
72 |
| 2031 |
0.784019433245895 |
0.64263887970975 |
0.604080546927165 |
107 |
IV. Investment Strategy Comparison: BROCCOLI vs TRX
Long-term vs Short-term Investment Strategies
- BROCCOLI: May be suitable for investors seeking high-risk, high-return opportunities in early-stage community-driven projects with acceptance of substantial volatility
- TRX: May be suitable for investors interested in established blockchain infrastructure platforms with broader ecosystem adoption and relatively more stable performance history
Risk Management and Asset Allocation
- Conservative Investors: BROCCOLI: 5-10% vs TRX: 15-25%
- Aggressive Investors: BROCCOLI: 15-25% vs TRX: 25-40%
- Hedging Tools: Stablecoin allocation, options strategies, cross-asset portfolio diversification
V. Potential Risk Comparison
Market Risks
- BROCCOLI: Exhibits significant volatility since launch, with approximately 92.95% decline from all-time high; limited trading volume of $178,668.82 may result in liquidity challenges; market dominance of 0.00062% indicates minimal market presence
- TRX: Subject to broader cryptocurrency market cycles and regulatory developments; 24-hour trading volume of $5,969,012.33 demonstrates stronger liquidity; market dominance of 0.92% reflects established market position
Technical Risks
- BROCCOLI: Operating on BSC network with over 46,000 holders; limited information available regarding technical infrastructure resilience and security measures
- TRX: As a blockchain infrastructure platform since 2017 with over 219 million holders, faces ongoing challenges related to network scalability, security architecture, and technological competition
Regulatory Risks
- Global regulatory developments may impact both assets differently based on their respective use cases, market positioning, and jurisdictional classifications; community-driven meme tokens and established blockchain platforms may face distinct regulatory scrutiny across different markets
VI. Conclusion: Which Is the Better Buy?
📌 Investment Value Summary:
- BROCCOLI Characteristics: Community-driven fair-launch token with over 46,000 holders; launched in 2025 on BSC network; current market cap of $19,700,336.36; demonstrates high volatility with potential for significant price movements
- TRX Characteristics: Established blockchain infrastructure platform since 2017; market cap ranking of 8 with over 219 million holders; market cap of $29,322,672,673.89; longer operational history with relatively more stable performance patterns
✅ Investment Considerations:
- Novice Investors: Consider starting with assets demonstrating longer operational history and broader market adoption; focus on understanding fundamental differences in project positioning and risk profiles
- Experienced Investors: May evaluate portfolio diversification strategies incorporating both established platforms and emerging community projects based on individual risk tolerance and investment objectives
- Institutional Investors: Assessment should include comprehensive due diligence on technical infrastructure, regulatory compliance, liquidity metrics, and alignment with institutional investment mandates
⚠️ Risk Disclaimer: Cryptocurrency markets demonstrate extreme volatility. This content does not constitute investment advice. Investors should conduct independent research and consider their financial situation before making investment decisions.
VII. FAQ
Q1: What are the main differences between BROCCOLI and TRX in terms of project positioning?
BROCCOLI is a community-driven meme token launched in 2025 on the BSC network, while TRX is an established blockchain infrastructure platform operating since 2017. BROCCOLI positions itself as a fair-launch token with over 46,000 holders and focuses on community engagement, whereas TRX serves as a major blockchain ecosystem with over 219 million holders, supporting decentralized applications, smart contracts, and infrastructure development. The fundamental distinction lies in their core purposes: BROCCOLI operates primarily as a community-driven asset with meme token characteristics, while TRX functions as a comprehensive blockchain platform supporting diverse technological applications and enterprise adoption.
Q2: Which asset demonstrates better price stability based on historical performance?
TRX demonstrates significantly better price stability compared to BROCCOLI. TRX has declined approximately 28.22% from its all-time high of $0.431288 (December 4, 2024) to its current price of $0.3096, showing relatively moderate volatility over its longer operational history since 2017. In contrast, BROCCOLI has experienced approximately 92.95% decline from its all-time high of $0.28778 (February 14, 2025) to its current price of $0.0203, reflecting substantial volatility within its shorter timeframe since launch. TRX's longer market presence, larger market capitalization of $29,322,672,673.89, and broader holder base contribute to its comparatively more stable price performance patterns.
Q3: How do the market capitalizations and trading volumes compare between BROCCOLI and TRX?
TRX substantially exceeds BROCCOLI across all market metrics. TRX maintains a market capitalization of $29,322,672,673.89 with a market dominance of 0.92%, compared to BROCCOLI's market cap of $19,700,336.36 and market dominance of 0.00062%. The disparity extends to trading volumes, with TRX recording 24-hour trading volume of $5,969,012.33 versus BROCCOLI's $178,668.82. This significant difference reflects TRX's established position as a major blockchain platform with broader market adoption and liquidity, while BROCCOLI represents an early-stage community project with considerably smaller market presence and trading activity.
Q4: What are the projected price ranges for BROCCOLI and TRX through 2031?
For 2026, BROCCOLI's conservative forecast ranges from $0.012234 to $0.02039, with optimistic scenarios reaching $0.02039 to $0.024468. By 2031, BROCCOLI's baseline scenario projects $0.020194560330945 to $0.038835692944125, with optimistic scenarios extending to $0.03807420876875 - $0.051651471615686. For TRX, 2026 conservative forecasts range from $0.2919828 to $0.31062, with optimistic scenarios reaching $0.31062 to $0.4286556. By 2031, TRX's baseline scenario projects $0.449847215796825 to $0.64263887970975, with optimistic scenarios extending to $0.535532399758125 - $0.784019433245895. These projections suggest potential cumulative growth of approximately 91% for BROCCOLI and 107% for TRX by 2031, though actual outcomes may vary significantly based on market conditions, regulatory developments, and technological factors.
Q5: What are the primary risk factors investors should consider when comparing these assets?
Market risks differ substantially between both assets. BROCCOLI's primary concerns include extreme volatility (92.95% decline from all-time high), limited trading volume of $178,668.82 creating potential liquidity challenges, and minimal market dominance of 0.00062%. Technical risks for BROCCOLI involve limited information regarding infrastructure resilience despite operating on BSC network with 46,000 holders. TRX faces different risk profiles including exposure to broader cryptocurrency market cycles, ongoing challenges related to network scalability and technological competition despite stronger liquidity ($5,969,012.33 trading volume) and established market position (0.92% dominance). Regulatory risks affect both assets differently: community-driven meme tokens and established blockchain platforms may face distinct regulatory scrutiny across various jurisdictions, requiring investors to consider compliance implications based on their geographic location and investment structure.
Q6: Which investment strategy is more appropriate for different investor profiles?
Investment strategy suitability varies significantly based on investor profiles and risk tolerance. Conservative investors might consider 5-10% allocation to BROCCOLI versus 15-25% to TRX, reflecting BROCCOLI's higher risk profile and TRX's more established position. Aggressive investors may pursue 15-25% allocation to BROCCOLI versus 25-40% to TRX, accepting higher volatility for potentially greater returns. Novice investors should prioritize assets with longer operational history and broader market adoption, focusing on understanding fundamental project differences and risk profiles before investment. Experienced investors may evaluate portfolio diversification strategies incorporating both established platforms and emerging community projects aligned with individual risk tolerance. Institutional investors require comprehensive due diligence on technical infrastructure, regulatory compliance, liquidity metrics, and alignment with institutional investment mandates before considering either asset.
Q7: How does the current market sentiment affect investment decisions for these assets?
The current market sentiment, as reflected by the Fear & Greed Index at 24 (Extreme Fear) as of January 23, 2026, indicates heightened market caution and risk aversion. Despite this negative sentiment, BROCCOLI demonstrated +4.4% 24-hour price change while TRX showed +2.85% increase, suggesting some resilience against prevailing market pessimism. Extreme Fear conditions typically present potential accumulation opportunities for long-term investors with appropriate risk tolerance, though timing market bottoms remains challenging. The sentiment disparity between short-term price performance and broader market fear suggests investors should carefully evaluate fundamental project characteristics rather than relying solely on sentiment indicators. Market conditions characterized by Extreme Fear may amplify volatility for smaller-cap assets like BROCCOLI while potentially creating more measured responses in established platforms like TRX, requiring investors to adjust position sizing and risk management strategies accordingly.
Q8: What role do holder numbers play in assessing investment potential?
Holder distribution provides significant insights into network adoption and community strength. TRX's over 219 million holders substantially exceeds BROCCOLI's 46,000 holders, demonstrating vastly different scales of user adoption and network effects. Larger holder bases typically correlate with enhanced liquidity, broader ecosystem participation, and potentially reduced concentration risk, though they don't guarantee price performance or project success. BROCCOLI's smaller holder base reflects its recent launch in 2025 and community-driven nature, potentially offering earlier-stage growth opportunities alongside higher concentration risks. The approximately 4,760x difference in holder numbers between TRX and BROCCOLI underscores fundamental distinctions in market maturity, adoption trajectory, and network utility. Investors should consider holder metrics alongside other factors including trading volume, market capitalization, technological development, and use case viability when evaluating comparative investment potential between emerging community tokens and established blockchain platforms.
* The information is not intended to be and does not constitute financial advice or any other recommendation of any sort offered or endorsed by Gate.