This comprehensive guide compares BTR and ZIL, two distinct blockchain networks competing in the crypto market. BTR (Bitlayer), launched in 2025, pioneers Bitcoin DeFi through BitVM implementation and smart contract capabilities, currently trading at $0.06748 with higher volatility. ZIL (Zilliqa), established in 2018, utilizes sharding technology for high-throughput transaction processing, trading at $0.004988 with more stable patterns. The article analyzes historical price trends, market status, technological differentiation, and investment scenarios for both assets. BTR appeals to risk-tolerant investors seeking emerging Bitcoin Layer 2 exposure, while ZIL suits conservative investors preferring established infrastructure. Long-term forecasts suggest BTR potential upside of 43-157% through 2031, versus ZIL's 24-145% growth. Check real-time prices and detailed analysis on Gate to make informed investment decisions aligned with your risk tolerance and portfolio objectives.
Introduction: BTR vs ZIL Investment Comparison
In the cryptocurrency market, the comparison between BTR vs ZIL has consistently been a topic that investors cannot overlook. The two differ significantly in market cap ranking, application scenarios, and price performance, representing distinct positioning within the crypto asset landscape.
BTR (Bitlayer): Launched in 2025, it has gained market recognition by pioneering the first BitVM implementation and unlocking Bitcoin DeFi potential through a combination of security and high-performance smart contract capabilities.
ZIL (Zilliqa): Introduced in 2018, it has been positioned as a high-throughput public blockchain platform, utilizing sharding technology to scale transaction processing capacity to thousands of transactions per second.
This article will comprehensively analyze the investment value comparison of BTR vs ZIL, focusing on historical price trends, supply mechanisms, institutional adoption, technical ecosystems, and future forecasts, attempting to answer the question investors care about most:
"Which is the better buy right now?"
I. Historical Price Comparison and Current Market Status
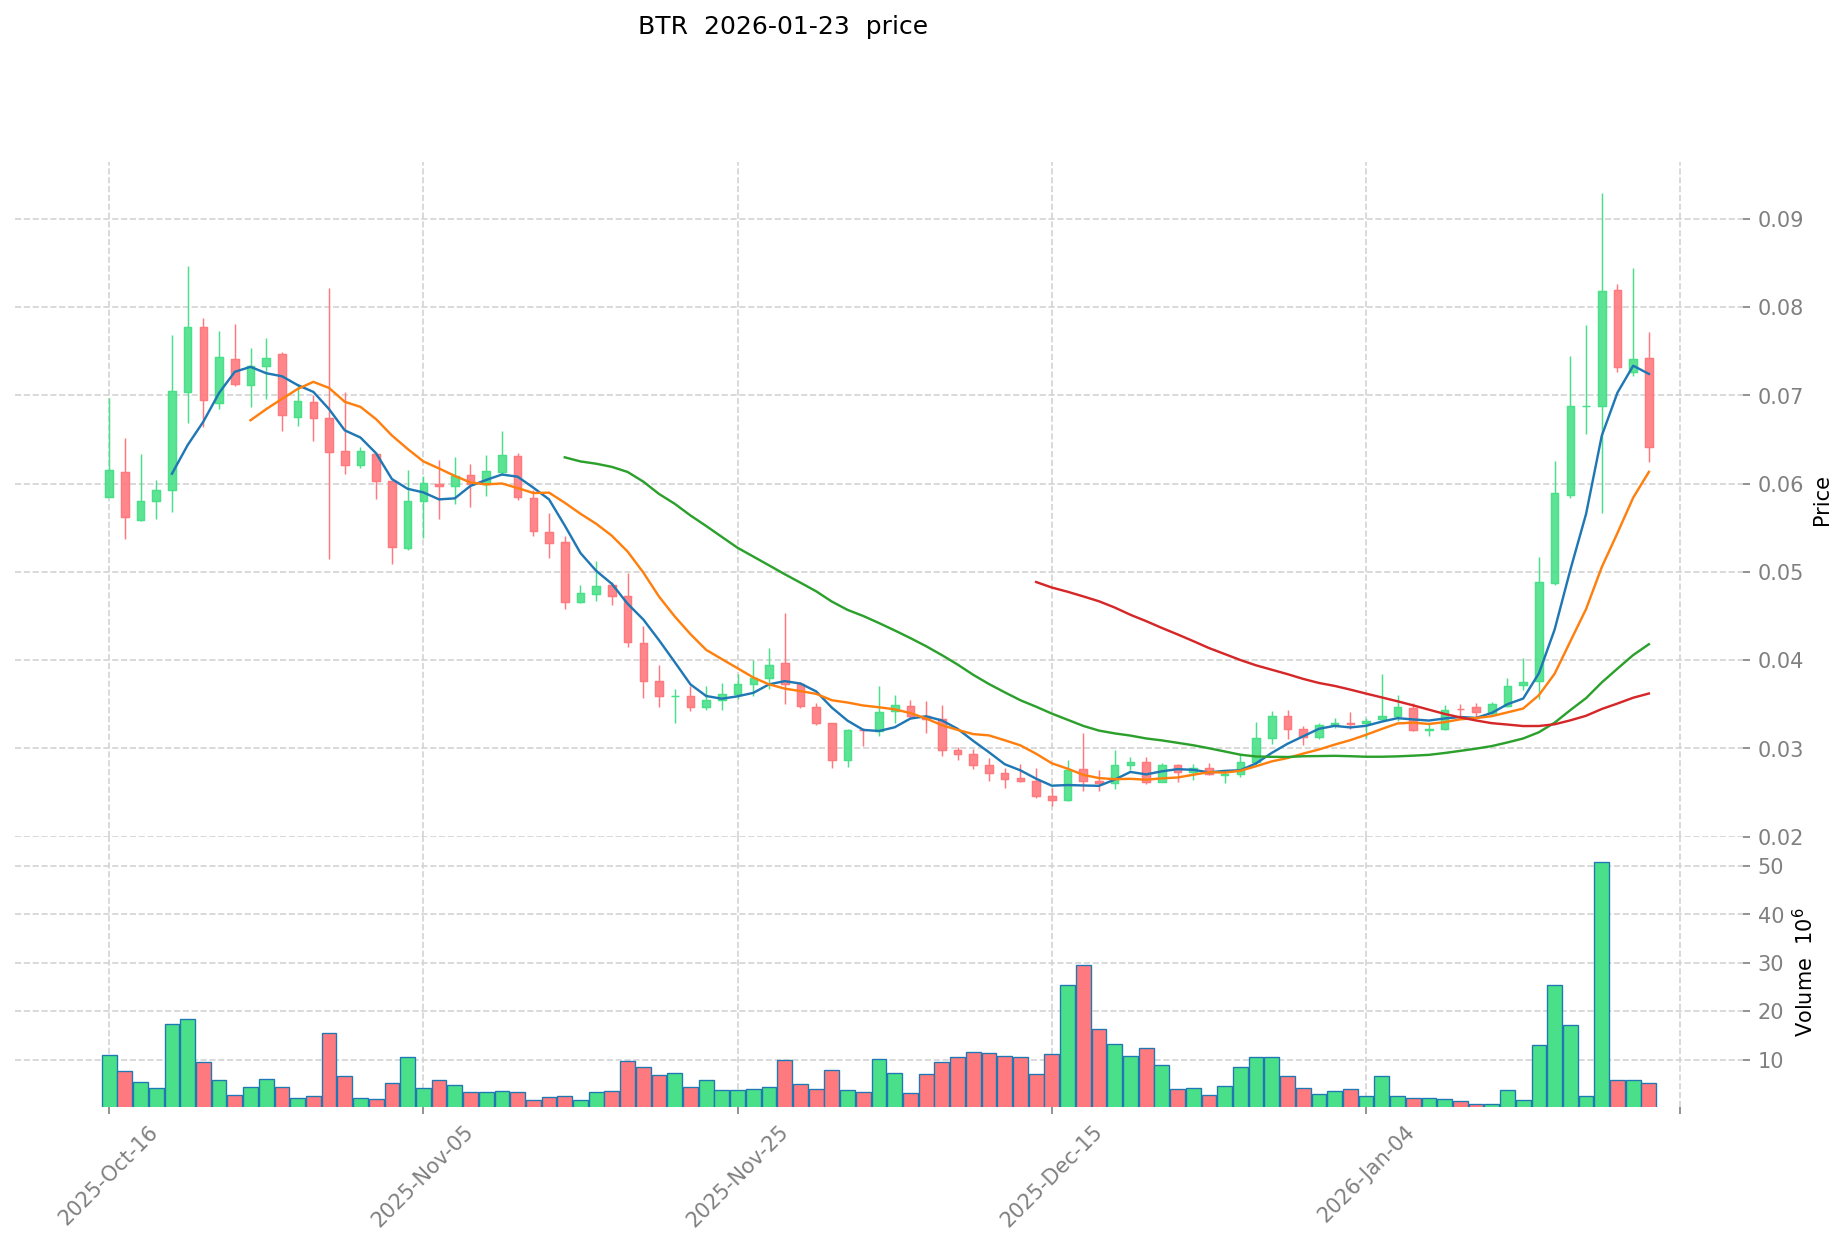
- 2025: BTR reached a notable price level of $0.176 in September 2025, marking a significant point in its early trading history.
- 2025: BTR experienced substantial volatility, declining to $0.02345 in December 2025, reflecting market adjustment pressures.
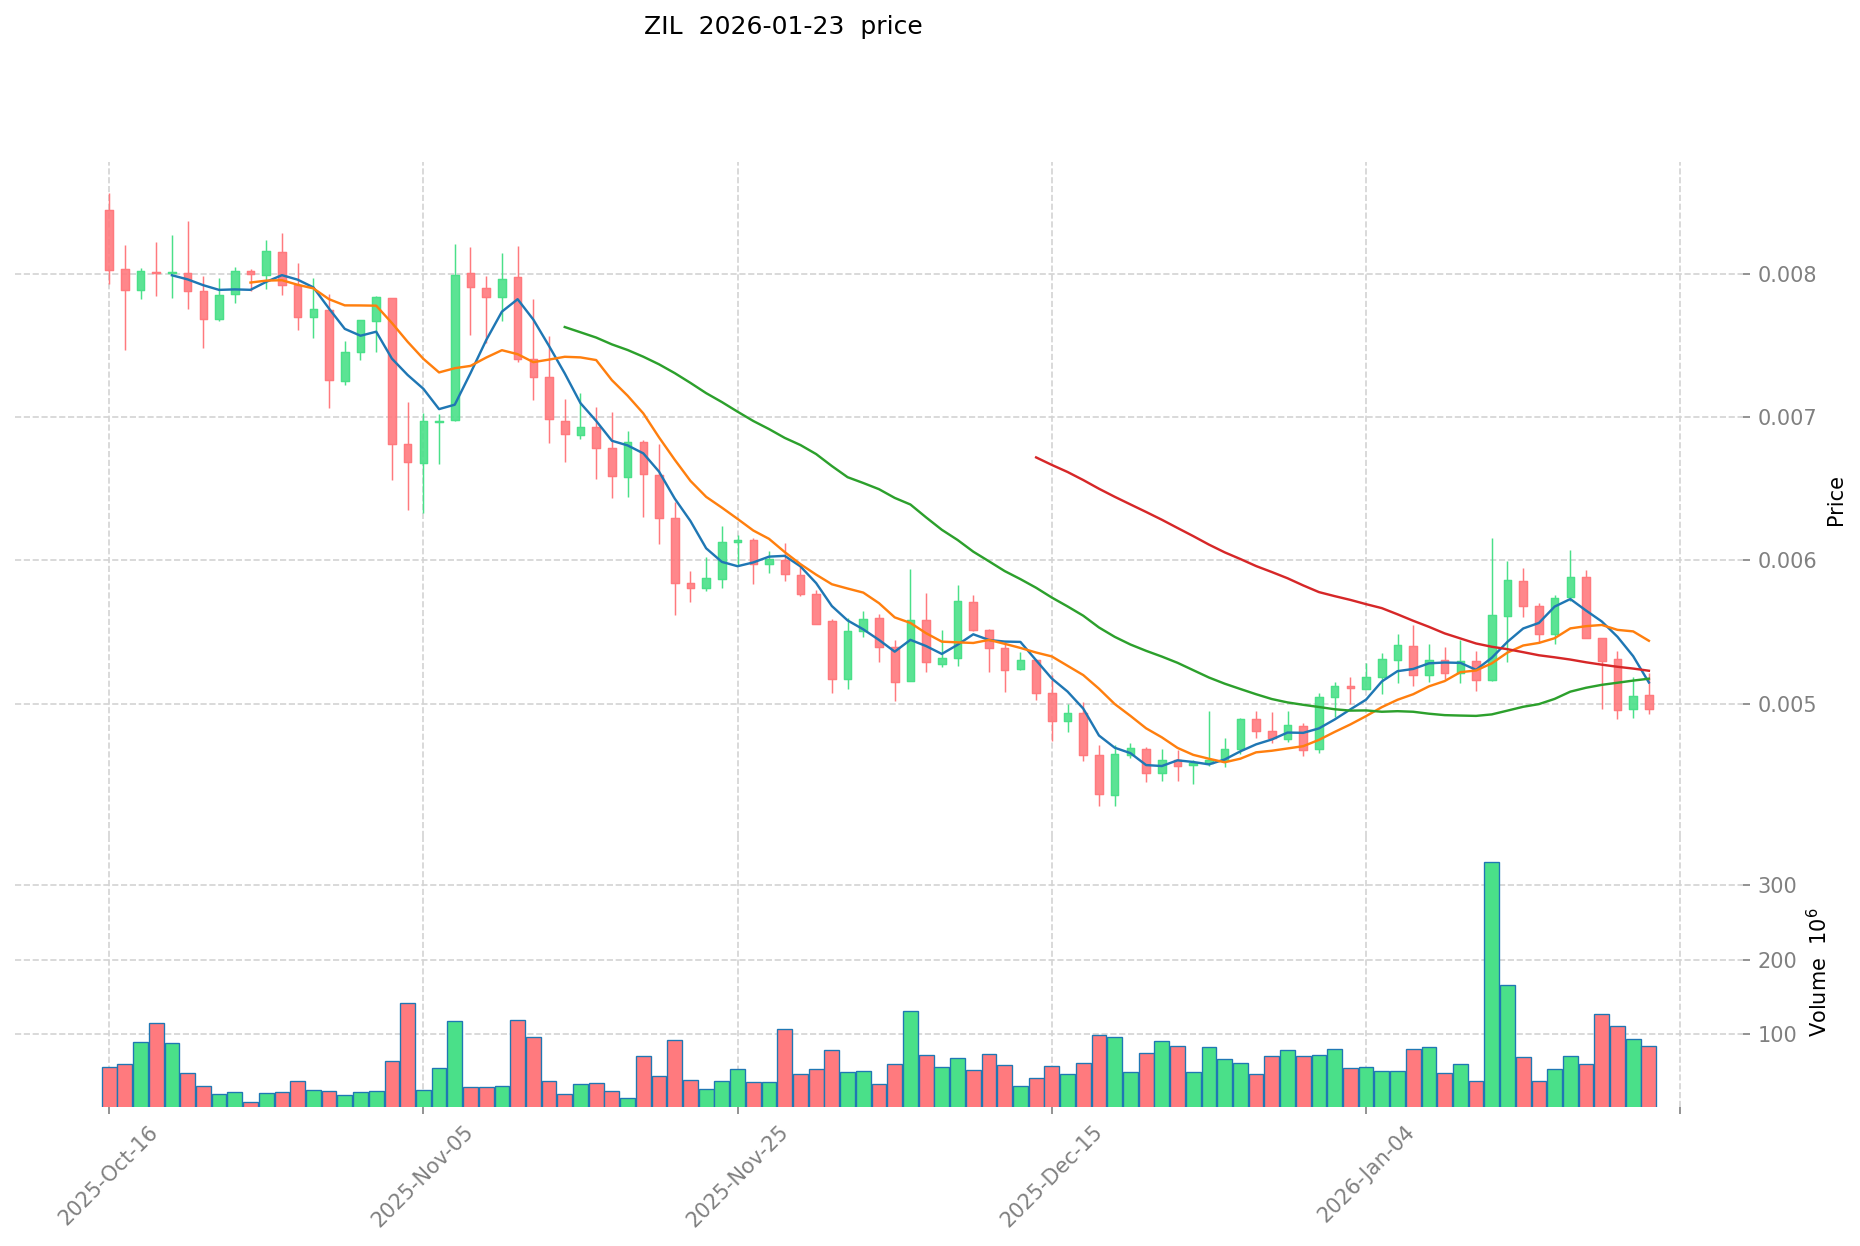
- 2021: ZIL achieved its historical high of $0.255376 in May 2021, influenced by favorable market conditions during that period.
- 2020: ZIL recorded its lowest price point at $0.00239616 in March 2020, corresponding to broader market dynamics.
- Comparative Analysis: During recent market cycles, BTR demonstrated significant price movement from $0.176 to $0.02345, while ZIL exhibited different volatility patterns, moving from its 2021 peak of $0.255376 to current levels around $0.004988.
Current Market Status (2026-01-24)
- BTR current price: $0.06748
- ZIL current price: $0.004988
- 24-hour trading volume: BTR recorded $277,282.48 compared to ZIL's $401,731.54
- Market Sentiment Index (Fear & Greed Index): 24 (Extreme Fear)
View real-time prices:
II. Core Factors Influencing BTR vs ZIL Investment Value
Due to the absence of specific reference materials regarding BTR and ZIL, a comprehensive comparative analysis cannot be conducted at this time. Key analytical dimensions that would typically be examined include supply mechanisms, institutional adoption patterns, technological development trajectories, and macroeconomic correlations.
For informed investment considerations, stakeholders are advised to consult official project documentation, on-chain metrics, and verified market data sources to evaluate these assets independently.
III. 2026-2031 Price Forecast: BTR vs ZIL
Short-term Forecast (2026)
- BTR: Conservative $0.048492 - $0.06735 | Optimistic $0.06735 - $0.0909225
- ZIL: Conservative $0.00275165 - $0.005003 | Optimistic $0.005003 - $0.00665399
Mid-term Forecast (2028-2029)
- BTR may enter a gradual growth phase, with estimated price range of $0.0591187355625 - $0.129677387640937
- ZIL may enter a consolidation phase, with estimated price range of $0.00402166155 - $0.00929985336608
- Key drivers: institutional capital inflows, ETF adoption, ecosystem development
Long-term Forecast (2030-2031)
- BTR: Base scenario $0.096551152715367 - $0.118133175087037 | Optimistic scenario $0.122676758744231 - $0.173655767377945
- ZIL: Base scenario $0.006212011428123 - $0.009110950094581 | Optimistic scenario $0.009939218284998 - $0.012208673126739
View detailed price predictions for BTR and ZIL
Disclaimer
BTR:
| Year |
Predicted High Price |
Predicted Average Price |
Predicted Low Price |
Price Change |
| 2026 |
0.0909225 |
0.06735 |
0.048492 |
0 |
| 2027 |
0.0973375875 |
0.07913625 |
0.045899025 |
17 |
| 2028 |
0.1067666716875 |
0.08823691875 |
0.0591187355625 |
30 |
| 2029 |
0.129677387640937 |
0.09750179521875 |
0.075076382318437 |
44 |
| 2030 |
0.122676758744231 |
0.113589591429843 |
0.096551152715367 |
68 |
| 2031 |
0.173655767377945 |
0.118133175087037 |
0.06497324629787 |
75 |
ZIL:
| Year |
Predicted High Price |
Predicted Average Price |
Predicted Low Price |
Price Change |
| 2026 |
0.00665399 |
0.005003 |
0.00275165 |
0 |
| 2027 |
0.00775189835 |
0.005828495 |
0.00402166155 |
16 |
| 2028 |
0.0077408242095 |
0.006790196675 |
0.00631488290775 |
36 |
| 2029 |
0.00929985336608 |
0.00726551044225 |
0.005303822622842 |
45 |
| 2030 |
0.009939218284998 |
0.008282681904165 |
0.006212011428123 |
66 |
| 2031 |
0.012208673126739 |
0.009110950094581 |
0.007015431572827 |
82 |
IV. Investment Strategy Comparison: BTR vs ZIL
Long-term vs Short-term Investment Strategies
- BTR: May appeal to investors focused on Bitcoin DeFi ecosystem development and early-stage blockchain infrastructure projects with higher risk tolerance
- ZIL: May suit investors interested in established high-throughput blockchain platforms with sharding technology implementation
Risk Management and Asset Allocation
- Conservative investors: BTR 30% vs ZIL 70%
- Aggressive investors: BTR 60% vs ZIL 40%
- Hedging instruments: stablecoin allocation, options strategies, cross-asset portfolio diversification
V. Potential Risk Comparison
Market Risk
- BTR: As a project launched in 2025, BTR exhibits notable price volatility, with recorded fluctuations from $0.176 to $0.02345 within months, indicating sensitivity to market sentiment shifts
- ZIL: Having operated since 2018, ZIL shows established market patterns, though current price levels around $0.004988 represent significant distance from historical peaks
Technical Risk
- BTR: Scalability considerations and network stability require ongoing monitoring as the platform develops its BitVM implementation
- ZIL: Network architecture maturity and sharding mechanism performance warrant continued evaluation
Regulatory Risk
- Global regulatory frameworks may impact both assets differently based on their respective functionalities, geographical user distribution, and compliance approaches
VI. Conclusion: Which Is the Better Buy?
📌 Investment Value Summary:
- BTR advantages: Early positioning in Bitcoin DeFi sector, BitVM technology implementation, potential for ecosystem growth in emerging Bitcoin Layer 2 solutions
- ZIL advantages: Longer operational history since 2018, established sharding technology infrastructure, demonstrated capacity for high-throughput transaction processing
✅ Investment Recommendations:
- Beginner investors: Consider ZIL for exposure to more established blockchain infrastructure, combined with stablecoin holdings for risk mitigation
- Experienced investors: Evaluate portfolio allocation between BTR and ZIL based on risk appetite, with BTR offering higher volatility potential and ZIL providing relative stability
- Institutional investors: Conduct comprehensive due diligence on both assets' technological roadmaps, regulatory compliance status, and liquidity profiles before position sizing
⚠️ Risk Warning: Cryptocurrency markets exhibit extreme volatility. This content does not constitute investment advice.
VII. FAQ
Q1: What are the main differences between BTR and ZIL in terms of technology implementation?
BTR focuses on Bitcoin DeFi infrastructure through BitVM implementation and Layer 2 solutions, while ZIL specializes in high-throughput blockchain architecture using sharding technology. BTR, launched in 2025, represents a newer approach to unlocking Bitcoin's smart contract capabilities with emphasis on security and performance. ZIL, operational since 2018, has established itself as a scalable public blockchain platform capable of processing thousands of transactions per second through its pioneering sharding mechanism. The fundamental distinction lies in BTR's Bitcoin-centric positioning versus ZIL's independent high-performance blockchain architecture.
Q2: How do the historical price movements of BTR and ZIL reflect their market maturity?
BTR demonstrates higher volatility characteristic of early-stage projects, while ZIL exhibits patterns typical of established blockchain platforms. BTR experienced significant price fluctuations from $0.176 in September 2025 to $0.02345 in December 2025, indicating sensitivity to market sentiment and early adoption dynamics. In contrast, ZIL's price history spans from its 2021 peak of $0.255376 to current levels around $0.004988, reflecting longer market cycles and established trading patterns. This volatility differential suggests BTR carries higher risk-reward potential, whereas ZIL offers relatively more predictable price behavior based on historical data.
Q3: Which asset is more suitable for conservative investors in 2026?
ZIL appears more aligned with conservative investment profiles due to its longer operational history and established market presence. Conservative investors typically prioritize capital preservation and lower volatility exposure, for which the recommended allocation suggests 70% ZIL versus 30% BTR. ZIL's seven-year operational track record since 2018, proven sharding technology implementation, and more stable price patterns provide characteristics that conservative investors typically seek. Additionally, ZIL's demonstrated capacity for sustained network operations and established user base reduces certain technological execution risks compared to BTR's emerging Bitcoin DeFi positioning.
Q4: What role does the current market sentiment play in BTR vs ZIL investment decisions?
The Fear & Greed Index reading of 24 (Extreme Fear) as of January 24, 2026, significantly influences tactical investment timing for both assets. During extreme fear periods, historically oversold conditions may present accumulation opportunities for investors with longer time horizons, though short-term price pressure typically persists. For BTR, this sentiment environment amplifies volatility risk given its recent launch and smaller market presence. For ZIL, extreme fear conditions may offer entry points for investors seeking exposure to established blockchain infrastructure at depressed valuations. Market sentiment analysis should be combined with fundamental evaluation and risk tolerance assessment when making allocation decisions between these assets.
Q5: How do the 24-hour trading volumes compare and what do they indicate?
ZIL's 24-hour trading volume of $401,731.54 exceeds BTR's $277,282.48, indicating relatively higher liquidity and market participation. Higher trading volume typically correlates with easier entry and exit execution, tighter bid-ask spreads, and reduced slippage risk for investors. ZIL's superior liquidity profile reflects its longer market presence and broader exchange listings accumulated since 2018. For BTR, the lower trading volume suggests developing liquidity conditions typical of newer projects, which may result in higher transaction costs and potential execution challenges during periods of market stress. Investors should consider liquidity requirements when determining position sizes, particularly for larger allocations.
Q6: What are the projected long-term growth trajectories for BTR and ZIL through 2031?
BTR's forecast suggests potential price appreciation from current levels of $0.06748 to a range of $0.096551-$0.173656 by 2031, representing possible upside of 43%-157%. ZIL's projections indicate movement from $0.004988 to $0.006212-$0.012209 by 2031, suggesting potential gains of 24%-145%. These forecasts reflect BTR's higher volatility profile and emerging market positioning versus ZIL's more established trajectory. Key drivers include institutional capital inflows, ecosystem development milestones, ETF adoption potential, and broader cryptocurrency market cycles. Investors should recognize that long-term forecasts carry substantial uncertainty and actual outcomes may vary significantly based on technological execution, regulatory developments, and competitive dynamics.
Q7: What specific risks should investors monitor when comparing BTR and ZIL?
Market risk manifests differently for each asset - BTR exhibits extreme short-term volatility evidenced by its 87% decline from $0.176 to $0.02345 within months, while ZIL shows 98% drawdown from historical peaks at $0.255376 to current levels. Technical risks include BTR's need to prove scalability and network stability as its BitVM implementation matures, whereas ZIL faces ongoing requirements to maintain sharding mechanism performance and network architecture competitiveness. Regulatory risk applies to both assets but may impact them differently based on their respective functionalities and jurisdictional user distributions. Investors should implement appropriate risk management through position sizing, portfolio diversification, and continuous monitoring of technological developments and regulatory announcements affecting both projects.
Q8: How should institutional investors approach due diligence for BTR vs ZIL?
Institutional investors require comprehensive evaluation frameworks encompassing technological roadmaps, regulatory compliance status, liquidity profiles, and custodial solutions for both assets. For BTR, critical assessment areas include BitVM implementation progress, Bitcoin DeFi ecosystem development milestones, security audit results, and early-stage execution risks. For ZIL, evaluation should focus on sharding technology scalability metrics, network activity trends, competitive positioning against alternative Layer 1 solutions, and long-term sustainability of the economic model. Liquidity analysis should examine order book depth, exchange coverage, derivative market availability, and potential slippage scenarios across different position sizes. Regulatory due diligence must assess classification status across relevant jurisdictions, compliance frameworks, and potential regulatory exposure scenarios for each asset.
* The information is not intended to be and does not constitute financial advice or any other recommendation of any sort offered or endorsed by Gate.