This comprehensive analysis compares BitShares (BTS) and dYdX (DYDX), two distinct decentralized platforms serving different market segments. BTS, launched in 2014, operates as early-stage DeFi infrastructure focusing on collateralized asset issuance with limited liquidity ($14,661 daily volume). DYDX, introduced in 2021, demonstrates strong institutional adoption with $200M+ daily trading volumes and $175-200M open interest on its decentralized derivatives exchange. The article examines historical price trends, tokenomics (DYDX's fixed 1B supply with 2% inflation cap versus BTS's collateral-backed mechanism), technological evolution, and 2026-2031 price forecasts. DYDX projects baseline $0.125-$0.245 by 2031, while BTS targets $0.00104-$0.00180. Investment strategies vary by risk profile, with DYDX suited for derivatives exposure and BTS for specialized DeFi diversification. Risk analysis addresses liquidity constraints, market volatility, and regulatory considerations relevant to both assets on Gate.
Introduction: Investment Comparison Between BTS and DYDX
In the cryptocurrency market, the comparison between BTS vs DYDX continues to be a topic of interest for investors. These two assets demonstrate notable differences in market capitalization ranking, application scenarios, and price performance, while representing distinct positioning within the crypto asset landscape.
BitShares (BTS): Launched in 2014, this industrial-grade decentralized platform focuses on high-performance financial smart contracts. BTS serves as the core token with utility and governance functions, used for voting, rewards, and transaction fee payments.
dYdX (DYDX): Introduced in 2021, this governance token enables community participation in protocol governance for a decentralized perpetual contract exchange operating on Layer 2 blockchain infrastructure, with additional spot, leverage, and lending services on Layer 1.
This article will provide a comprehensive analysis of BTS vs DYDX investment value comparison, examining historical price trends, supply mechanisms, institutional adoption, technological ecosystems, and future projections, while addressing the question most relevant to investors:
"Which is the better buy right now?"
I. Historical Price Comparison and Current Market Status
BTS (BitShares) and DYDX (dYdX) Historical Price Trends
- 2018: BTS experienced notable price movement, with the token showing volatility during the broader crypto market cycle. Price data indicates fluctuation patterns typical of the period.
- 2024: DYDX showed price sensitivity to platform developments, particularly related to its migration to the Cosmos ecosystem and governance token implementation.
- Comparative Analysis: During various market cycles, BTS has demonstrated price ranges from $0.0000032 to $0.923921, while DYDX has fluctuated between $0.126201 and $4.52, reflecting different market positioning and adoption trajectories.
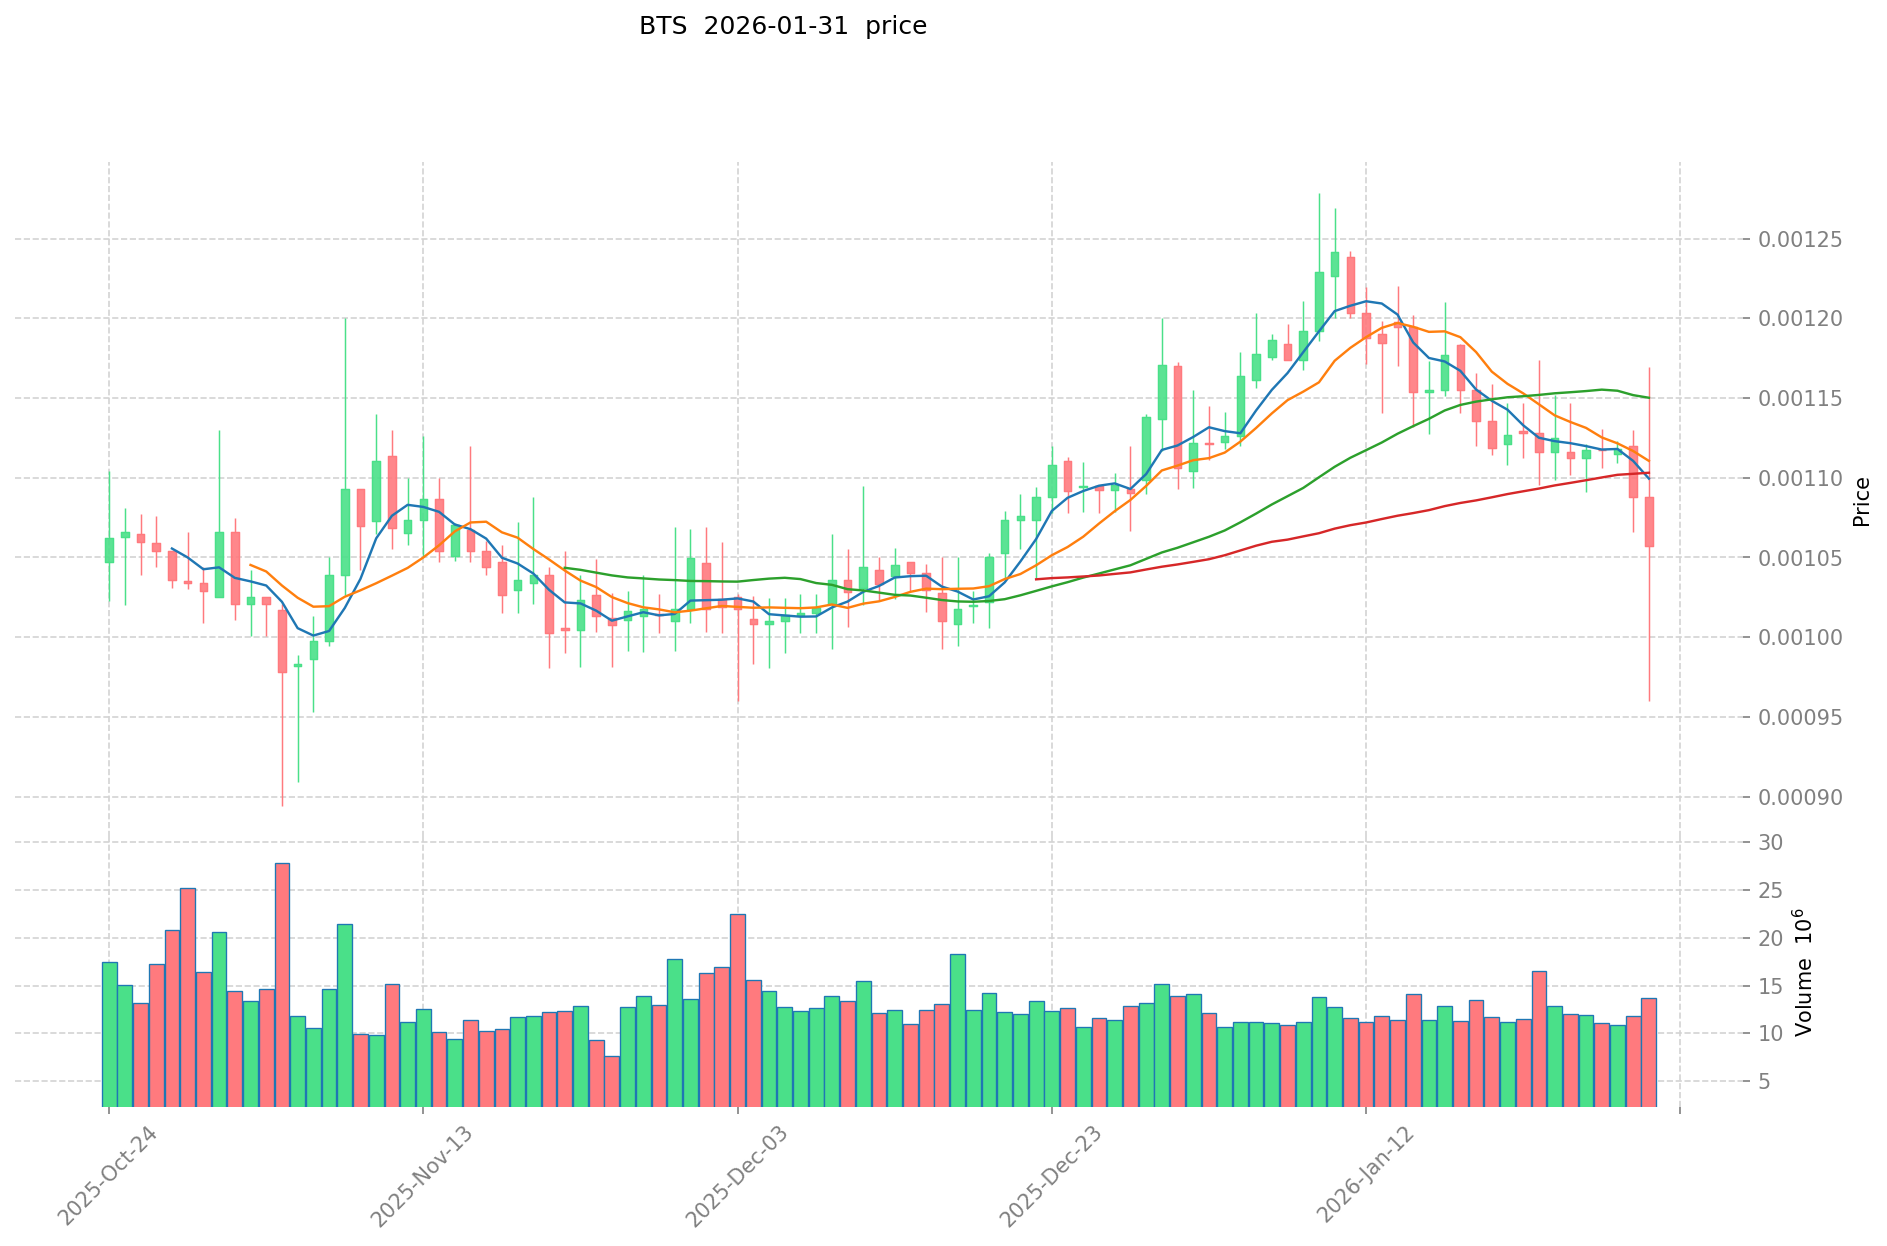
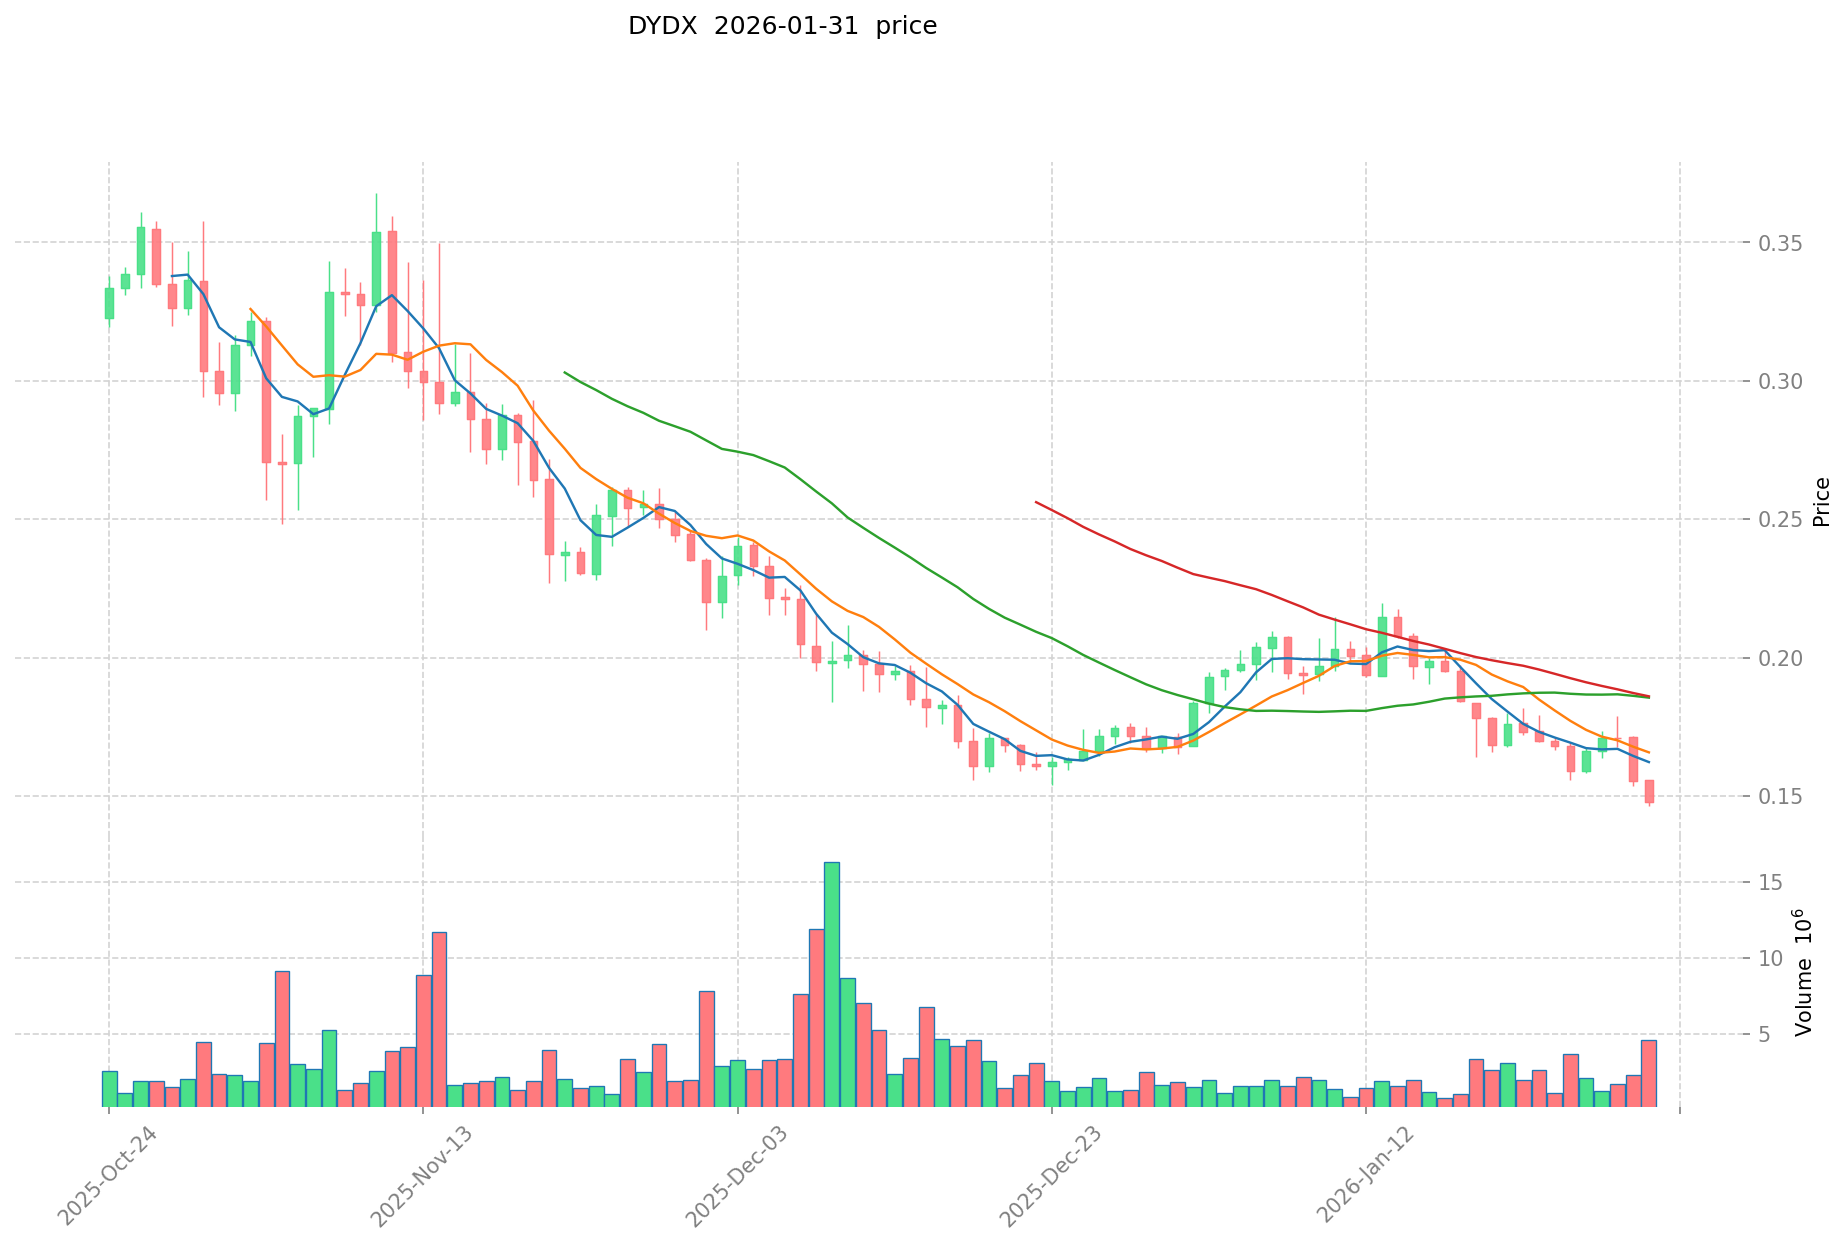
Current Market Status (2026-01-31)
- BTS Current Price: $0.0010592
- DYDX Current Price: $0.1479
- 24-hour Trading Volume: BTS $14,661.78 vs DYDX $702,319.35
- Market Sentiment Index (Fear & Greed Index): 16 (Extreme Fear)
View real-time prices:
II. Core Factors Influencing BTS vs DYDX Investment Value
Tokenomics Comparison
- BTS: Operates with a supply mechanism tied to collateralization for BitShares platform assets, where BTS serves as collateral backing for smart contract-issued assets pegged to real-world currencies (e.g., 1 bitUSD equals 1 USD), managed through automated smart contract execution.
- DYDX: Features a fixed maximum supply of 1 billion tokens with a permanent 2% inflation cap, implementing a token buyback program allocating 25-75% of protocol fees to repurchase tokens, reducing circulating supply over time. As of late 2025, circulating supply stands at approximately 820 million tokens (82% circulation rate).
- 📌 Historical Pattern: DYDX's supply management through buybacks and capped inflation aims to mitigate dilution risks during market volatility, while the token experienced significant fluctuations, reaching $4.52 in March 2024 before declining to approximately $0.126 in October 2025, reflecting broader DeFi sector pressures.
Institutional Adoption and Market Application
- Institutional Positioning: DYDX demonstrates measurable traction with $175-200 million in open interest and daily on-chain trading volumes exceeding $200 million as of Q3 2025, indicating professional trader engagement through advanced derivatives trading features.
- Enterprise Application: DYDX operates as a decentralized exchange specializing in perpetual futures, margin trading, and advanced order types via its dYdX Chain v4 (launched 2023 on Cosmos SDK with CometBFT consensus), serving professional traders with zero gas fees for volumes under $100K and programmatic trading capabilities. BTS historically provided collateralized asset issuance infrastructure within the BitShares platform.
- Regulatory Environment: Material regarding specific national regulatory stances toward BTS and DYDX was not detailed in available sources.
Technology Development and Ecosystem Construction
- BTS Technology: Positioned within early DeFi infrastructure alongside projects like MakerDAO (mainnet launch 2017), with historical context suggesting foundational contributions to decentralized finance development.
- DYDX Technology Evolution: Transitioned from Ethereum Layer 2 (StarkEx ZK-rollups) to its proprietary dYdX Chain v4 on Cosmos SDK to address gas fees and scalability constraints, achieving 25x capital efficiency through partnerships with StarkWare. Recent developments include expansion into spot trading, liquidity incentive programs (Surge Program), and Telegram integration for retail accessibility.
- Ecosystem Comparison: DYDX maintains presence across 20+ trading platforms including MEXC, with 45,361 token holders as of available data. The protocol emphasizes derivatives trading infrastructure—supporting perpetual contracts, off-chain order books with on-chain settlement, and governance mechanisms enabling DYDX holders to vote on protocol parameters, fee structures, and risk management. Staking pools (security and liquidity-focused) distribute proportional rewards, with community treasury (5% initial supply) funding NFT initiatives, hackathons, and governance activities. DYDX ranks approximately 276th by market capitalization, representing 0.0055% of total cryptocurrency market share.
Macroeconomic Conditions and Market Cycles
- Inflation Environment Performance: Specific comparative performance data under inflationary conditions for BTS versus DYDX was not provided in available materials.
- Macroeconomic Monetary Policy: Available materials did not detail specific impacts of interest rates or dollar index movements on BTS and DYDX valuations.
- Geopolitical Factors: The decentralized, non-custodial nature of DYDX's infrastructure may facilitate cross-border derivatives trading access, though explicit geopolitical impact assessments were not documented in referenced sources.
III. 2026-2031 Price Forecast: BTS vs DYDX
Short-term Forecast (2026)
- BTS: Conservative $0.000866 - $0.00106 | Optimistic $0.00106 - $0.00150
- DYDX: Conservative $0.142 - $0.148 | Optimistic $0.148 - $0.198
Medium-term Forecast (2028-2029)
- BTS may enter a gradual accumulation phase, with projected price range of $0.000753 - $0.00187
- DYDX may enter a recovery and expansion phase, with projected price range of $0.107 - $0.238
- Key drivers: institutional capital flows, ETF developments, ecosystem expansion
Long-term Forecast (2030-2031)
- BTS: Baseline scenario $0.00104 - $0.00180 | Optimistic scenario $0.00180 - $0.00218
- DYDX: Baseline scenario $0.125 - $0.245 | Optimistic scenario $0.245 - $0.277
View detailed price predictions for BTS and DYDX
Disclaimer
BTS:
| Year |
Predicted High Price |
Predicted Average Price |
Predicted Low Price |
Price Change |
| 2026 |
0.001499804 |
0.0010562 |
0.000866084 |
0 |
| 2027 |
0.0015336024 |
0.001278002 |
0.0008307013 |
20 |
| 2028 |
0.00154638242 |
0.0014058022 |
0.000787249232 |
32 |
| 2029 |
0.0018746372337 |
0.00147609231 |
0.0007528070781 |
39 |
| 2030 |
0.001926669487627 |
0.00167536477185 |
0.001038726158547 |
58 |
| 2031 |
0.002179230726983 |
0.001801017129738 |
0.001332752676006 |
70 |
DYDX:
| Year |
Predicted High Price |
Predicted Average Price |
Predicted Low Price |
Price Change |
| 2026 |
0.198186 |
0.1479 |
0.141984 |
0 |
| 2027 |
0.20246031 |
0.173043 |
0.12286053 |
16 |
| 2028 |
0.19338420465 |
0.187751655 |
0.1239160923 |
26 |
| 2029 |
0.23820991228125 |
0.190567929825 |
0.106718040702 |
28 |
| 2030 |
0.276561708158531 |
0.214388921053125 |
0.195093918158343 |
44 |
| 2031 |
0.262658586628236 |
0.245475314605828 |
0.125192410448972 |
65 |
IV. Investment Strategy Comparison: BTS vs DYDX
Long-term vs Short-term Investment Strategies
-
BTS: May appeal to investors with extended time horizons interested in early-stage DeFi infrastructure and collateralized asset frameworks, though current trading volumes remain limited. The token's utility within the BitShares platform for governance and transaction fees positions it within specialized decentralized financial applications.
-
DYDX: May suit traders focused on derivatives trading infrastructure and governance participation within a Layer 1 decentralized exchange ecosystem. The protocol's institutional adoption indicators (daily volumes exceeding $200 million, open interest of $175-200 million as of Q3 2025) and token buyback mechanisms suggest alignment with investors monitoring platform growth metrics and fee-sharing models.
Risk Management and Asset Allocation
-
Conservative Investors: A portfolio weighting consideration might allocate 20-30% to DYDX given its measurable trading activity and institutional presence, with 5-10% to BTS for diversification within early DeFi protocols, balanced against 60-75% in established assets or stablecoins.
-
Aggressive Investors: Portfolio construction could consider 40-50% DYDX exposure for participation in derivatives trading growth and governance mechanisms, with 15-25% BTS allocation for higher-risk positioning in foundational infrastructure projects, alongside 25-35% in complementary DeFi assets.
-
Hedging Tools: Risk mitigation approaches include stablecoin allocations (USDT, USDC) for liquidity preservation, derivatives instruments (options, perpetual futures available on platforms supporting DYDX), and cross-asset portfolio construction combining established Layer 1 protocols with specialized DeFi applications.
V. Potential Risks Comparison
Market Risks
-
BTS: Demonstrates substantial liquidity constraints with 24-hour trading volume of $14,661.78 as of current data, exposing holders to execution risks during position adjustments. Historical price volatility ($0.0000032 to $0.923921 range) reflects sensitivity to broader DeFi adoption cycles and platform utilization rates.
-
DYDX: Experienced significant price fluctuations from $4.52 (March 2024) to approximately $0.126 (October 2025), reflecting broader DeFi sector pressures and competitive dynamics within decentralized derivatives markets. The token's correlation with protocol trading volumes and open interest creates exposure to derivatives market cyclicality.
Technical Risks
-
BTS: Operates on the BitShares platform launched in 2014, with network sustainability dependent on continued validator participation and smart contract maintenance. Scalability considerations relate to the platform's capacity to support collateralized asset issuance during periods of network congestion.
-
DYDX: Transitioned from Ethereum Layer 2 infrastructure to proprietary dYdX Chain v4 (Cosmos SDK with CometBFT consensus) in 2023, introducing migration risks and dependency on validator set stability. The off-chain order book with on-chain settlement architecture creates operational complexity requiring continuous infrastructure monitoring.
Regulatory Risks
- BTS and DYDX: Both assets face evolving regulatory frameworks for decentralized finance and derivatives trading platforms across jurisdictions. DYDX's perpetual contract and margin trading functionality may attract increased scrutiny under derivatives regulations in certain markets. BTS's historical positioning within collateralized asset issuance intersects with emerging stablecoin and synthetic asset regulatory developments. Cross-border trading accessibility through decentralized infrastructure does not eliminate potential compliance obligations for users in specific jurisdictions.
VI. Conclusion: Which Is the Better Buy?
📌 Investment Value Summary:
-
BTS Characteristics: Represents early DeFi infrastructure with governance and utility functions within the BitShares platform, offering collateralized asset issuance capabilities. Current market positioning reflects limited liquidity ($14,661.78 daily volume) and specialized application focus.
-
DYDX Characteristics: Demonstrates measurable institutional adoption through $175-200 million open interest and daily on-chain volumes exceeding $200 million. The protocol's transition to dYdX Chain v4, token buyback program (25-75% of fees), and governance mechanisms provide participation in decentralized derivatives trading growth.
✅ Investment Considerations:
-
Entry-level Participants: May prioritize assets with established liquidity, transparent use cases, and educational resources. DYDX's presence across 20+ exchanges and documented trading metrics offers accessibility, while BTS's limited volume presents execution challenges requiring careful position sizing.
-
Experienced Market Participants: Could evaluate DYDX for derivatives infrastructure exposure and governance participation, monitoring protocol fee generation, open interest trends, and validator set stability. BTS positioning may serve specialized portfolio diversification within early-stage DeFi protocols, balanced against liquidity constraints.
-
Institutional Participants: Assessment frameworks might emphasize DYDX's measurable trading activity, programmatic trading capabilities, and capital efficiency metrics (25x through StarkWare partnerships), while evaluating custody solutions, regulatory compliance frameworks, and risk management infrastructure for derivatives-focused allocations.
⚠️ Risk Disclosure: Cryptocurrency markets exhibit substantial volatility. This analysis does not constitute investment advice. Market participants should conduct independent research, assess risk tolerance, and consider professional consultation before allocation decisions.
VII. FAQ
Q1: What is the primary difference between BTS and DYDX in terms of market positioning?
BTS represents early-stage DeFi infrastructure focused on collateralized asset issuance within the BitShares platform (launched 2014), while DYDX operates as a decentralized derivatives exchange with measurable institutional adoption ($175-200 million open interest as of Q3 2025). BTS demonstrates limited liquidity ($14,661.78 daily volume), positioning it within specialized decentralized financial applications requiring extended time horizons. DYDX maintains daily on-chain trading volumes exceeding $200 million and presence across 20+ trading platforms, reflecting its role in derivatives trading infrastructure with professional trader engagement through advanced perpetual contracts, margin trading, and zero gas fees for volumes under $100K.
Q2: How do the tokenomics of BTS and DYDX differ in managing supply inflation?
DYDX implements a fixed maximum supply of 1 billion tokens with a permanent 2% inflation cap and token buyback program allocating 25-75% of protocol fees to repurchase tokens, actively reducing circulating supply (currently ~820 million tokens, 82% circulation rate as of late 2025). BTS operates with a supply mechanism tied to collateralization for BitShares platform assets, where BTS serves as collateral backing for smart contract-issued assets pegged to real-world currencies, managed through automated smart contract execution without explicit buyback mechanisms. DYDX's structured approach aims to mitigate dilution risks during market volatility through measurable supply reduction, while BTS's supply dynamics directly correlate with platform collateralization requirements.
Q3: What are the key technical infrastructure differences between BTS and DYDX?
BTS operates on the BitShares platform launched in 2014, providing foundational DeFi infrastructure for collateralized asset issuance through industrial-grade financial smart contracts. DYDX transitioned from Ethereum Layer 2 (StarkEx ZK-rollups) to its proprietary dYdX Chain v4 on Cosmos SDK with CometBFT consensus in 2023, addressing gas fees and scalability constraints while achieving 25x capital efficiency through StarkWare partnerships. The dYdX infrastructure features off-chain order books with on-chain settlement, supporting perpetual contracts, margin trading, and programmatic trading capabilities with governance mechanisms enabling DYDX holders to vote on protocol parameters, fee structures, and risk management—representing a distinct evolution from BTS's foundational smart contract architecture.
Q4: Which asset demonstrates stronger liquidity metrics for active trading?
DYDX exhibits substantially stronger liquidity with 24-hour trading volume of $702,319.35 compared to BTS's $14,661.78 as of current data. DYDX maintains daily on-chain trading volumes exceeding $200 million and open interest of $175-200 million, indicating professional trader engagement and institutional adoption. BTS's limited trading volume exposes holders to execution risks during position adjustments, requiring careful position sizing and extended order fulfillment timeframes. For market participants prioritizing active portfolio management, derivatives hedging strategies, or frequent rebalancing, DYDX's liquidity profile supports more efficient execution, while BTS's volume constraints suggest suitability primarily for long-term positioning within specialized DeFi infrastructure allocations.
Q5: What are the projected price trajectories for BTS and DYDX through 2031?
BTS projections indicate conservative 2026 range of $0.000866-$0.00106, expanding to $0.00104-$0.00180 baseline scenario by 2030-2031, with optimistic scenarios reaching $0.00218 in 2031 (representing potential 70% change from baseline). DYDX forecasts show conservative 2026 range of $0.142-$0.148, progressing to $0.125-$0.245 baseline scenario by 2030-2031, with optimistic projections reaching $0.277 in 2031 (representing potential 65% change from baseline). These trajectories reflect different growth drivers: BTS positioning within gradual accumulation phases tied to specialized DeFi infrastructure adoption, versus DYDX's correlation with derivatives trading infrastructure expansion, institutional capital flows, and protocol fee generation metrics. Both assets remain subject to macroeconomic conditions, regulatory developments, and competitive dynamics within their respective market segments.
Q6: How should investors evaluate risk exposure between BTS and DYDX?
BTS carries substantial liquidity risk ($14,661.78 daily volume) creating execution challenges, combined with historical price volatility ($0.0000032 to $0.923921 range) reflecting sensitivity to DeFi adoption cycles and platform utilization rates. DYDX demonstrates price fluctuation risks evidenced by movement from $4.52 (March 2024) to approximately $0.126 (October 2025), creating exposure to derivatives market cyclicality and protocol trading volume correlation. Technical risks include BTS's dependency on BitShares validator participation and smart contract maintenance since 2014, versus DYDX's operational complexity from off-chain order book architecture and validator set stability following its 2023 migration to dYdX Chain v4. Both assets face evolving regulatory frameworks for decentralized derivatives and collateralized asset issuance across jurisdictions. Risk mitigation approaches include conservative position sizing (20-30% DYDX, 5-10% BTS for balanced portfolios), stablecoin hedging, derivatives instruments, and continuous monitoring of protocol metrics, validator performance, and regulatory developments.
Q7: What allocation strategy aligns with different investor profiles for BTS versus DYDX?
Conservative investors might consider 20-30% DYDX allocation given measurable trading activity ($200M+ daily volumes) and institutional presence, with 5-10% BTS for diversification within early DeFi protocols, balanced against 60-75% in established assets or stablecoins for capital preservation. Aggressive investors could evaluate 40-50% DYDX exposure for derivatives infrastructure growth participation and governance mechanisms, with 15-25% BTS positioning for higher-risk exposure to foundational protocols, alongside 25-35% in complementary DeFi assets. Entry-level participants may prioritize DYDX's accessibility across 20+ exchanges and documented trading metrics over BTS's limited liquidity requiring specialized execution strategies. Institutional participants should assess DYDX's programmatic trading capabilities, capital efficiency metrics (25x through partnerships), custody solutions, and regulatory compliance frameworks, while evaluating BTS within specialized infrastructure allocations balanced against execution constraints and time horizon requirements.
Q8: What factors should investors monitor when tracking BTS and DYDX performance?
For DYDX, critical metrics include daily trading volumes (baseline $200M+), open interest fluctuations ($175-200M range), protocol fee generation supporting token buybacks (25-75% allocation), validator set stability on dYdX Chain v4, circulating supply changes (currently ~820M tokens), and governance proposal activity affecting protocol parameters. BTS monitoring should focus on BitShares platform utilization rates, collateralization ratios for smart contract-issued assets, validator participation levels, liquidity depth across trading venues, and adoption indicators for decentralized asset issuance applications. Both assets require tracking of macroeconomic conditions (inflation environment, institutional capital flows, ETF developments), regulatory announcements affecting decentralized derivatives and collateralized assets, competitive dynamics within DeFi sectors, and technological developments (network upgrades, security audits, ecosystem integrations). Market sentiment indicators (Fear & Greed Index currently at 16/Extreme Fear) provide context for risk-adjusted positioning, while correlation analysis with broader cryptocurrency market cycles informs portfolio rebalancing decisions.
* The information is not intended to be and does not constitute financial advice or any other recommendation of any sort offered or endorsed by Gate.