This comprehensive guide explains bullish and bearish market sentiments, essential concepts for cryptocurrency traders and investors. Bullish markets feature rising prices, strong investor confidence, and increased trading volume, while bearish markets show declining prices and negative sentiment. The article covers key characteristics of both market conditions, practical trading strategies including technical analysis, profit-taking, and dollar-cost averaging, and recognizable chart patterns such as hammers, engulfing patterns, and morning/evening stars. You'll learn how to identify market direction, adapt your strategies on Gate exchange, and manage risk effectively across market cycles. Whether you're analyzing Bitcoin, Ethereum, or other digital assets, understanding these fundamental concepts and sentiment indicators equips you with the knowledge needed to make informed trading decisions and improve long-term investment outcomes in the dynamic cryptocurrency landscape.
Summary
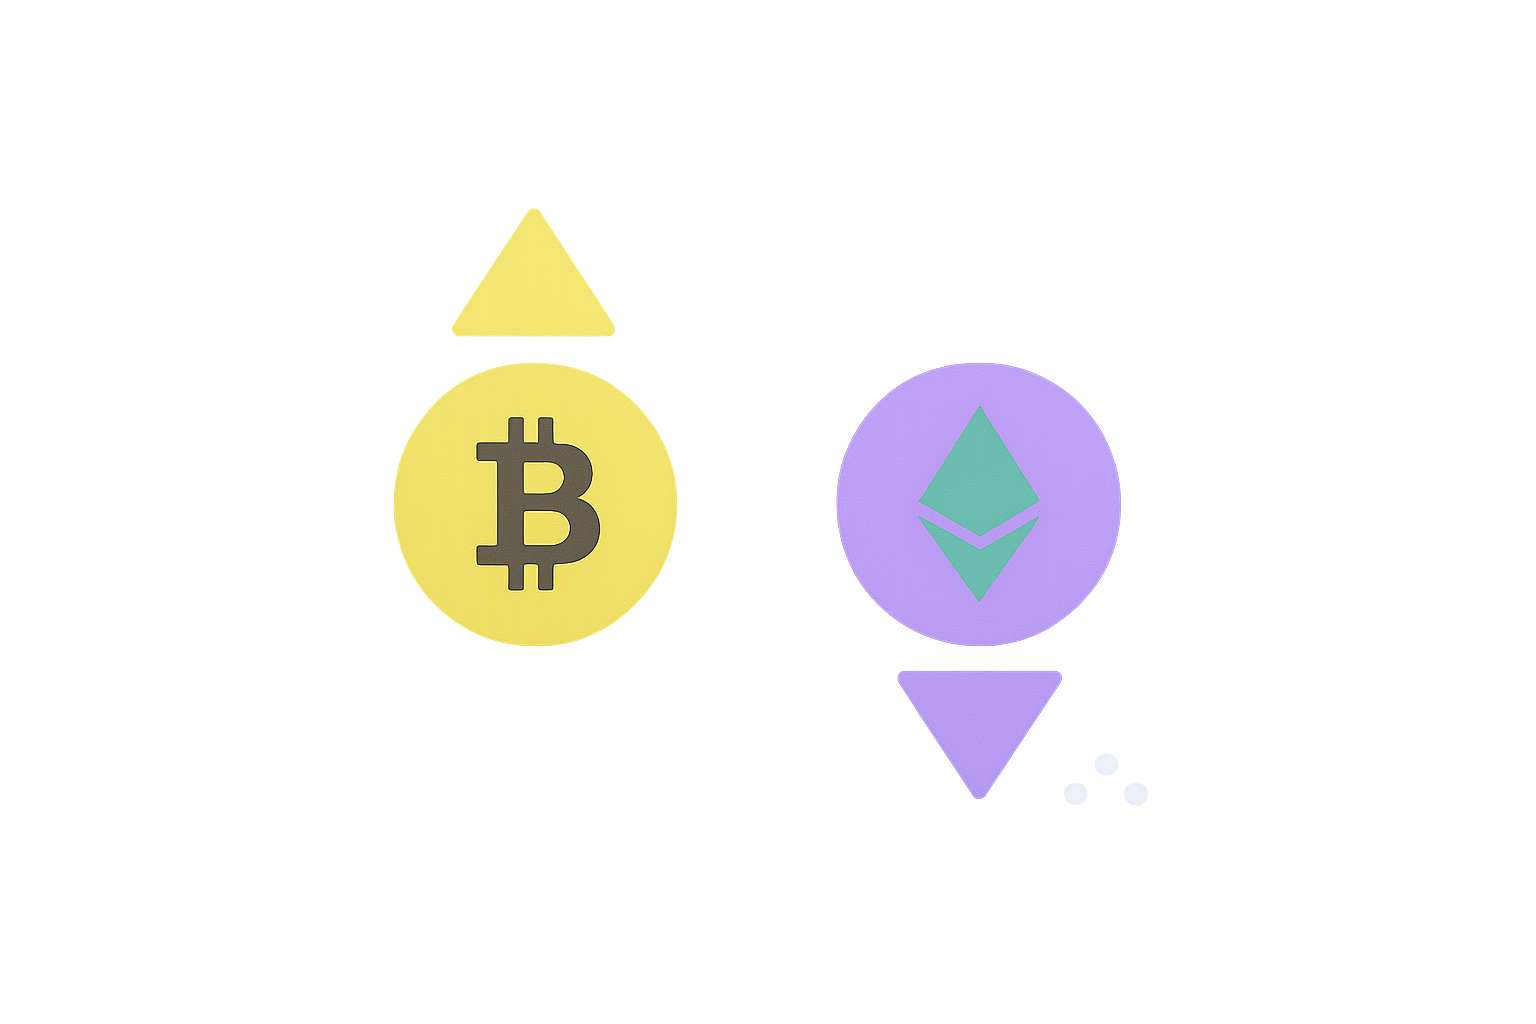
Understanding the difference between bullish and bearish markets is fundamental for any cryptocurrency trader or investor. These two terms represent opposing market sentiments and price movements that shape trading strategies and investment decisions.
-
A Bullish Market: Going long on or buying an asset is a bullish action that a trader can take. Being a bull or having a bullish attitude stems from the belief that an asset's price will rise in value. A bull market is when a coin's price is rising – called an uptrend. Bulls are optimistic investors who expect prices to continue climbing, often driven by positive news, strong fundamentals, or favorable market conditions.
-
A Bearish Market: Being bearish is the exact opposite of being bullish – it's the belief that an asset's price will fall. A bear market is when a coin's price is falling – called a downtrend. Bears are pessimistic investors who anticipate price declines, typically influenced by negative sentiment, weak economic indicators, or unfavorable market dynamics.
The cryptocurrency market has its own language, but a fair amount of the terminology comes from traditional finance markets. If you're just starting to trade, terms like bullish and bearish are ones you'll hear frequently. These terms are important for effectively describing market conditions when communicating with other crypto traders. Having a clear understanding of these terms makes it easier to figure out the direction of the market and make informed trading decisions. Whether you're analyzing Bitcoin, Ethereum, or any other digital asset, recognizing bullish and bearish signals is crucial for success.
What Does Bull Or Bullish Mean?
The term "bull" or "bullish" comes from the bull, who charges upward with its horns, "thrusting asset prices up." This vivid imagery perfectly captures the aggressive upward momentum characteristic of bullish markets. Going long on or buying an asset is a bullish action that a trader can take, reflecting confidence in future price appreciation.
Being a bull or having a bullish attitude stems from the belief that an asset's price will rise in value. To say "he's bullish on Bitcoin," for example, means that the individual believes the price of Bitcoin will increase over a certain timeframe. This belief may be based on technical analysis, fundamental research, market trends, or a combination of factors.
Being a bull can represent an opinion or action. Someone who is bullish may go long on the assets they are bullish on – or, they may just have an opinion that the asset price will rise but decide against making any trades. For instance, a trader might be bullish on Ethereum's long-term prospects but choose to wait for a better entry point before purchasing. Bullish stances can be specific opinions about a particular cryptocurrency, or they can be broad opinions about the overall market. A trader might be bullish on the entire crypto market while being bearish on specific altcoins, demonstrating the nuanced nature of market sentiment.
What Is A Bull Market?
A bull market is when a coin's price is rising – called an uptrend – typically over a sustained period, such as months or years. During a bull market, investor confidence is high, trading volumes increase, and new participants often enter the market. Bullish, bull, and long are often used interchangeably in trading conversations. Instead of saying "I'm long on that coin," a trader may say, "I'm bullish on that coin." Both indicate the person believes prices will rise.
Bull markets are characterized by several key features: consistent higher highs and higher lows in price charts, increased media coverage and public interest, growing adoption and development activity, and a general sense of optimism among investors. These markets can create significant wealth for early investors but also attract speculative behavior and potential bubbles. Understanding when a bull market is beginning or ending is crucial for maximizing returns and managing risk effectively.
What Does Bear Or Bearish Mean?
The term "bear" or "bearish" comes from the bear, who strikes downward with its paws, "pushing asset prices down." This imagery represents the forceful downward pressure that characterizes bearish markets. Being bearish is the exact opposite of being bullish – it's the belief that an asset's price will fall. To say "he's bearish on XRP" means the individual believes the price of XRP will decline in value over a given period. Bearish stances can be specific opinions about a particular cryptocurrency, or they can be broad opinions about the overall market.
Like bullish opinions, a person may hold bearish beliefs about a specific project or cryptocurrency in general. A trader with bearish beliefs may choose to act on the opinions or not. If the trader does act, they may sell the coins they currently own or go short, profiting from price declines. Bearish sentiment often arises from negative news, regulatory concerns, technical breakdowns, or broader economic uncertainty. Recognizing bearish signals early can help traders protect their capital and even profit from falling prices through short positions or put options.
What Is A Bear Market?
A bear market is when a coin's price is falling – called a downtrend – typically over months or years. During a bear market, investor confidence is low, trading volumes often decrease, and many participants exit the market. Bearish, bear, and short are often used interchangeably in trading discussions. Instead of saying "I'm short on that coin," a trader may say, "I'm bearish on that coin." Both indicate the person believes prices will fall.
Bear markets are characterized by sustained price declines, lower highs and lower lows on price charts, negative sentiment and fear among investors, reduced media attention, and decreased development activity. While bear markets can be challenging for long-term holders, they also present opportunities for strategic accumulation at lower prices. Experienced traders often use bear markets to build positions in quality projects at discounted valuations, positioning themselves for the next bull market cycle.
What's The Difference Between Bearish And Bullish?
The key difference between bullish and bearish is that bulls believe prices will rise while bears believe prices will fall. While bulls are optimistic and believe an asset is undervalued, bears are pessimistic and see the same asset as overpriced. When a bull market happens, it's because the overall market conditions support price increases, such as positive news flow, strong fundamentals, and growing adoption. When a bear market happens, prices fall across the board as negative sentiment pushes down demand, often triggered by regulatory crackdowns, security breaches, or macroeconomic headwinds.
Below's an overview of the key differences between bullish and bearish markets:
| Differentiating Factors |
Bull Market |
Bear Market |
| Supply & Demand |
High demand, weak supply |
Low demand, high supply |
| Growth |
High GDP |
Low GDP |
| Economy |
Strong economy, more trading |
Weak economy, less trading |
| Sentiment |
High confidence |
Low confidence |
| Investment Principle |
Sell high |
Buy low |
| Prices |
Sustained highs |
Sustained lows |
| Liquidity |
High liquidity |
Low liquidity |
| Employment |
Low unemployment rate |
High unemployment rate |
This table illustrates how bull and bear markets differ across multiple dimensions, from supply and demand dynamics to broader economic indicators. Understanding these differences helps traders adapt their strategies to prevailing market conditions and make more informed decisions.
How To Trade In A Bullish vs Bearish Market?
Trading In A Bullish Market
Trading in a bullish market requires a different approach than trading in a bearish market. Here are key strategies for capitalizing on upward price movements:
1. Watch Technical Indicators
Technical indicators give you an indication of the direction an asset is moving. If you're trading in a bullish market, you'll want to look for indicators that signal the start or continuation of an uptrend. Some common technical indicators used by traders are moving averages (such as the 50-day and 200-day moving averages), support and resistance levels, and trend lines. When the price consistently stays above key moving averages and breaks through resistance levels, these are strong bullish signals. Additionally, indicators like the Relative Strength Index (RSI) and Moving Average Convergence Divergence (MACD) can help identify momentum and potential entry points during bullish trends.
2. Buy Early
In a bull market, it's generally best to start buying early before prices rise too high. Moreover, don't get too caught up in FOMO (Fear Of Missing Out). If you wait too long, you may end up buying at the top just before a correction. The key is to identify the early stages of a bull market through technical analysis and fundamental research. Look for assets with strong fundamentals, growing adoption, and positive price action. Dollar-cost averaging can also be an effective strategy, allowing you to build positions gradually without trying to time the perfect entry point.
3. Take Profits
Sell limit orders are your friend in a bull market. By setting sell limit orders at predetermined prices, you can take profits along the way as the market rises. As a bullish investor, this will help you lock in some gains and prevent you from selling at a loss if the market starts to reverse. Consider using a tiered profit-taking strategy, selling portions of your position at different price levels. This approach allows you to capture gains while maintaining exposure to potential further upside. Remember, no one ever went broke taking profits, and securing gains during a bull market is essential for long-term success.
Trading In A Bearish Market
Bearish markets present unique challenges and opportunities. Here are strategies for navigating downward price movements:
1. Get Away From The Charts
When the market is volatile, FUD (Fear, Uncertainty, and Doubt) creeps in. Constantly watching price charts during a bear market can lead to emotional decision-making and panic selling. Sometimes the best strategy is to step back, avoid checking prices obsessively, and focus on long-term fundamentals. If you've invested in quality projects with strong use cases and development teams, short-term price fluctuations shouldn't shake your conviction. Use bear markets as a time to educate yourself, research new projects, and prepare for the next bull market cycle.
2. Dollar Cost Averaging
DCA is an investing strategy where you spread your investment into equal parts and purchase at regular intervals. In a bear market, this strategy can help you average out your entry price and reduce your overall risk. For example, instead of investing a lump sum all at once, you might invest the same amount weekly or monthly regardless of price. This approach removes the pressure of trying to time the bottom and allows you to accumulate assets at various price points. Over time, DCA can result in a lower average cost basis compared to attempting to catch falling knives.
3. Focus Long-Term
If you're investing for the long-term, don't let the day-to-day fluctuations discourage you. Bear markets are temporary, and historically, crypto markets have recovered and reached new highs after every major downturn. Use bearish periods to reassess your portfolio, eliminate weak positions, and accumulate quality assets at discounted prices. Remember that the most successful investors maintain discipline and conviction during difficult market conditions. Bear markets separate short-term speculators from long-term investors, and those who can weather the storm often reap the greatest rewards.
What Are Some Bullish vs Bearish Patterns?
Recognizing chart patterns is essential for identifying potential trend reversals and continuations. Here are key bullish and bearish patterns every trader should know:
Bullish Patterns
Bullish patterns signal potential upward price movements and can indicate the end of a downtrend or continuation of an uptrend.
1. The Hammer (Inverted Hammer)
The hammer is a bullish reversal pattern that can signal a downtrend's end. The pattern is created when the market makes a new low, followed by a strong rally. The rally should be strong enough to push prices above the previous day's high. The hammer candlestick has a small body near the top of the candlestick range with a long lower shadow, indicating that sellers pushed prices down but buyers regained control and pushed prices back up.
The inverted hammer is a variation of the hammer pattern that happens at the end of an uptrend. The market makes a new high, followed by a sharp sell-off. The sell-off is then followed by a small rally, which should not exceed the previous day's high. This pattern suggests that buyers are beginning to gain strength even though sellers initially pushed prices down.
This is created when a small bearish candlestick is followed by a large bullish candlestick that completely engulfs the previous day's body. The pattern can signal the end of a downtrend and the beginning of an uptrend. The bullish engulfing pattern demonstrates a shift in momentum from sellers to buyers, with the large bullish candle showing strong buying pressure that overwhelms the previous selling pressure. This pattern is most reliable when it appears after a sustained downtrend and is accompanied by high trading volume.
3. The Piercing Line Pattern
This is created when the market is in a downtrend and prices make a new low. This is then followed by a strong rally that pushes prices above the midpoint of the previous day's candlestick. The pattern can signal the end of a downtrend and the beginning of an uptrend. The piercing line shows that buyers are stepping in at lower prices and beginning to push back against the bearish momentum. The deeper the penetration into the previous bearish candle, the more significant the bullish signal.
4. The Morning Star Pattern
This is created when the market is in a downtrend and prices make a new low. This is then followed by a small bullish candlestick (or doji), which is then followed by a large bullish candlestick. The pattern can signal the end of a downtrend and the beginning of an uptrend. The morning star is a three-candle pattern that represents a transition from bearish to bullish sentiment. The small middle candle indicates indecision, while the large bullish candle confirms that buyers have taken control. This pattern is particularly powerful when the third candle closes above the midpoint of the first bearish candle.
Bearish Patterns
Bearish patterns signal potential downward price movements and can indicate the end of an uptrend or continuation of a downtrend.
1. The Hanging Man Pattern
This is created when the market is in an uptrend and prices make a new high. This is then followed by a sharp sell-off that creates a long bearish candlestick with a small body near the top and a long lower shadow. The pattern can signal the end of an uptrend and the beginning of a downtrend. The hanging man suggests that sellers are beginning to gain strength and that the bullish momentum may be waning. This pattern is most reliable when it appears after a sustained uptrend and is confirmed by subsequent bearish price action.
2. Dark Cloud Cover
This pattern is created when the market is in an uptrend and prices make a new high. This is then followed by a large bearish candlestick that opens above the previous day's close but closes near the middle of the previous day's candlestick body. The dark cloud cover indicates that sellers are stepping in at higher prices and beginning to push back against the bullish momentum. The pattern is more significant when the bearish candle closes below the 50% level of the previous bullish candle and when it occurs after an extended uptrend.
3. Evening Star Pattern
This pattern is created when the market is in an uptrend and prices make a new high. This is then followed by a small bearish candlestick (or doji), which is then followed by a large bearish candlestick. The evening star is a three-candle bearish reversal pattern that mirrors the morning star. It represents a transition from bullish to bearish sentiment, with the small middle candle showing indecision and the large bearish candle confirming that sellers have taken control. This pattern is particularly powerful when the third candle closes below the midpoint of the first bullish candle and when it appears after a strong uptrend.
The Bottom Line
No matter which coin you are trading, if you are taking part in any conversation about the state of the markets you will hear terms "bullish" and "bearish" being used frequently. Hopefully, you now have a greater understanding of what they mean and will be able to work them into a conversation and impress your non-crypto friends.
Understanding bullish and bearish markets is fundamental to successful cryptocurrency trading and investing. These concepts go beyond simple price direction – they encompass market sentiment, economic conditions, trading psychology, and technical patterns. By recognizing the characteristics of bull and bear markets, adapting your strategies accordingly, and identifying key chart patterns, you can make more informed decisions and improve your trading outcomes.
Remember that markets are cyclical, and both bullish and bearish periods are natural parts of the market cycle. The key to long-term success is maintaining discipline, managing risk, and continuously learning from market experiences. Whether you're a bull or a bear, understanding both perspectives will make you a more well-rounded and successful trader in the dynamic world of cryptocurrency.
FAQ
What is a bullish market and what are its main characteristics?
A bullish market occurs when prices rise and investor confidence grows. Main characteristics include increasing trading volume, upward price trends, strong economic outlook, and positive market sentiment driving widespread buying activity.
What is a bearish market and how does it differ from a bullish market?
A bearish market has falling prices with negative sentiment, while a bullish market features rising prices with positive sentiment. The key difference is price direction and market momentum.
How can investors identify whether a market is bullish or bearish?
Investors identify bullish markets when prices trade above the 200-day moving average with rising trading volume and positive sentiment. Bearish markets show prices below the 200-day moving average, declining volume, and negative news flow.
What investment strategies should I use in a bullish market versus a bearish market?
In bullish markets, employ buy-and-hold strategies to maximize gains. In bearish markets, use dollar-cost averaging and portfolio rebalancing to reduce risk and optimize entry points.
What are some historical examples of major bull markets and bear markets?
Major bull markets include the post-WWII boom (1945-1970s) and the tech boom (1995-2000). Notable bear markets include the Dot-Com Bubble Burst (2000-2002) with S&P 500 falling 49%, and the 2008 financial crisis.
How do bullish and bearish sentiments affect stock prices and investor behavior?
Bullish sentiment drives prices higher and encourages buying activity, while bearish sentiment pushes prices lower and triggers selling. Investors respond to these sentiments through trading volume and market positioning decisions.
Can a stock be bullish while the overall market is bearish, or vice versa?
Yes, absolutely. Individual assets can move independently from the broader market. A stock can experience upward momentum and show bullish signals even during a bearish market downturn, and vice versa. This divergence occurs due to varying fundamentals, sector performance, and investor sentiment toward specific assets.
What technical indicators help determine if a market is bullish or bearish?
Moving averages, RSI, and MACD are key indicators. Prices above moving averages signal bullish trends, while below indicates bearish. RSI identifies overbought/oversold conditions, and MACD confirms momentum direction and potential reversals.
* The information is not intended to be and does not constitute financial advice or any other recommendation of any sort offered or endorsed by Gate.