This comprehensive guide decodes buy walls and sell walls—critical yet frequently manipulated indicators in cryptocurrency markets. Buy walls represent large purchase order clusters at specific price levels, while sell walls concentrate massive sell orders, both significantly influencing short-term price dynamics. The article explores how whales exploit these structures through spoofing and manipulation tactics, emphasizing that distinguishing genuine market interest from artificial constructions requires analyzing market depth and liquidity context. Readers learn to identify walls using order books and depth charts on platforms like Gate, recognizing that high-liquidity markets like BTC/USDT show limited wall impact, whereas low-liquidity altcoins remain vulnerable. Critical insights include psychological barriers driving wall effectiveness and the danger of basing trading decisions solely on walls. The guide concludes that successful traders must integrate walls with comprehensive risk management, technical
Key Points
Buy walls and sell walls are crucial indicators in cryptocurrency markets, yet they are also frequently used as manipulation tools that can distort technical analysis. Buy walls represent large purchase orders concentrated at specific price levels, while sell walls consist of massive accumulations of sell orders. These walls typically mark support and resistance zones, significantly influencing short-term price behavior. Whales—investors holding substantial amounts of assets—often exploit these walls to manipulate market sentiment through strategies like spoofing. Understanding market depth and liquidity context is essential for distinguishing between legitimate walls and artificial manipulation setups. In low-liquidity markets, a single wall can dramatically move prices, whereas in large markets like BTC/USDT, their impact is limited. Traders should use walls as guidance rather than sole trading signals, always accompanied by proper risk management and comprehensive analysis.
Summary
A buy wall refers to a massive buy order, or an accumulation of buy orders, positioned at a specific price level. This concentration of buying interest creates a visible barrier on depth charts and order books.
A sell wall represents a massive sell order, or accumulation of sell orders, located at a particular price point. These walls appear as significant resistance levels where selling pressure concentrates.
Both buy walls and sell walls can be manipulated by whales—traders who control large portions of available cryptocurrency or stock supply. Understanding this manipulation potential is crucial for making informed trading decisions in volatile markets.
In the cryptocurrency trading world, order books frequently display patterns of buying and selling pressure. Two prominent phenomena are buy walls and sell walls. A buy wall manifests as a large cluster of buy orders at a certain price level, while a sell wall appears as a substantial accumulation of sell orders at a specific price point. These walls are clearly visible in market depth charts and order books, and they can significantly influence short-term price movements. Comprehending the dynamics of buy walls and sell walls enables traders to identify potential key support or resistance levels, providing valuable insights for trading strategies.
What Is a Wall in Crypto?
Experienced traders are familiar with buy walls and sell walls, which are identified as price points where large volumes of buy or sell orders respectively accumulate. Visually, when these order volumes are plotted against different price levels on a chart, they form what appears to be a "wall" due to their substantial size.
Buy walls and sell walls can substantially influence price fluctuations in both cryptocurrency and stock markets. However, understanding the true motivation behind these walls is crucial, as they sometimes represent market manipulation rather than genuine participant sentiment. The presence of a wall doesn't always indicate real buying or selling interest—it may be a strategic placement designed to influence other traders' behavior.
These walls serve multiple purposes: they can act as psychological barriers, influence trader decision-making, and sometimes function as tools for price manipulation by large holders. Recognizing the difference between authentic market interest and manipulative tactics is an essential skill for successful crypto trading.
What Is a Buy Wall?
A buy wall is characterized by a massive buy order, or accumulation of multiple buy orders, concentrated at a specific price level. The total volume is so substantial that if these orders execute completely, the asset's price will tend to rise. In fact, the mere presence of a buy wall often drives the price upward even before the orders execute, as market participants perceive that the asset's available supply will decrease significantly once that price level is reached.
Buy walls create a psychological effect on the market. When traders observe a large buy wall, they interpret it as strong demand at that price level, which generates confidence and can trigger additional buying activity. This self-reinforcing mechanism can amplify the wall's impact beyond its actual order volume. The anticipation of price appreciation after the wall is filled often leads traders to position themselves ahead of the wall, further contributing to upward price pressure.
How to Identify Buy Walls
Many traders strategically place their buy orders even above the buy wall, attempting to secure acquisition of the cryptocurrency or stock and anticipate profits before available assets are depleted. This behavior can cause the price to rise even further, creating a cascading effect of buying pressure.
However, it's important to recognize that buy walls frequently don't reflect genuine market sentiment. Small walls often appear at round numbers due to psychological preferences—traders naturally gravitate toward placing orders at prices like $10,000 or $50,000 rather than $9,847 or $49,523. These psychologically-driven walls may not represent significant support levels.
Buy walls can also be artificially created for manipulation purposes. Since buy orders are dynamic—they can be added or removed at any moment—these walls can serve as market manipulation maneuvers. A whale might place a large buy wall to create the impression of strong support, encouraging other traders to buy, then suddenly remove the wall once the price rises, leaving late buyers exposed to potential losses.
What Is a Sell Wall?
A sell wall is the opposite of a buy wall. It refers to a massive sell order, or accumulation of sell orders, positioned at a specific price level. This concentration of selling interest creates a visible barrier that can significantly impact price movement.
A sell wall can cause a cryptocurrency's price to decline. This occurs because it signals a sudden increase in supply at that price point, creating an imbalance with demand and pushing the price downward. The psychological impact of seeing a large sell wall can also discourage buyers, as they anticipate difficulty in pushing the price above that resistance level.
Sell walls function as psychological resistance zones. When traders observe a massive sell wall, they may hesitate to buy, fearing that the price will struggle to break through that level. This hesitation can become a self-fulfilling prophecy, as reduced buying pressure makes it even more difficult for the price to overcome the wall.
How to Identify Sell Walls
Traders who want to sell understand that if they place their orders above a sell wall, execution is unlikely. Therefore, they anticipate this situation and position their sell orders below the wall. This behavior causes the price to decline further, as more traders place their sell orders beneath the wall, creating additional downward pressure.
This cascading effect demonstrates how sell walls can amplify selling pressure beyond their actual order volume. The psychological impact of a sell wall extends beyond the specific price level where it's positioned, influencing trader behavior across multiple price points.
However, like buy walls, sell walls can be manipulated by whales—traders who control large volumes of the asset. A whale might place a substantial sell wall to create the impression of strong resistance, discouraging buyers and potentially driving the price down. Once the price declines to their target level, the whale can remove the sell wall and accumulate the asset at a lower price, having successfully manipulated other traders' behavior.
Psychology of Buy Walls and Sell Walls
Buy walls and sell walls exert strong influence on market psychology and can be intentionally used to modify participant sentiment. A large buy wall typically generates bullish confidence, leading traders to purchase above it in anticipation of price appreciation. Conversely, a massive sell wall tends to discourage buying activity, creating psychological resistance to upward price movement.
Whales understand these psychological effects and manipulate market perception accordingly. They can create a buy wall to inflate price expectations and suddenly remove it, or establish a sell wall to intimidate buyers before accumulating assets at lower prices. This manipulation of the order book, known as spoofing, is particularly common in low-liquidity markets where a single large order can significantly impact price.
Spoofing involves placing large orders with no intention of executing them—the goal is purely to influence other traders' perceptions and decisions. This practice, while prohibited in regulated markets, remains prevalent in cryptocurrency trading due to limited oversight and enforcement.
Additionally, human psychology influences order placement at round numbers, generating "mini-walls" that may not reflect genuine support or resistance levels. Traders naturally prefer placing orders at psychologically significant prices, creating clusters of orders that appear as walls but lack substantial conviction behind them. Understanding this psychological tendency helps traders distinguish between meaningful walls and those driven merely by price aesthetics.
How to Identify Buy Walls and Sell Walls
What Is an Order Book?
To identify buy walls and sell walls on a cryptocurrency exchange, you must first understand how to read an order book. An order book is an electronic list of buy and sell orders for a specific asset or financial instrument, organized by price level. The book displays the number of units offered or demanded at each price point, providing a real-time snapshot of market supply and demand.
The order book is dynamic and updates in real-time as traders add, modify, or cancel orders. This constant flux means that the market landscape can change rapidly, and walls can appear or disappear within seconds.
In any order book, you'll encounter the terms "bid" and "ask": a bid represents a buy order, while an ask represents a sell order. The bid side shows prices at which buyers are willing to purchase, while the ask side displays prices at which sellers are willing to sell.
When the price of a bid and an ask match, the exchange executes the transaction. The continuous repetition of this matching process influences the asset's price. If buy orders consistently match with higher ask prices, the price rises; if sell orders match with lower bid prices, the price falls.
While order books are designed to help traders make better decisions, the information can be distorted by large players seeking to manipulate market sentiment. Understanding this potential for manipulation is essential for interpreting order book data accurately.
How Do I Read a Depth Chart to Identify Buy Walls and Sell Walls?
A depth chart visually represents a cryptocurrency's supply and demand in real-time across different price levels. It's a graphical representation of what's occurring in the order book, making it easier to quickly identify significant walls and assess market depth.
A depth chart contains several key elements that traders must understand:
Bid Line (Buy Orders Line): This line shows the cumulative value of buy orders or demand, typically plotted with a green line on the left side of the chart. The line slopes upward as you move left (toward lower prices), indicating that more buyers are willing to purchase at lower price points.
Ask Line (Sell Orders Line): This line indicates the cumulative value of sell orders or supply, visualized with a red line on the right side of the chart. The line slopes upward as you move right (toward higher prices), showing that more sellers are willing to sell at higher price points.
X-Axis: This axis represents the different price levels where buy and sell orders are placed, normally expressed in dollars or the quote currency. The current market price is typically located where the bid and ask lines meet.
Y-Axis: This axis refers to the quantity of the asset or pending trades at each level, for example, the number of bitcoins. A higher value on this axis indicates greater order volume at that price point.
On most platforms, you can hover your mouse over the buy or sell line to quickly view how many orders exist at each price level. This interactive feature allows for detailed analysis of specific price points.
When identifying walls, you'll observe very steep vertical lines similar to stair steps. These sudden increases in cumulative volume indicate the presence of significant buy or sell walls. A true wall appears as a nearly vertical segment on the depth chart, representing a large concentration of orders at a specific price level.
What Is a Whale Wall?
What Is a Whale and How Do They Manipulate the Order Book?
A whale is a person or entity that possesses large quantities of a cryptocurrency or asset. This substantial holding grants them disproportionate power to influence market price through their actions. Whales can single-handedly create or remove significant walls, manipulating market sentiment and price direction.
Some examples of Bitcoin whales include founder Satoshi Nakamoto, the Winklevoss twins (founders of Gemini exchange), and corporate holders like Tesla. If Tesla were to sell all its Bitcoin holdings, the price would drop dramatically due to the sudden excess supply injected into the market.
These types of movements also influence public sentiment regarding the asset's viability and potential, often triggering cascading sell-offs as other traders panic. The psychological impact of whale movements can amplify their direct market effect, as smaller traders react emotionally to large transactions.
For this reason, many large buy or sell walls are artificial constructions. Whales can create walls simply by placing numerous massive orders, thereby influencing sentiment and manipulating prices in their favor. They might establish a buy wall to prevent price decline while they accumulate, or create a sell wall to suppress price while they distribute their holdings.
Therefore, you shouldn't always interpret a buy or sell wall as reflecting genuine market sentiment. It's unwise to base your trading decisions solely on these levels without considering broader market context and potential manipulation.
How to Know If the Crypto Market Is Being Manipulated
Distinguishing whether a wall is genuine or part of a whale's strategy can be challenging, but several indicators can help you assess the situation.
Is the Buy or Sell Wall Real?
One evaluation method is monitoring recent cryptocurrency news and social sentiment. If large walls appear without corresponding notable changes in sentiment on social media or news outlets, it may indicate manipulation. Genuine market movements typically correlate with fundamental news, technical developments, or broader market trends.
For example, if a massive buy wall suddenly appears for a cryptocurrency with no recent positive news, partnerships, or technical upgrades, it's likely an artificial construction designed to manipulate price. Conversely, if a sell wall emerges following negative news about security breaches or regulatory concerns, it more likely reflects genuine selling pressure.
How to Use Market Depth to Evaluate a Wall
Market depth refers to the liquidity of an asset's market, based on the quantity of open buy and sell orders at different levels. Analyzing market depth provides crucial context for evaluating whether a wall is significant or merely a manipulation attempt.
If market depth is high—meaning large volumes of both buy and sell orders exist across multiple price levels—it will be much more difficult for a single order to manipulate price, as there's substantial "cushion" absorbing the impact. In such markets, individual walls carry less real weight and can often be disregarded as noise.
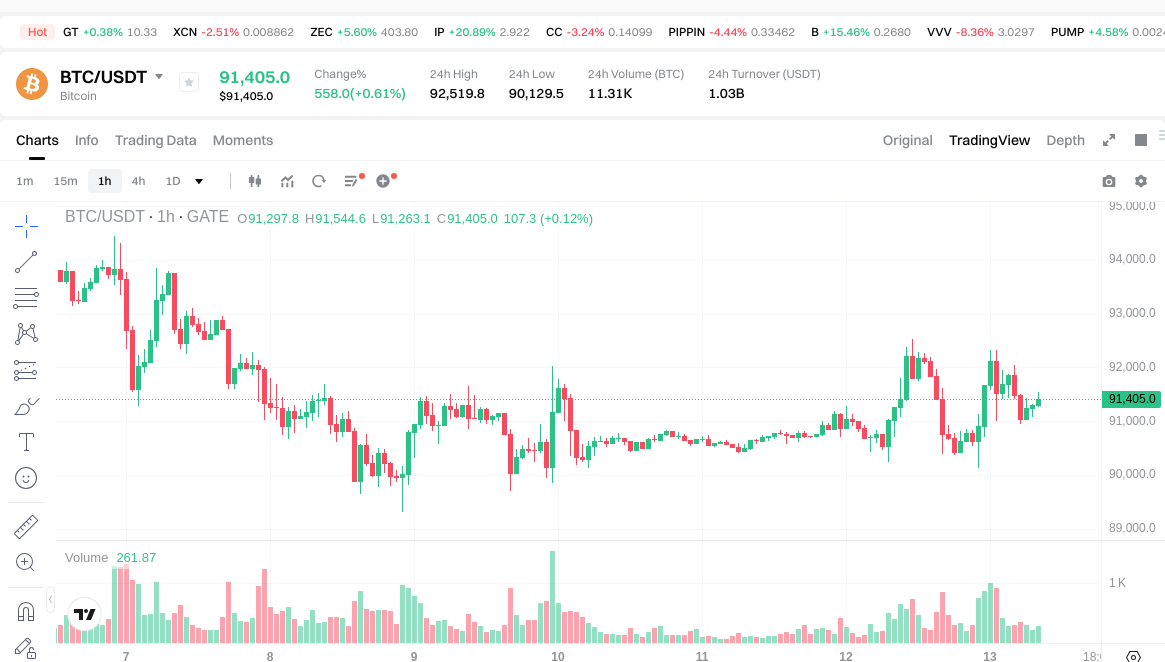
For instance, in the BTC/USDT market on major exchanges, a $1 million buy wall might seem large but represents a small fraction of total market depth. Such a wall would have minimal lasting impact on price.
However, in low-liquidity markets—such as small-cap altcoins—a relatively modest wall can significantly influence price. A $100,000 wall in a thinly-traded altcoin market might represent a substantial portion of daily trading volume, giving it considerable power to move prices.
Ultimately, no fixed rule exists for determining whether a wall is genuine; much depends on the individual trader's analysis and judgment. Experience, combined with comprehensive market analysis, helps develop the intuition necessary to distinguish between authentic market interest and manipulation tactics.
Limitations of Buy Walls and Sell Walls
While walls can offer useful information for trading decisions, they are far from infallible indicators. These structures can disappear suddenly, depending on the algorithms or intentions of individual traders. If you base your strategy on a wall that evaporates, the market can move against you rapidly; this is why risk management tools, such as stop-loss orders, are essential.
In deep, liquid markets like BTC/USDT on major exchanges, a single wall may pass unnoticed among the overall trading volume, having minimal lasting impact. However, in small markets such as low-capitalization altcoins, a wall can be easily manipulated and can dramatically influence price direction. As cryptocurrency markets mature and liquidity increases, what was once considered a "large wall" may become insignificant in the broader market context.
Traders must evaluate context when assessing walls: a $100,000 wall might be enormous for a small altcoin with limited daily volume, but completely irrelevant for Bitcoin, which trades billions of dollars daily. The relative size of a wall compared to typical trading volume provides important perspective.
Be especially cautious during important news events or "pump and dump" scenarios. During these volatile periods, walls can collapse instantly before large orders, and emotions tend to outweigh technical indicators. Market participants react impulsively to breaking news, often ignoring order book structures that seemed significant moments earlier.
Additionally, remember that market depth can conceal relevant orders not visible in the public order book. Many exchanges allow hidden orders or iceberg orders, where only a portion of the total order is displayed. This means the true buying or selling interest at a price level may be substantially different from what appears in the depth chart.
To summarize, never rely solely on buy and sell walls for your trading strategy. Use them as one tool among many, maintain flexibility in your approach, and always apply sound risk management principles. With experience, you'll learn to distinguish between genuine demand or supply and manipulation attempts, improving your ability to navigate volatile cryptocurrency markets successfully.
Conclusion
Cryptocurrency markets are characterized by high volatility and significant profit potential. Successful trades can substantially outperform traditional stock market returns, but the unpredictable and speculative nature of crypto facilitates manipulation, especially when market depth is low and whales can move prices at will. Learning more about technical analysis and staying informed about cryptocurrency developments will help you identify better opportunities and develop effective strategies in volatile environments.
Understanding buy walls and sell walls represents just one component of comprehensive market analysis. These tools, when combined with fundamental analysis, technical indicators, and awareness of market sentiment, contribute to a more complete picture of market dynamics. As you gain experience reading order books and depth charts, you'll develop the intuition necessary to distinguish between meaningful market signals and manipulative noise, ultimately improving your trading performance in the dynamic cryptocurrency markets.
FAQ
What are Buy Walls and Sell Walls, and what role do they play in trading?
Buy Walls and Sell Walls are large buy or sell orders placed to influence market price. Typically used by large holders(whales)to prevent price drops or rises. They affect market liquidity and price discovery on depth charts.
How to identify buy walls and sell walls on depth charts and what market signals do they indicate?
Buy and sell walls appear as concentrated order clusters at specific price levels on depth charts. They signal potential price reversals or consolidation points, often indicating imminent significant market movements or resistance/support levels.
Can buy and sell walls be manipulated? How should traders identify fake buy and sell walls?
Yes, buy and sell walls can be manipulated through fake orders creating false supply and demand. Traders should watch for large unexecuted orders and unusual price movements. Use technical analysis tools to identify abnormal patterns and suspicious volume spikes.
What is the relationship between buy and sell walls in depth charts and price support and resistance levels?
Buy and sell walls correlate with support and resistance levels. Support levels often attract buy walls where buyers concentrate, while resistance levels attract sell walls where sellers cluster. These walls reflect concentrated market intent at key price zones.
How can you use changes in buy and sell walls to identify market trends and trading opportunities?
Monitor buy and sell wall movements to gauge market direction. Rising walls signal upward momentum and buying opportunities, while declining walls indicate downward pressure and selling signals. Track wall shifts for early trend identification.
* The information is not intended to be and does not constitute financial advice or any other recommendation of any sort offered or endorsed by Gate.