This comprehensive guide compares CEEK and ETC, two distinct blockchain assets with different market positions. CEEK, launched in 2018, focuses on AR/VR wearable devices and virtual content platforms, currently trading at $0.004583 with limited liquidity ($14,107 daily volume). ETC, the proof-of-work blockchain since 2016, operates as smart contract infrastructure at $11.243 with robust trading volume ($1.13M daily). Both experienced significant corrections from 2021 peaks—CEEK down 99.6% from $1.19, ETC down 93.3% from $167.09. Long-term forecasts (2030-2031) project ETC appreciation to $14.81-$39.32 range, while CEEK targets $0.00357-$0.01196. Conservative investors favor ETC 70%/CEEK 30% allocation, leveraging superior liquidity and market establishment. Current Fear & Greed Index of 26 signals cautious market sentiment, requiring thorough research before investment decisions.
Introduction: CEEK vs ETC Investment Comparison
In the cryptocurrency market, the comparison between CEEK vs ETC has been a topic of interest for investors. The two assets exhibit notable differences in market capitalization ranking, application scenarios, and price performance, representing distinct positioning within the crypto asset landscape.
CEEK (CEEK): Launched in 2018, it focuses on AR/VR wearable devices and blockchain-based content sharing platforms, connecting music artists, athletes, and digital content creators directly with fans in the virtual world.
ETC (ETC): Since 2015, it has been regarded as a decentralized platform for executing smart contracts, maintaining the "code is law" principle as the continuation of the original Ethereum chain.
This article will analyze the investment value comparison of CEEK vs ETC through historical price trends, supply mechanisms, institutional adoption, technological ecosystems, and future predictions, attempting to address the question investors care about most:
"Which is the better buy right now?"
I. Historical Price Comparison and Current Market Status
CEEK Smart VR Token (CEEK) and Ethereum Classic (ETC) Historical Price Trends
-
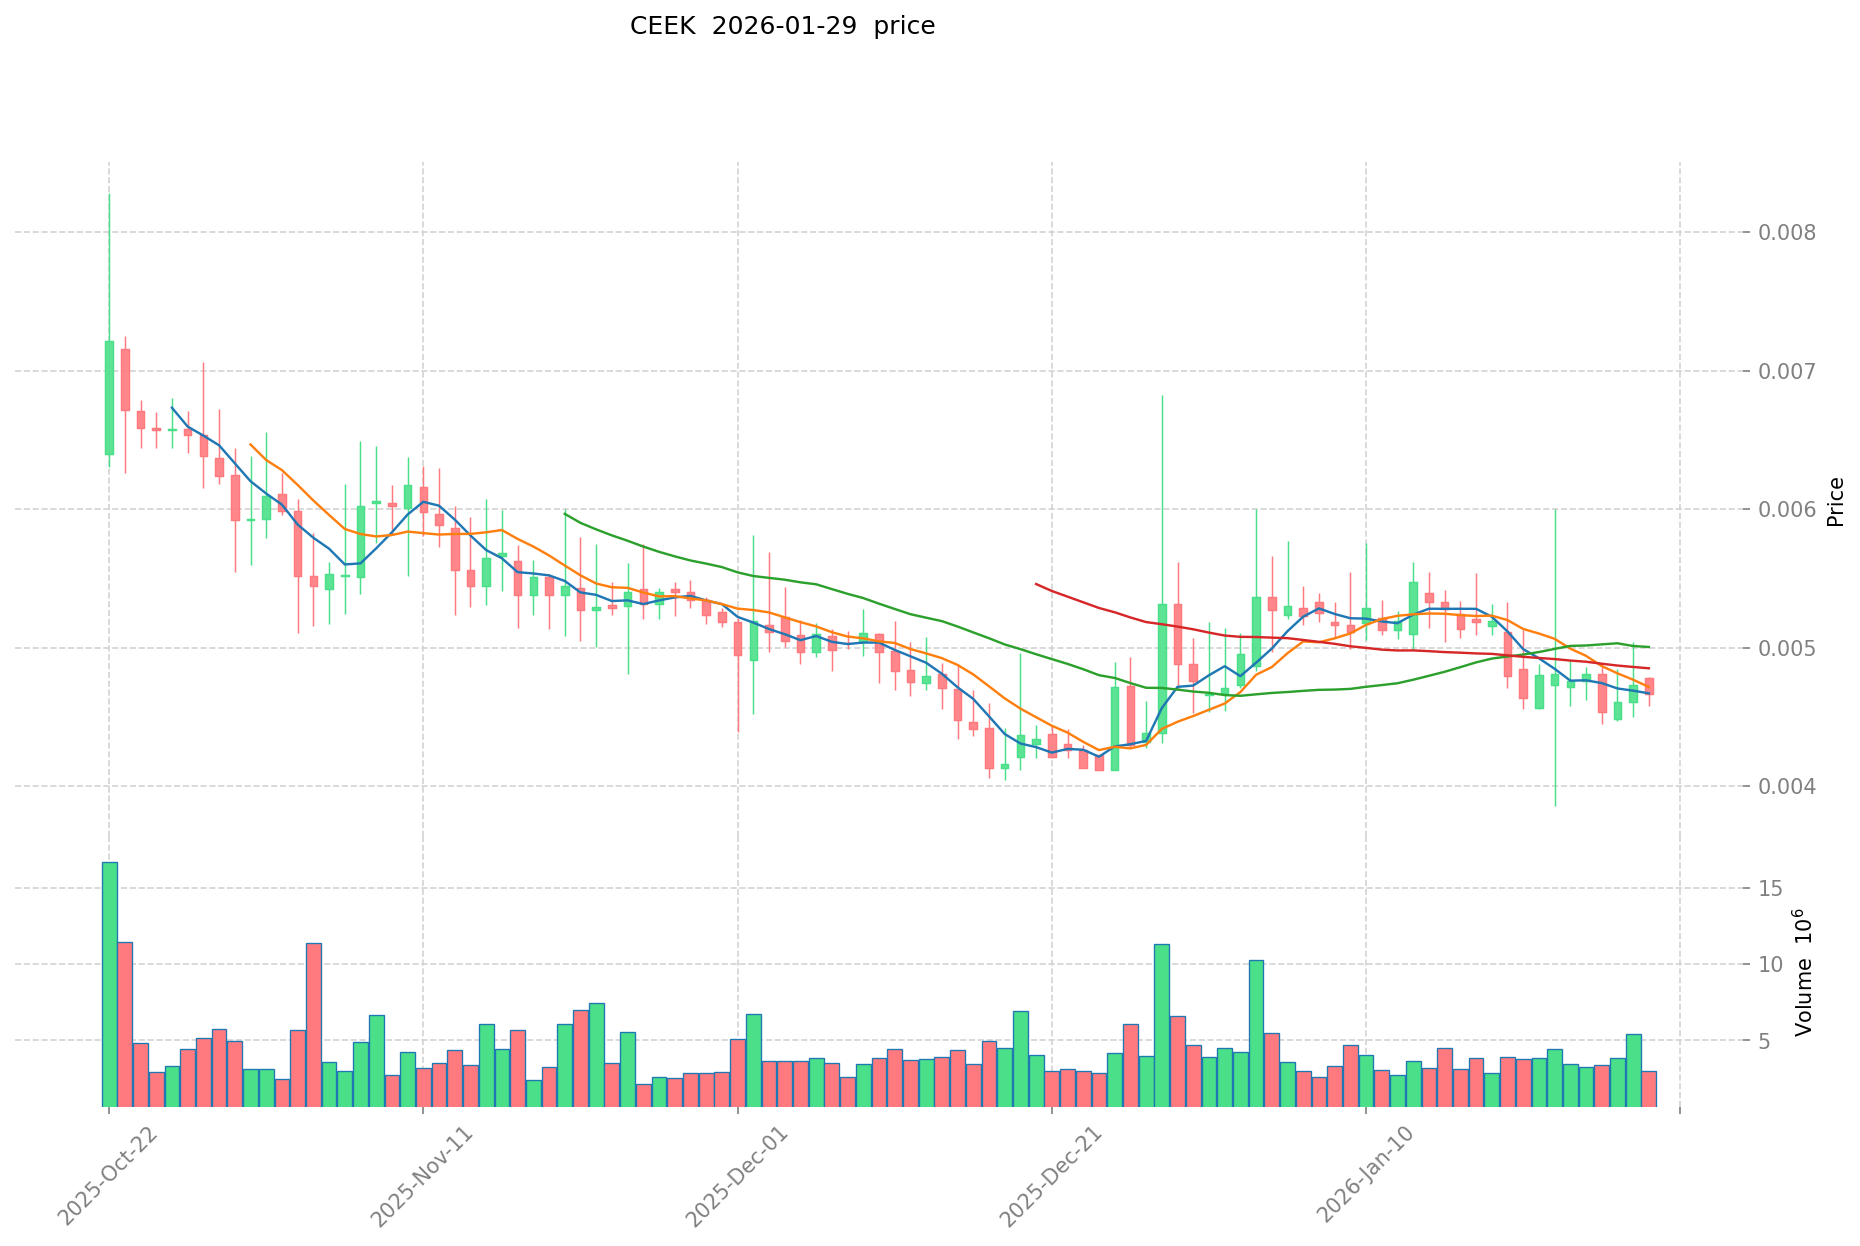
2021: CEEK experienced notable price movement, reaching its all-time high of $1.19 on November 29, 2021, during the broader cryptocurrency market rally. The token demonstrated significant volatility during this period.
-
2020: CEEK recorded its all-time low of $0.00074146 on February 14, 2020, reflecting early-stage market conditions and limited trading activity.
-
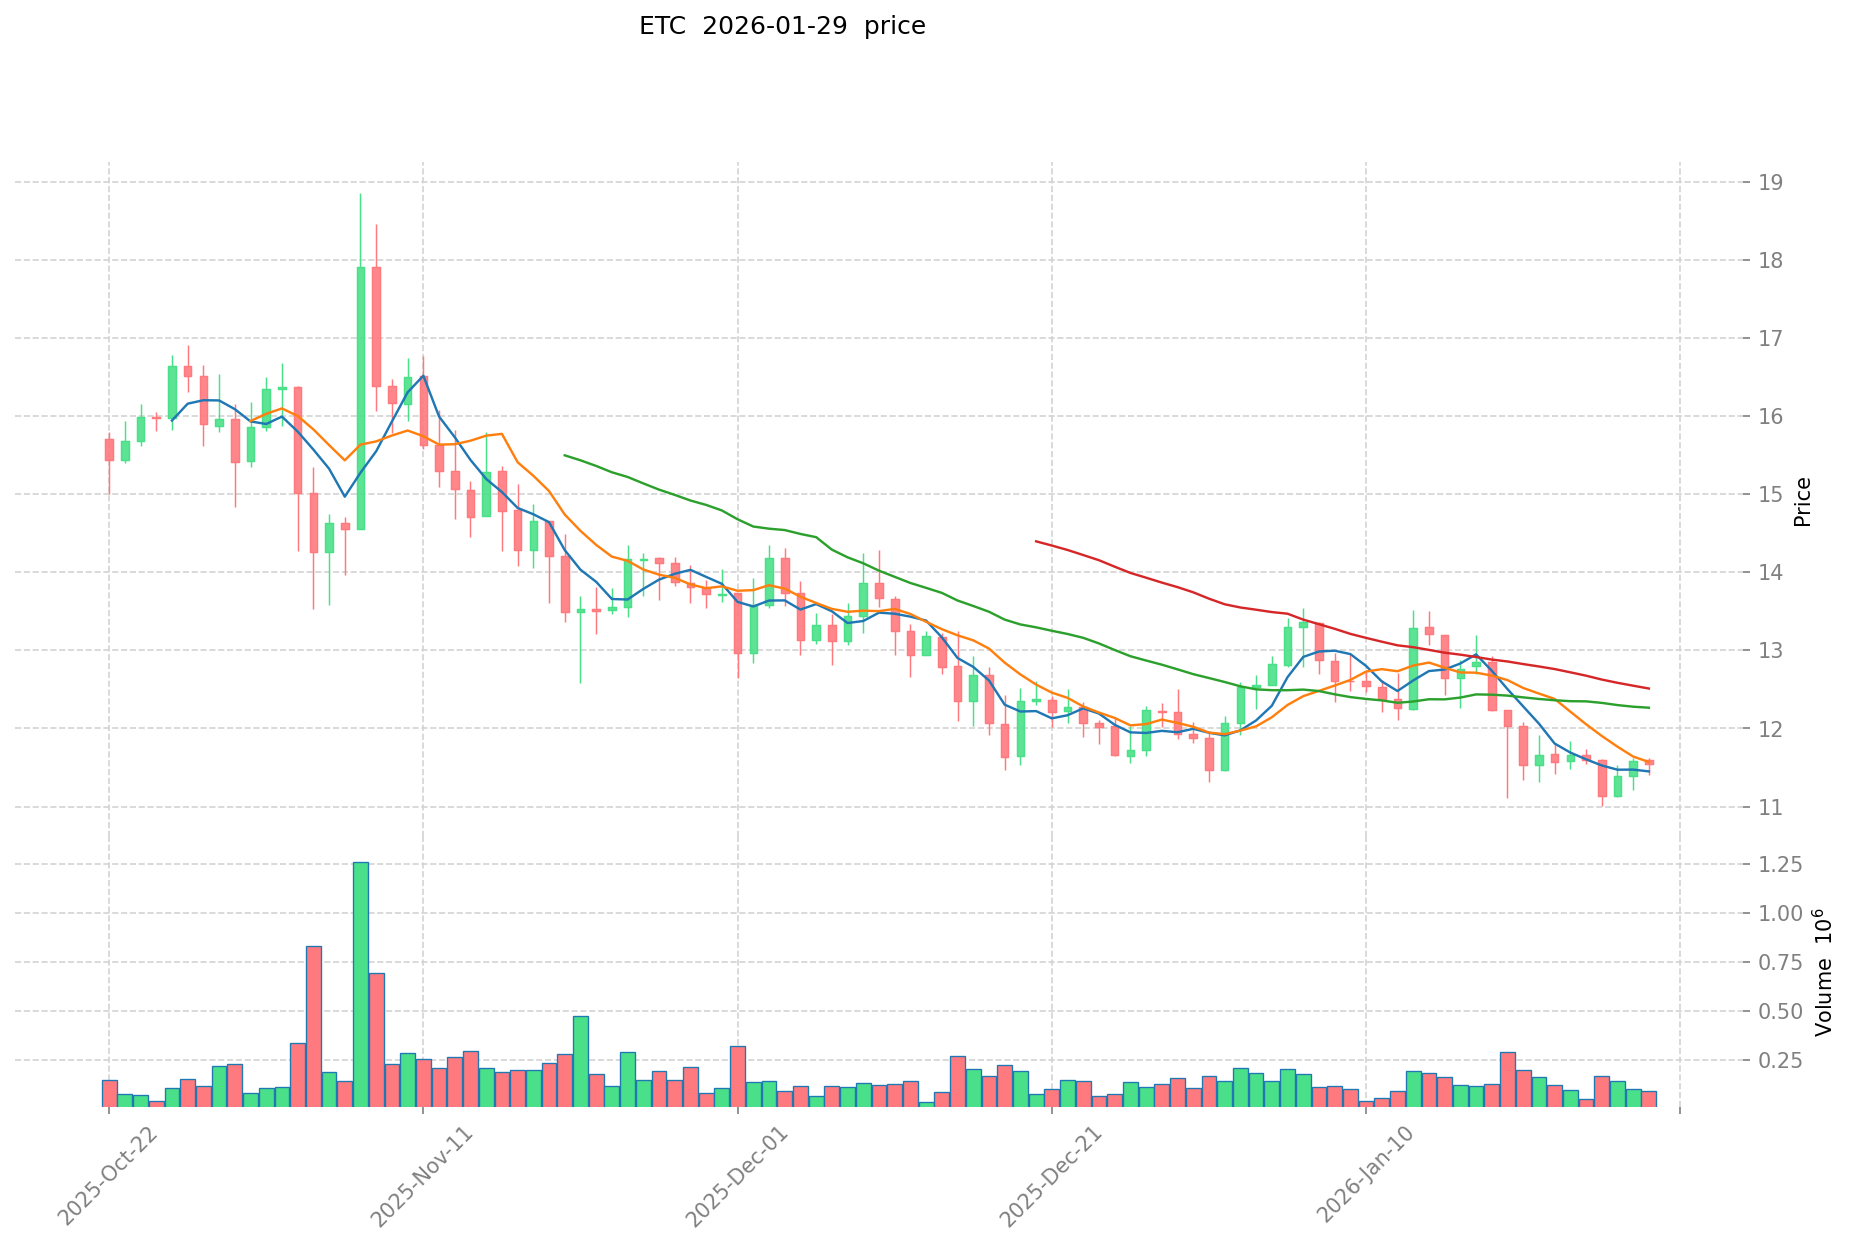
2021: ETC saw substantial price appreciation, achieving its all-time high of $167.09 on May 7, 2021, driven by increased mining activity following Ethereum's transition discussions and renewed interest in proof-of-work chains.
-
2016: ETC was established on July 25, 2016, following the DAO hack and subsequent Ethereum hard fork. The token recorded its all-time low of $0.615038 during its initial trading period.
-
Comparative Analysis: During the 2021-2022 market cycle, CEEK declined from its peak of $1.19 to current levels around $0.004583, representing a substantial correction. Meanwhile, ETC experienced a similar trajectory, falling from $167.09 to approximately $11.243, reflecting broader market downturns and sector-specific challenges.
Current Market Status (January 29, 2026)
- CEEK current price: $0.004583
- ETC current price: $11.243
- 24-hour trading volume: CEEK $14,107.04 vs ETC $1,128,474.10
- Market Sentiment Index (Fear & Greed Index): 26 (Fear)
View real-time prices:
II. Core Factors Affecting CEEK vs ETC Investment Value
Supply Mechanism Comparison (Tokenomics)
- CEEK: The reference materials do not provide specific information regarding CEEK's supply mechanism or tokenomics structure.
- ETC: The reference materials do not provide specific information regarding ETC's supply mechanism or tokenomics structure.
- 📌 Historical Pattern: Supply mechanisms can influence price cycles through controlled scarcity or inflationary pressures, though specific mechanisms for these assets are not detailed in the provided materials.
Institutional Adoption and Market Application
- Institutional Holdings: The reference materials do not contain information comparing institutional preference between CEEK and ETC.
- Enterprise Adoption: The provided materials do not discuss the application of CEEK or ETC in cross-border payments, settlements, or investment portfolios.
- National Policies: Regulatory attitudes toward these specific assets across different jurisdictions are not covered in the reference materials.
Technological Development and Ecosystem Building
- CEEK Technology Upgrades: The reference materials do not provide information about CEEK's technological developments or upgrades.
- ETC Technology Development: The reference materials do not provide information about ETC's technological developments or upgrades.
- Ecosystem Comparison: Implementation status in DeFi, NFT, payments, and smart contracts for both assets is not detailed in the provided materials.
Macroeconomic Environment and Market Cycles
- Performance in Inflationary Environment: The reference materials do not contain comparative analysis of anti-inflation properties for these assets.
- Macroeconomic Monetary Policy: The materials reference interest rates and financial performance metrics in general contexts but do not specifically address their impact on CEEK or ETC.
- Geopolitical Factors: Cross-border transaction demand and international situations are not discussed in relation to these specific assets in the provided materials.
III. 2026-2031 Price Forecast: CEEK vs ETC
Short-term Forecast (2026)
- CEEK: Conservative $0.00399 - $0.00458 | Optimistic $0.00458 - $0.00674
- ETC: Conservative $10.79 - $11.24 | Optimistic $11.24 - $14.83
Medium-term Forecast (2028-2029)
- CEEK may enter a consolidation phase, with projected prices ranging from $0.00475 to $0.00683
- ETC may enter an expansion phase, with projected prices ranging from $13.64 to $28.83
- Key drivers: institutional capital flows, ETF development, ecosystem growth
Long-term Forecast (2030-2031)
- CEEK: Baseline scenario $0.00357 - $0.00809 | Optimistic scenario $0.00598 - $0.01196
- ETC: Baseline scenario $14.81 - $26.93 | Optimistic scenario $23.43 - $39.32
View detailed price predictions for CEEK and ETC
Disclaimer
CEEK:
| Year |
Predicted High Price |
Predicted Average Price |
Predicted Low Price |
Price Change |
| 2026 |
0.00673701 |
0.004583 |
0.00398721 |
0 |
| 2027 |
0.00605620535 |
0.005660005 |
0.0030564027 |
22 |
| 2028 |
0.0064439156925 |
0.005858105175 |
0.00474506519175 |
27 |
| 2029 |
0.006827621581462 |
0.00615101043375 |
0.00565892959905 |
33 |
| 2030 |
0.009669080851333 |
0.006489316007606 |
0.003569123804183 |
40 |
| 2031 |
0.011957213675615 |
0.008079198429469 |
0.005978606837807 |
75 |
ETC:
| Year |
Predicted High Price |
Predicted Average Price |
Predicted Low Price |
Price Change |
| 2026 |
14.83284 |
11.237 |
10.78752 |
0 |
| 2027 |
18.7702848 |
13.03492 |
7.2995552 |
15 |
| 2028 |
23.05877348 |
15.9026024 |
14.789420232 |
41 |
| 2029 |
28.8314181512 |
19.48068794 |
13.636481558 |
73 |
| 2030 |
29.711945246088 |
24.1560530456 |
23.431371454232 |
114 |
| 2031 |
39.32363875293224 |
26.933999145844 |
14.8136995302142 |
139 |
IV. Investment Strategy Comparison: CEEK vs ETC
Long-term vs Short-term Investment Strategies
- CEEK: May appeal to investors interested in emerging metaverse and virtual reality content platforms, though current market conditions suggest limited short-term momentum with 24-hour trading volume of $14,107.04
- ETC: May suit investors seeking exposure to established proof-of-work blockchain infrastructure with higher liquidity, reflected in 24-hour trading volume of $1,128,474.10
Risk Management and Asset Allocation
- Conservative Investors: Consider ETC 70% vs CEEK 30% allocation, given ETC's higher market liquidity and established market position
- Aggressive Investors: May explore ETC 50% vs CEEK 50% allocation for diversified exposure to both infrastructure and application-layer assets
- Hedging Tools: Stablecoin reserves, options strategies for downside protection, cross-asset portfolio diversification
V. Potential Risk Comparison
Market Risks
- CEEK: Price volatility with substantial decline from peak of $1.19 to current $0.004583, limited trading volume suggesting liquidity constraints during market stress
- ETC: Price fluctuations from historical high of $167.09 to current $11.243, susceptibility to broader proof-of-work mining dynamics and market sentiment shifts
Technical Risks
- CEEK: Platform adoption and user engagement metrics not specified in available materials, potential scalability considerations for AR/VR applications
- ETC: Network security considerations inherent to proof-of-work consensus mechanisms, potential mining concentration factors
Regulatory Risks
- Both assets face evolving global regulatory frameworks affecting cryptocurrency trading, custody, and taxation across different jurisdictions
VI. Conclusion: Which Is the Better Buy?
📌 Investment Value Summary:
- CEEK Characteristics: Positioned in metaverse and virtual reality content sector, substantial price correction from historical peak, lower current liquidity levels
- ETC Characteristics: Established proof-of-work blockchain infrastructure, higher trading volumes indicating greater market liquidity, longer operational history since 2016
✅ Investment Considerations:
- Novice Investors: Consider starting with assets demonstrating higher liquidity and established market presence, understanding individual risk tolerance and investment timeframes
- Experienced Investors: May evaluate portfolio diversification across different crypto asset categories, implementing risk management through position sizing and stop-loss mechanisms
- Institutional Investors: Assess custody solutions, regulatory compliance requirements, and liquidity profiles suitable for larger capital allocations
⚠️ Risk Disclosure: Cryptocurrency markets exhibit significant volatility. Current Fear & Greed Index of 26 indicates prevailing fear sentiment. This content does not constitute investment advice. Conduct thorough research and consult qualified financial advisors before making investment decisions.
VII. FAQ
Q1: What are the main differences between CEEK and ETC in terms of use cases?
CEEK focuses on AR/VR content platforms connecting creators with fans, while ETC serves as a decentralized smart contract platform maintaining the original Ethereum blockchain principles. CEEK operates in the metaverse and virtual reality content sector, launched in 2018 specifically for wearable devices and blockchain-based content sharing. In contrast, ETC has operated since 2016 as a proof-of-work blockchain infrastructure emphasizing the "code is law" philosophy, functioning as a continuation of the original Ethereum chain following the DAO hard fork.
Q2: Which asset has better liquidity currently?
ETC demonstrates significantly better liquidity with 24-hour trading volume of $1,128,474.10 compared to CEEK's $14,107.04. The substantial difference in trading volumes (approximately 80 times higher for ETC) indicates ETC offers greater market depth and easier entry/exit positions for investors. This liquidity advantage makes ETC more suitable for larger capital allocations and provides better price stability during market stress conditions.
Q3: How have these assets performed from their historical peaks?
Both assets have experienced substantial corrections from their all-time highs. CEEK declined from its peak of $1.19 (November 29, 2021) to current levels around $0.004583, representing approximately 99.6% decline. ETC fell from $167.09 (May 7, 2021) to approximately $11.243, representing roughly 93.3% decline. These corrections reflect broader cryptocurrency market downturns and sector-specific challenges affecting both infrastructure and application-layer assets.
Q4: What is the price outlook for 2026-2031?
Short-term forecasts for 2026 project CEEK ranging from $0.00399 to $0.00674, while ETC is projected between $10.79 and $14.83. Long-term scenarios (2030-2031) suggest CEEK baseline of $0.00357 to $0.00809 with optimistic potential reaching $0.01196, whereas ETC baseline ranges from $14.81 to $26.93 with optimistic scenarios reaching $39.32. These projections reflect different growth trajectories, with ETC showing more substantial potential appreciation in nominal terms.
Q5: What allocation strategy is recommended for different investor types?
Conservative investors may consider 70% ETC and 30% CEEK allocation, leveraging ETC's higher liquidity and established market position. Aggressive investors could explore 50% ETC and 50% CEEK for diversified exposure across infrastructure and application layers. The strategy should incorporate hedging tools including stablecoin reserves, options strategies for downside protection, and cross-asset portfolio diversification to manage volatility risks inherent in both assets.
Q6: What are the primary risks associated with each asset?
CEEK faces market risks including extreme price volatility (99.6% decline from peak), limited trading volume creating liquidity constraints, and technical risks related to platform adoption metrics and AR/VR application scalability. ETC confronts price fluctuations tied to proof-of-work mining dynamics, network security considerations inherent to consensus mechanisms, and potential mining concentration factors. Both assets face evolving regulatory frameworks affecting cryptocurrency trading, custody, and taxation across jurisdictions.
Q7: Is now a good time to invest based on market sentiment?
The current Fear & Greed Index stands at 26, indicating prevailing fear sentiment in the cryptocurrency market. Historically, fear levels may present accumulation opportunities for long-term investors, though timing remains uncertain. The substantial declines from historical peaks for both assets reflect broader market corrections. Investors should evaluate individual risk tolerance, investment timeframes, and conduct thorough research before making investment decisions. Current market conditions require careful position sizing and risk management strategies regardless of chosen asset.
* The information is not intended to be and does not constitute financial advice or any other recommendation of any sort offered or endorsed by Gate.