This comprehensive analysis compares CFX and DOT, two Layer-1 blockchains with distinct DeFi positioning and performance characteristics. CFX, launched in 2020, emphasizes scalable public blockchain infrastructure with high throughput, while DOT (launched 2019) specializes in cross-chain interoperability through parachain architecture. The article examines historical price trends, current market dynamics (CFX at $0.07888, DOT at $2.231 as of January 2026), tokenomics, institutional adoption patterns, and technical ecosystems. Through 2031 price forecasts and investment strategy frameworks, the analysis addresses which asset better suits conservative, aggressive, beginning, and institutional investors. Risk assessments cover market volatility, technical execution challenges, and regulatory considerations across jurisdictions. The guide concludes that DOT suits interoperability-focused investors with larger market presence, while CFX appeals to those seeking emerging regional blockchain infrastructure exposure
Introduction: Investment Comparison Between CFX and DOT
In the cryptocurrency market, the comparison between CFX vs DOT has consistently been a topic of interest for investors. Both assets demonstrate significant differences in market capitalization rankings, application scenarios, and price performance, representing distinct positioning within the crypto asset landscape.
CFX (Conflux): Launched in October 2020, it has gained market recognition through its scalable decentralized blockchain network designed for high throughput and fast confirmation.
DOT (Polkadot): Since its launch in May 2019, it has been recognized for connecting private chains, consortium chains, public chains, and facilitating trustless information exchange between independent blockchains.
This article will comprehensively analyze the investment value comparison of CFX vs DOT by examining historical price trends, supply mechanisms, institutional adoption, technical ecosystems, and future projections, attempting to address investors' most pressing question:
"Which is the better buy right now?"
I. Historical Price Comparison and Current Market Situation
Historical Price Trends of CFX (Coin A) and DOT (Coin B)
-
2021: CFX reached its all-time high of $1.7 in March 2021 during the broader crypto market bull run. During the same period, DOT achieved its historical peak of $54.98 in November 2021, demonstrating significantly stronger price appreciation during the 2021 bull cycle.
-
2022: Both assets experienced substantial declines during the bear market. CFX recorded its all-time low of approximately $0.022 in December 2022, while DOT saw considerable downward pressure throughout the year.
-
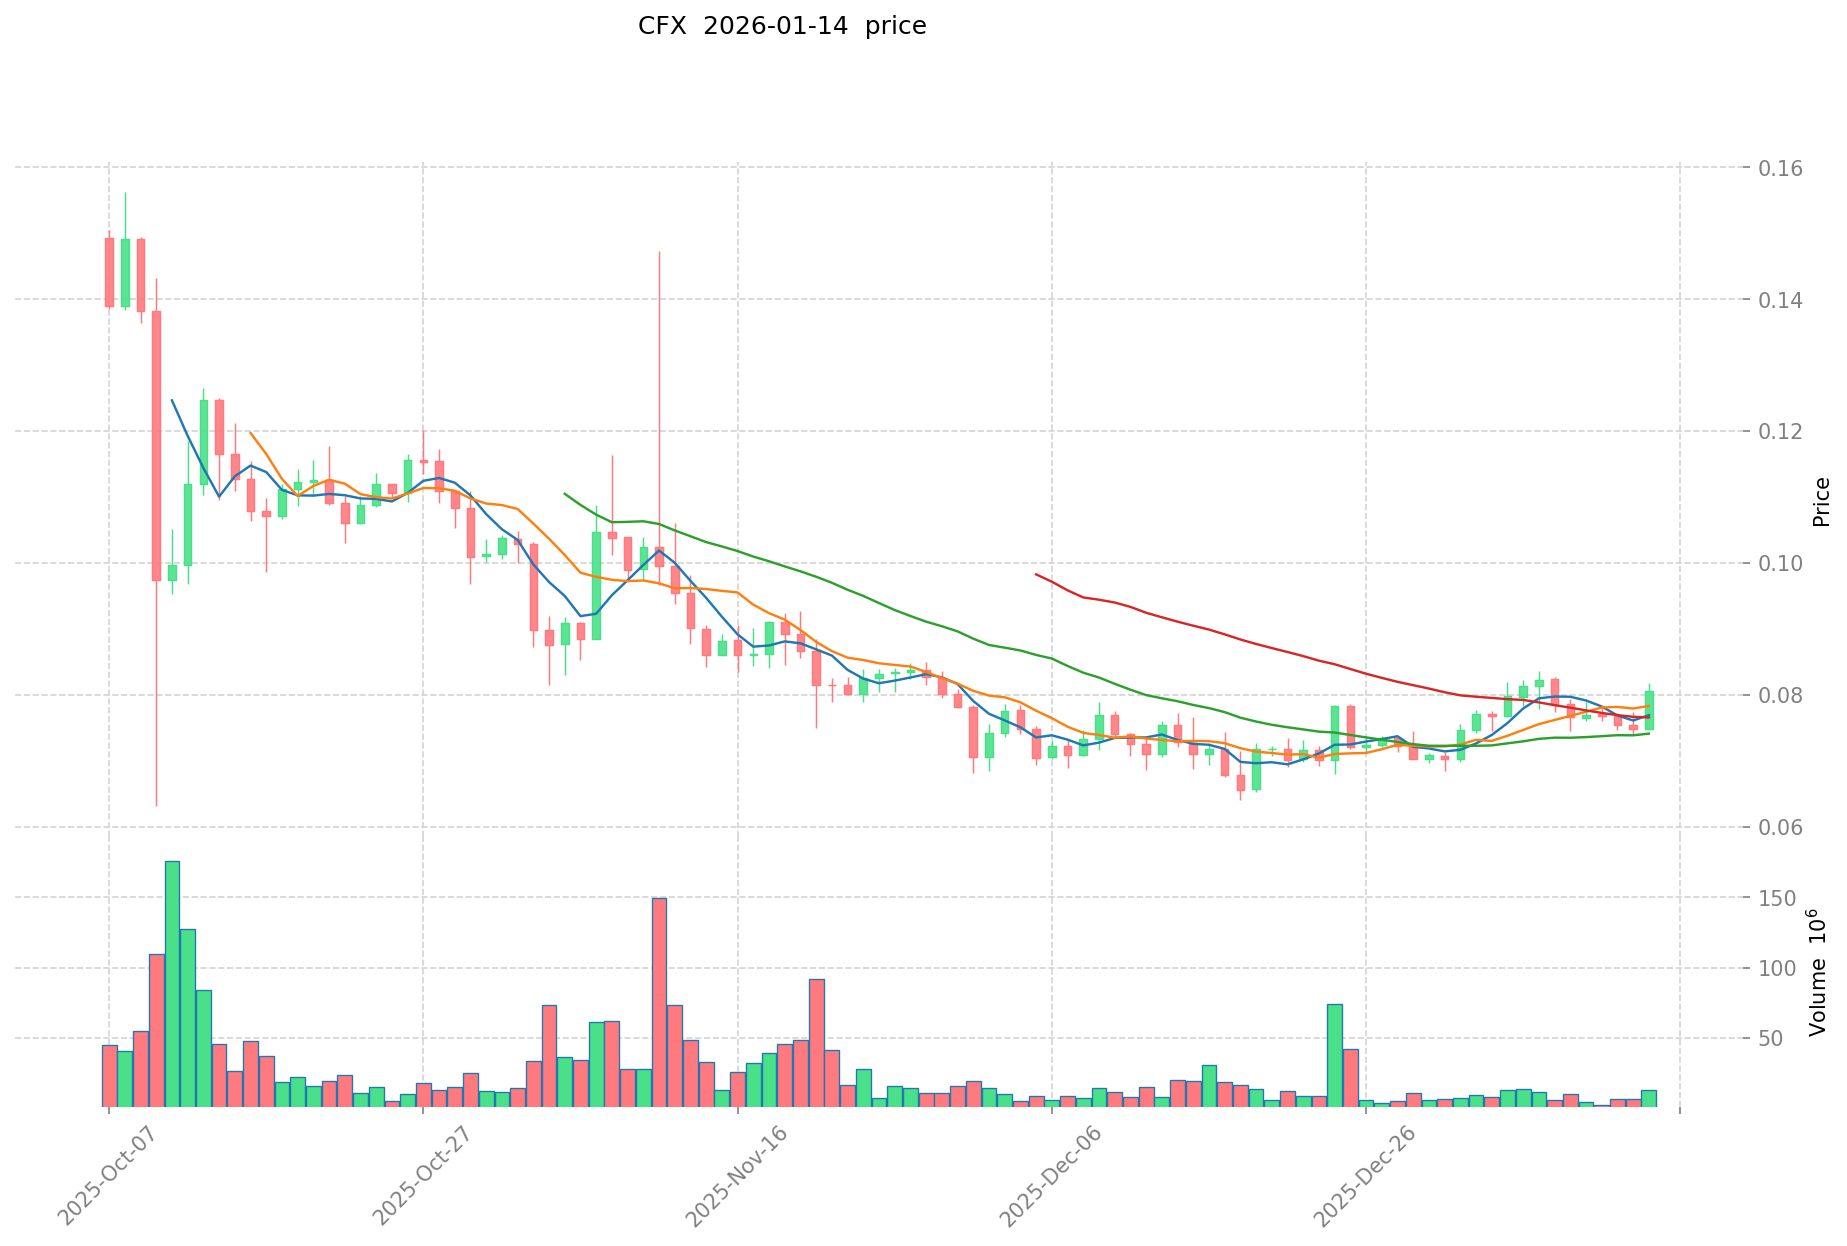
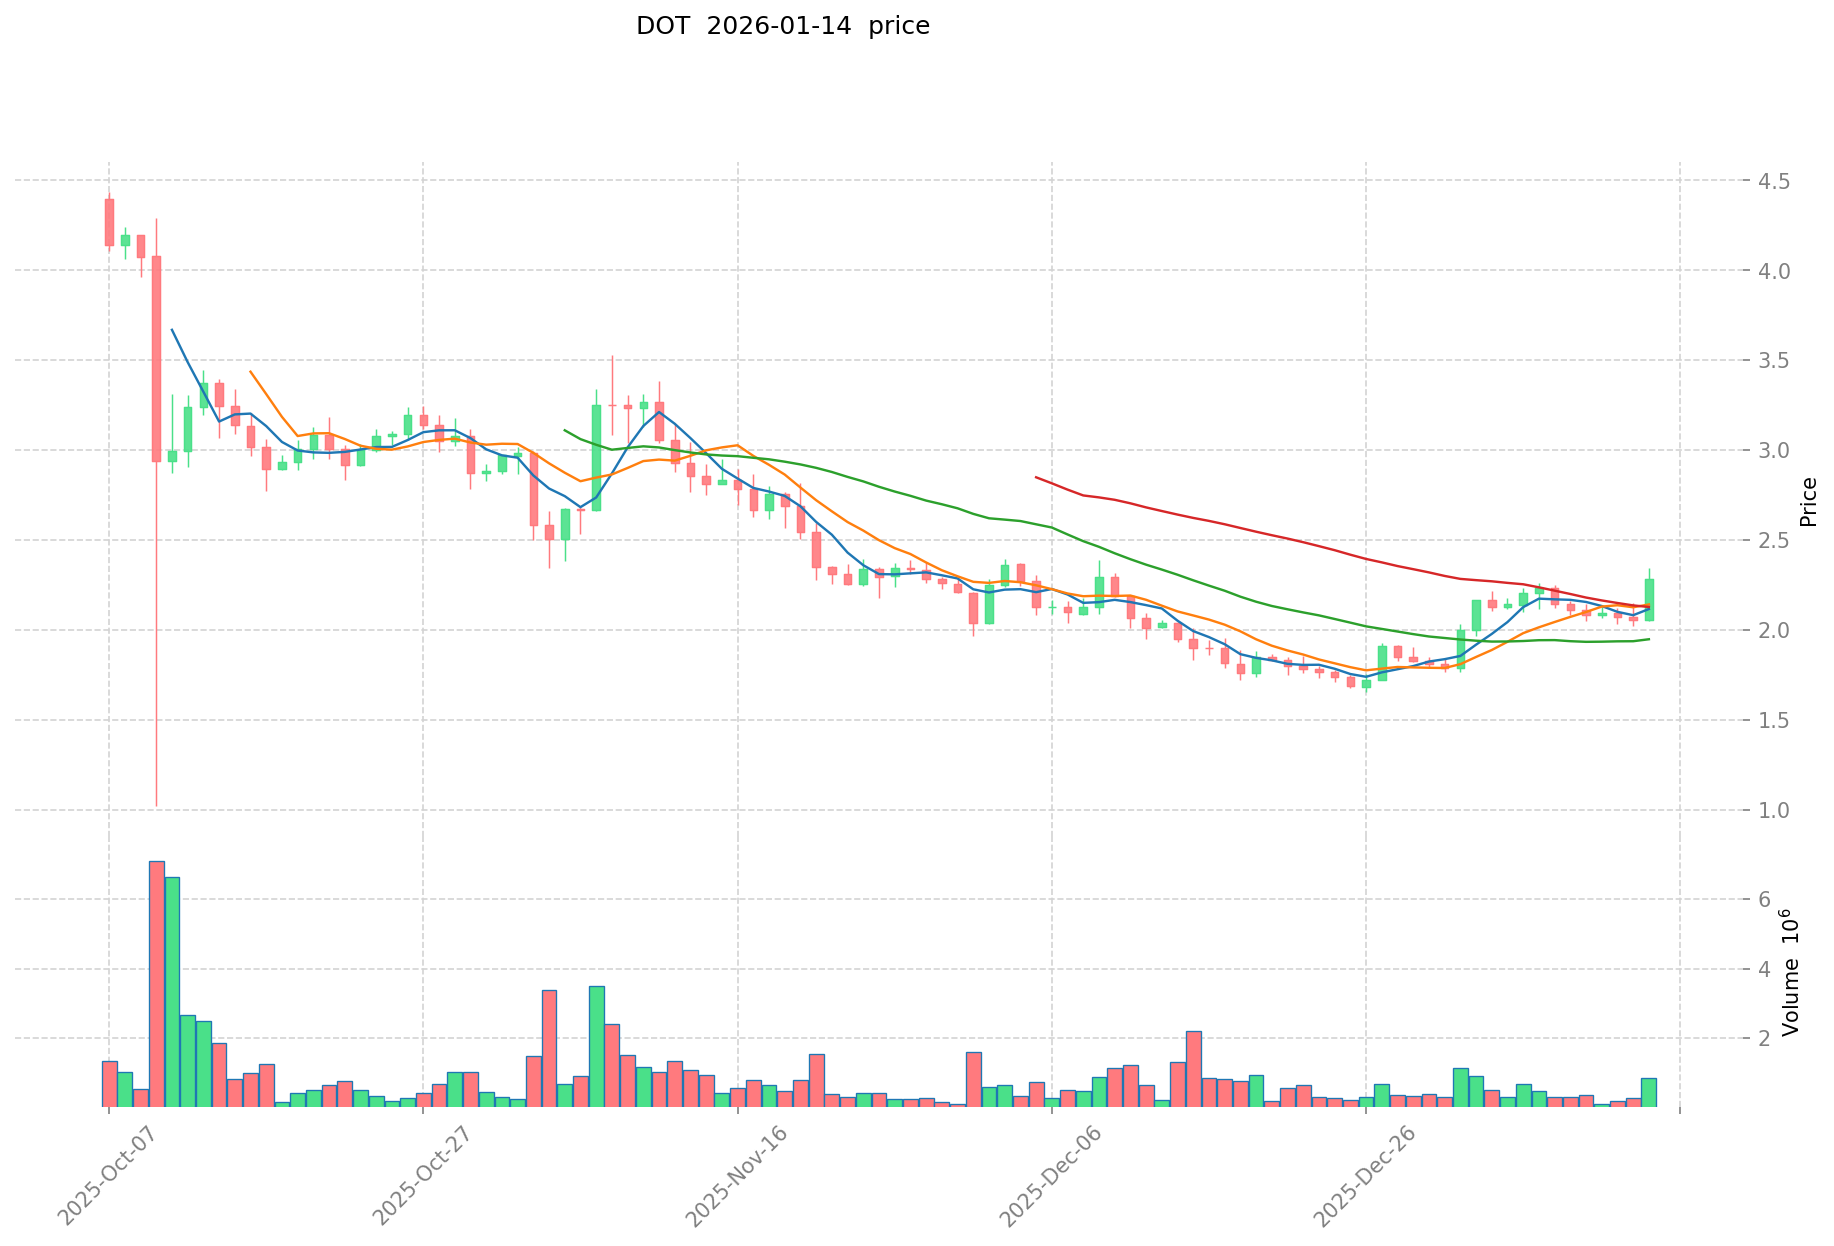
2024-2025: CFX has shown modest recovery with price movements between $0.06-$0.08 range. DOT experienced more volatility, with prices ranging from $1.66 (recorded in December 2025) to higher levels earlier in the year.
-
Comparative Analysis: During the market cycle from 2021 peaks to 2022-2023 lows, CFX declined from $1.7 to $0.022 (approximately 98.7% correction), while DOT fell from $54.98 to $1.66 (approximately 97% correction). Both assets demonstrated similar percentage declines during the bear market, though DOT's absolute price volatility was notably higher.
Current Market Situation (January 15, 2026)
- CFX Current Price: $0.07888
- DOT Current Price: $2.231
- 24-Hour Trading Volume: CFX recorded $1,012,035.52 compared to DOT's $2,597,135.34
- Market Capitalization: CFX stands at approximately $406.99 million, while DOT maintains a significantly larger market cap of $3.69 billion
- 24-Hour Price Movement: CFX showed a -0.45% change, while DOT experienced a -0.97% decline
- Market Sentiment Index (Fear & Greed Index): 48 (Neutral)
View real-time prices:
II. Core Factors Influencing CFX vs DOT Investment Value
Supply Mechanism Comparison (Tokenomics)
- CFX: Features a blockchain-based supply mechanism that supports its public chain infrastructure. The tokenomics are designed to facilitate network operations and incentivize ecosystem participation.
- DOT: Operates with a proof-of-stake consensus mechanism that includes staking rewards and network governance features. The supply model supports validator participation and ecosystem development.
- 📌 Historical Pattern: Supply mechanisms play a role in shaping token distribution cycles, though specific patterns vary across different market conditions and technological implementations.
Institutional Adoption and Market Applications
- Institutional Holdings: Both tokens have attracted varying degrees of institutional interest, with CFX benefiting from regional support initiatives and DOT gaining traction through its multi-chain ecosystem approach.
- Enterprise Adoption: CFX has been positioned within regional blockchain development strategies, while DOT focuses on interoperability solutions that enable cross-chain communication and decentralized application deployment.
- Policy Environment: CFX has been associated with regional blockchain initiatives, particularly in contexts emphasizing technological innovation and digital infrastructure development.
Technical Development and Ecosystem Building
- CFX Technical Features: Represents a public blockchain platform that emphasizes security and performance characteristics. The technology aims to support decentralized application development.
- DOT Technical Development: Focuses on scalability through its parachain architecture, enabling specialized blockchains to operate within a unified security framework. This approach supports diverse use cases across the ecosystem.
- Ecosystem Comparison: CFX has been mentioned in contexts relating to regional blockchain adoption, while DOT's value proposition centers on its interoperability infrastructure. Both projects maintain ongoing development in areas including decentralized finance protocols and blockchain applications.
Macroeconomic Environment and Market Cycles
- Market Positioning: Both tokens operate within the broader cryptocurrency market, where valuations respond to technological adoption trends, community support, and ecosystem expansion.
- Monetary Dynamics: Cryptocurrency markets generally reflect broader risk appetite trends, regulatory developments, and technological innovation cycles.
- Regional Considerations: CFX has been associated with specific regional blockchain development initiatives, while DOT maintains a more globally distributed ecosystem focus.
III. 2026-2031 Price Forecast: CFX vs DOT
Short-term Forecast (2026)
- CFX: Conservative $0.0662-$0.0788 | Optimistic $0.0788-$0.1008
- DOT: Conservative $1.1835-$2.2330 | Optimistic $2.2330-$2.4116
Mid-term Forecast (2028-2029)
- CFX may enter a gradual growth phase, with projected price range of $0.0604-$0.1358 in 2028, potentially reaching $0.0615-$0.1761 by 2029
- DOT may enter a moderate expansion stage, with projected price range of $1.4143-$3.4886 in 2028, potentially reaching $2.7475-$3.9751 by 2029
- Key drivers: institutional capital flows, ETF developments, ecosystem expansion
Long-term Forecast (2030-2031)
- CFX: Baseline scenario $0.1236-$0.1471 (2030), $0.0886-$0.1641 (2031) | Optimistic scenario $0.1810 (2030), $0.1706 (2031)
- DOT: Baseline scenario $2.0349-$3.4490 (2030), $1.9908-$3.8284 (2031) | Optimistic scenario $4.2078 (2030), $4.2878 (2031)
View detailed price predictions for CFX and DOT
Disclaimer
CFX:
| Year |
Predicted High Price |
Predicted Average Price |
Predicted Low Price |
Price Change |
| 2026 |
0.1008384 |
0.07878 |
0.0661752 |
0 |
| 2027 |
0.111363408 |
0.0898092 |
0.05388552 |
13 |
| 2028 |
0.1357915104 |
0.100586304 |
0.0603517824 |
27 |
| 2029 |
0.176101471728 |
0.1181889072 |
0.061458231744 |
49 |
| 2030 |
0.18098858304072 |
0.147145189464 |
0.12360195914976 |
86 |
| 2031 |
0.170629561702454 |
0.16406688625236 |
0.088596118576274 |
107 |
DOT:
| Year |
Predicted High Price |
Predicted Average Price |
Predicted Low Price |
Price Change |
| 2026 |
2.41164 |
2.233 |
1.18349 |
0 |
| 2027 |
2.3919896 |
2.32232 |
1.6952936 |
4 |
| 2028 |
3.488589104 |
2.3571548 |
1.41429288 |
5 |
| 2029 |
3.97510585472 |
2.922871952 |
2.74749963488 |
31 |
| 2030 |
4.2077664620992 |
3.44898890336 |
2.0349034529824 |
54 |
| 2031 |
4.287783004657152 |
3.8283776827296 |
1.990756395019392 |
71 |
IV. Investment Strategy Comparison: CFX vs DOT
Long-term vs Short-term Investment Strategies
-
CFX: May suit investors interested in regional blockchain development initiatives and emerging ecosystem participation. The asset's positioning within specific technological infrastructure programs could appeal to those seeking exposure to targeted blockchain adoption scenarios.
-
DOT: May suit investors focusing on interoperability solutions and multi-chain ecosystem development. The parachain architecture and cross-chain communication capabilities could attract those interested in foundational blockchain infrastructure with diverse application potential.
Risk Management and Asset Allocation
-
Conservative Investors: A potential allocation approach might consider 30% CFX vs 70% DOT, reflecting DOT's larger market capitalization and more established ecosystem presence.
-
Aggressive Investors: A potential allocation approach might consider 50% CFX vs 50% DOT, balancing exposure to both emerging regional initiatives and established interoperability infrastructure.
-
Hedging Tools: Portfolio diversification strategies may include stablecoin allocations for liquidity management, derivatives instruments where available, and cross-asset combinations to manage exposure across different blockchain ecosystem segments.
V. Potential Risk Comparison
Market Risks
-
CFX: The asset demonstrates exposure to regional adoption dynamics and ecosystem development timelines. Price movements have shown correlation with broader cryptocurrency market cycles, with historical volatility patterns reflecting both sector-wide trends and project-specific developments.
-
DOT: The asset experiences market dynamics influenced by interoperability sector adoption rates and parachain ecosystem expansion. Trading volumes and price movements reflect both general cryptocurrency market sentiment and specific developments within the multi-chain ecosystem landscape.
Technical Risks
-
CFX: Technical considerations include ongoing network development requirements, ecosystem scalability challenges, and the execution timeline for planned technological implementations.
-
DOT: Technical considerations encompass parachain slot auction mechanisms, relay chain security model dependencies, and the coordination challenges inherent in managing a multi-chain ecosystem architecture.
Regulatory Risks
- Both assets operate within evolving regulatory frameworks that vary across jurisdictions. CFX's association with specific regional blockchain initiatives may present both opportunities and considerations related to local policy developments. DOT's globally distributed ecosystem model encounters diverse regulatory environments across multiple jurisdictions, which may influence adoption patterns and operational parameters in different markets.
VI. Conclusion: Which Is the Better Buy?
📌 Investment Value Summary
-
CFX Characteristics: The asset represents exposure to regional blockchain development initiatives with a focus on public chain infrastructure. Current market capitalization of approximately $406.99 million suggests positioning within the mid-tier cryptocurrency asset category. Price projections indicate potential growth scenarios ranging from conservative estimates of $0.0662-$0.1471 through 2030-2031.
-
DOT Characteristics: The asset offers exposure to interoperability infrastructure with an established multi-chain ecosystem. Market capitalization of approximately $3.69 billion reflects more substantial market presence. Price projections suggest potential ranges from $1.1835 to $4.2878 across various timeframes and scenarios through 2030-2031.
✅ Investment Considerations
-
Beginning Investors: May consider starting with smaller position sizes to understand market dynamics and asset behavior patterns. Portfolio diversification across different blockchain ecosystem segments could help manage exposure to individual project developments.
-
Experienced Investors: May evaluate allocation strategies based on risk tolerance, existing portfolio composition, and specific interest in either regional blockchain initiatives (CFX) or multi-chain interoperability infrastructure (DOT). Technical analysis and fundamental research could inform position sizing decisions.
-
Institutional Investors: May assess both assets within broader blockchain infrastructure allocation frameworks, considering factors such as liquidity profiles, ecosystem development trajectories, regulatory considerations, and correlation patterns with other portfolio holdings.
⚠️ Risk Disclosure: Cryptocurrency markets exhibit substantial volatility characteristics. Asset valuations can experience significant fluctuations based on technological developments, market sentiment shifts, regulatory changes, and broader economic conditions. This analysis does not constitute investment advice. Individuals should conduct independent research and consider consulting qualified financial advisors before making investment decisions.
VII. FAQ
Q1: What are the main differences between CFX and DOT in terms of technology and use cases?
CFX focuses on scalable public blockchain infrastructure with high throughput and fast confirmation capabilities, while DOT specializes in cross-chain interoperability through its parachain architecture. CFX operates as a decentralized blockchain network launched in October 2020, emphasizing regional blockchain development initiatives and public chain applications. DOT, launched in May 2019, connects independent blockchains through trustless information exchange, enabling specialized blockchains to operate within a unified security framework. The core distinction lies in CFX's emphasis on standalone high-performance infrastructure versus DOT's multi-chain interoperability ecosystem approach.
Q2: How do the market capitalizations of CFX and DOT compare, and what does this indicate?
As of January 15, 2026, DOT maintains a significantly larger market capitalization of approximately $3.69 billion compared to CFX's $406.99 million—representing nearly a 9x difference. This substantial gap reflects DOT's more established market presence, broader institutional adoption, and mature ecosystem development. The larger market cap typically indicates greater liquidity, potentially lower volatility relative to smaller-cap assets, and stronger network effects. CFX's smaller market cap positions it in the mid-tier cryptocurrency category, which may offer different risk-reward characteristics for investors seeking exposure to emerging blockchain infrastructure projects.
Q3: What were the historical price performances of CFX and DOT during the 2021-2022 market cycle?
Both assets experienced significant volatility during the 2021-2022 cycle. CFX reached its all-time high of $1.7 in March 2021, then declined approximately 98.7% to its all-time low of $0.022 in December 2022. DOT achieved its peak of $54.98 in November 2021, subsequently falling approximately 97% to $1.66. Despite similar percentage corrections during the bear market, DOT demonstrated stronger absolute price appreciation during the 2021 bull run, reaching significantly higher price levels. Both assets followed broader cryptocurrency market cycles, though DOT's higher peak and larger market presence indicated stronger participation in the 2021 bull market momentum.
Q4: What are the price projections for CFX and DOT through 2031?
For CFX, conservative short-term projections (2026) range from $0.0662-$0.0788, with optimistic scenarios reaching $0.1008. Long-term forecasts (2030-2031) suggest baseline ranges of $0.0886-$0.1471, with optimistic scenarios potentially reaching $0.1810. For DOT, conservative 2026 projections range from $1.1835-$2.2330, with optimistic scenarios reaching $2.4116. Long-term forecasts (2030-2031) indicate baseline ranges of $1.9908-$3.8284, with optimistic scenarios potentially reaching $4.2878. These projections depend on multiple factors including institutional adoption, ecosystem expansion, regulatory developments, and broader cryptocurrency market cycles. All forecasts carry substantial uncertainty and should not be considered guaranteed outcomes.
Q5: How should investors approach portfolio allocation between CFX and DOT?
Portfolio allocation strategies depend on individual risk tolerance and investment objectives. Conservative investors might consider a 30% CFX vs 70% DOT allocation, reflecting DOT's larger market capitalization and more established ecosystem. Aggressive investors seeking balanced exposure might consider 50% CFX vs 50% DOT, combining emerging regional initiatives with established interoperability infrastructure. Beginning investors may start with smaller position sizes to understand market dynamics before increasing exposure. Risk management approaches should include diversification across different blockchain sectors, potential stablecoin allocations for liquidity management, and regular portfolio rebalancing based on changing market conditions and project developments.
Q6: What are the primary risks associated with investing in CFX versus DOT?
CFX risks include exposure to regional adoption dynamics, ecosystem development timelines, network scalability challenges, and execution risks related to technological implementations. As a smaller-cap asset, CFX may experience higher volatility and liquidity constraints compared to larger-cap alternatives. DOT risks encompass parachain auction mechanism dependencies, relay chain security model considerations, and coordination challenges inherent in managing multi-chain ecosystems. Both assets face regulatory uncertainties across different jurisdictions, market correlation risks with broader cryptocurrency cycles, and technical development execution challenges. CFX's regional focus presents both opportunities and considerations related to local policy developments, while DOT's global distribution encounters diverse regulatory environments that may influence adoption patterns differently across markets.
Q7: Which asset is more suitable for institutional versus retail investors?
DOT may be more suitable for institutional investors due to its larger market capitalization ($3.69 billion), higher liquidity evidenced by greater 24-hour trading volumes ($2.6 million vs CFX's $1 million), and more established ecosystem presence since 2019. The interoperability infrastructure and multi-chain architecture align with institutional interest in foundational blockchain technology. CFX may appeal to retail investors seeking exposure to emerging regional blockchain initiatives with potentially higher growth multiples, though accompanied by correspondingly higher risk profiles. Institutional investors typically prioritize liquidity, regulatory clarity, and established track records—factors where DOT currently demonstrates stronger positioning. However, both assets require thorough due diligence regardless of investor category, with considerations including risk tolerance, portfolio diversification objectives, and alignment with specific blockchain infrastructure investment theses.
Q8: How do current market conditions (January 2026) affect the investment outlook for both assets?
As of January 15, 2026, the market sentiment index stands at 48 (Neutral), suggesting neither extreme fear nor greed dominates current market psychology. CFX trades at $0.07888 with a -0.45% 24-hour change, while DOT trades at $2.231 with a -0.97% decline, indicating modest bearish pressure on both assets. The neutral sentiment environment may present opportunities for gradual accumulation strategies rather than aggressive positioning. Both assets remain substantially below their 2021 all-time highs (CFX down approximately 95% from $1.7, DOT down approximately 96% from $54.98), suggesting potential upside scenarios if broader cryptocurrency market conditions improve. However, the moderate trading volumes and subdued price action indicate consolidation phases rather than strong directional momentum, warranting cautious positioning and careful risk management regardless of allocation decisions.
* The information is not intended to be and does not constitute financial advice or any other recommendation of any sort offered or endorsed by Gate.