This comprehensive analysis compares CKP and TRX across multiple investment dimensions. CKP, a 2025-launched DeFi yield protocol for PancakeSwap, currently trades at $0.507 with $1.997 million market cap and exhibits high volatility. TRX, an established blockchain infrastructure since 2017, maintains $27.087 billion market cap with superior liquidity at $7.49 million daily volume. The article examines historical price trends, tokenomics, institutional adoption, technological ecosystems, and risk profiles to guide investment decisions. CKP suits aggressive investors seeking growth potential, while TRX appeals to conservative investors prioritizing stability. Real-time price data and predictions through 2031 are available on Gate. Detailed FAQ sections address liquidity differences, volatility patterns, allocation strategies, and regulatory considerations, helping investors make informed decisions based on their risk tolerance and investment objectives.
Introduction: Investment Comparison Between CKP and TRX
In the cryptocurrency market, the comparison between CKP vs TRX has always been a topic that investors cannot avoid. The two not only show significant differences in market cap ranking, application scenarios, and price performance, but also represent different crypto asset positioning.
CKP (Cakepie): Launched in 2025, it has gained market recognition with its positioning as a yield and veTokenomics service provider for PancakeSwap.
TRX (TRON): Since its launch in 2017, it has been regarded as a major public blockchain infrastructure, being one of the cryptocurrencies with high global trading volume and market capitalization.
This article will comprehensively analyze the investment value comparison of CKP vs TRX around historical price trends, supply mechanisms, institutional adoption, technical ecosystems, and future predictions, and attempt to answer the question that investors are most concerned about:
"Which is the better buy right now?"
I. Historical Price Comparison and Current Market Status
CKP (Cakepie) and TRX (TRON) Historical Price Trends
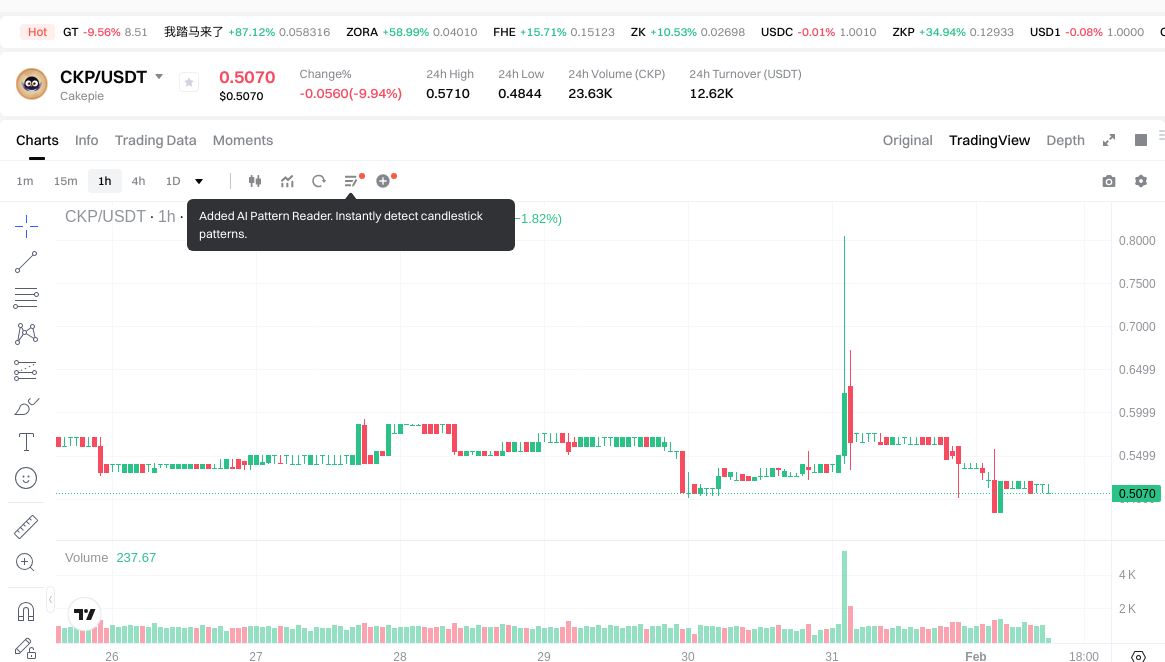
- 2025: CKP reached its all-time high of $1.6626 on June 4, 2025, following its launch and initial market reception. The token subsequently experienced notable volatility.
- 2025: CKP recorded its all-time low of $0.3043 on July 12, 2025, reflecting significant price correction within a short period after launch.
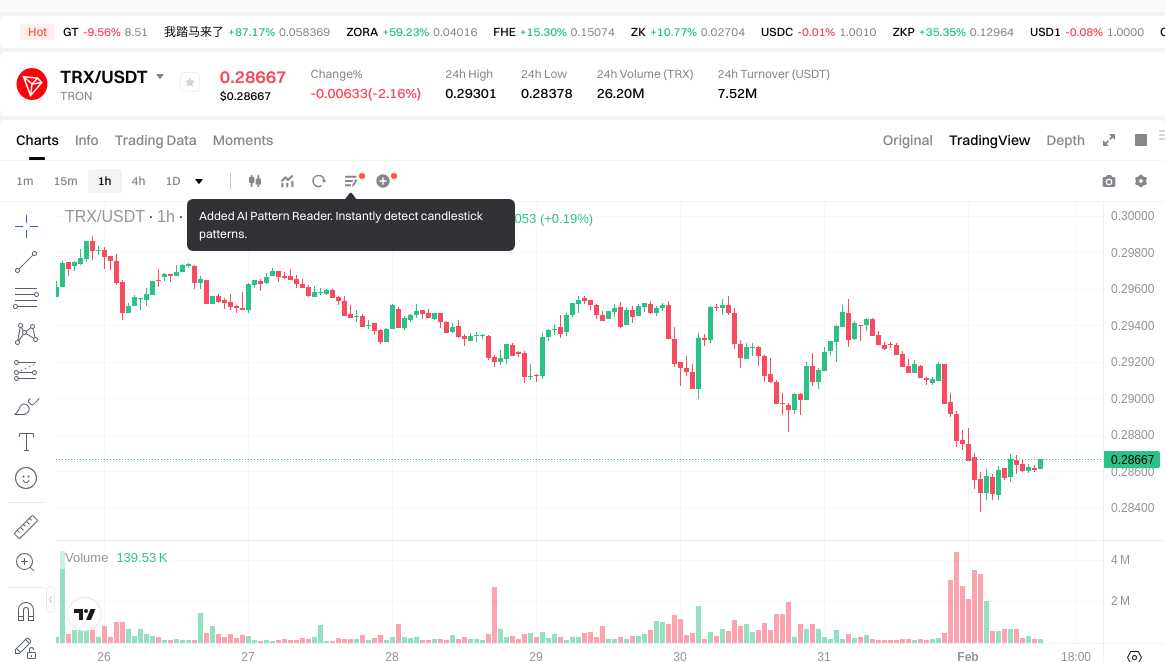
- 2024: TRX achieved its all-time high of $0.431288 on December 4, 2024, supported by ecosystem developments and broader market momentum.
- 2017: TRX established its all-time low of $0.00180434 on November 12, 2017, during its early-stage market entry period.
- Comparative Analysis: During recent market cycles, CKP declined from its high of $1.6626 to current levels around $0.507, representing significant retracement. Meanwhile, TRX has shown relative stability, trading near $0.28598 after experiencing moderate adjustments from its December 2024 peak.
Current Market Status (February 1, 2026)
- CKP Current Price: $0.507
- TRX Current Price: $0.28598
- 24-Hour Trading Volume: CKP recorded $12,604.08, while TRX demonstrated substantially higher liquidity with $7,492,623.02
- Market Sentiment Index (Fear & Greed Index): 14 (Extreme Fear)
- 24-Hour Price Changes: CKP decreased by 9.94%, TRX decreased by 2.27%
- Market Capitalization: CKP holds approximately $1.997 million in circulating market cap with 3.94 million tokens in circulation (39.38% of total supply), while TRX maintains a significantly larger market presence at $27.087 billion with 94.72 billion tokens circulating (nearly 100% of total supply)
View real-time prices:
II. Core Factors Influencing CKP vs TRX Investment Value
Supply Mechanism Comparison (Tokenomics)
- CKP: Supply mechanism details are not available in the provided materials.
- TRX: Supply mechanism details are not available in the provided materials.
- 📌 Historical Pattern: Information on how supply mechanisms drive price cycle changes is not available.
Institutional Adoption and Market Application
- Institutional Holdings: Data on which asset receives greater institutional preference is not available.
- Enterprise Adoption: Information comparing CKP and TRX applications in cross-border payments, settlements, and investment portfolios is not available.
- National Policies: Details on regulatory attitudes toward both assets across different jurisdictions are not available.
Technology Development and Ecosystem Building
- CKP Technology Upgrades: Information on technological developments and potential impacts is not available.
- TRX Technology Development: Information on technological developments and potential impacts is not available.
- Ecosystem Comparison: Data on DeFi, NFT, payment systems, and smart contract implementations for both assets is not available.
Macroeconomic Environment and Market Cycles
- Performance in Inflationary Environment: Information on which asset demonstrates stronger anti-inflation properties is not available.
- Macroeconomic Monetary Policy: Details on how interest rates and the US Dollar Index affect both assets are not available.
- Geopolitical Factors: Information on cross-border transaction demand and international situation impacts is not available.
III. 2026-2031 Price Prediction: CKP vs TRX
Short-term Prediction (2026)
- CKP: Conservative $0.259-$0.507 | Optimistic $0.507-$0.527
- TRX: Conservative $0.255-$0.286 | Optimistic $0.286-$0.349
Mid-term Prediction (2028-2029)
- CKP may enter a growth phase, with estimated price range of $0.399-$0.879
- TRX may enter a recovery phase, with estimated price range of $0.165-$0.593
- Key drivers: institutional capital inflows, ETF development, ecosystem expansion
Long-term Prediction (2030-2031)
- CKP: Baseline scenario $0.421-$0.880 | Optimistic scenario $0.880-$1.241
- TRX: Baseline scenario $0.258-$0.534 | Optimistic scenario $0.534-$0.763
View detailed price predictions for CKP and TRX
Disclaimer
CKP:
| Year |
Predicted High Price |
Predicted Average Price |
Predicted Low Price |
Price Change |
| 2026 |
0.52728 |
0.507 |
0.25857 |
-1 |
| 2027 |
0.6929676 |
0.51714 |
0.2740842 |
0 |
| 2028 |
0.653458104 |
0.6050538 |
0.399335508 |
17 |
| 2029 |
0.87466577328 |
0.629255952 |
0.57891547584 |
21 |
| 2030 |
1.0076275559376 |
0.75196086264 |
0.4210980830784 |
45 |
| 2031 |
1.240509835097208 |
0.8797942092888 |
0.457492988830176 |
70 |
TRX:
| Year |
Predicted High Price |
Predicted Average Price |
Predicted Low Price |
Price Change |
| 2026 |
0.3494568 |
0.28644 |
0.2549316 |
0 |
| 2027 |
0.448307244 |
0.3179484 |
0.165333168 |
11 |
| 2028 |
0.41760932598 |
0.383127822 |
0.2681894754 |
33 |
| 2029 |
0.5925454895052 |
0.40036857399 |
0.2322137729142 |
39 |
| 2030 |
0.57092558650974 |
0.4964570317476 |
0.258157656508752 |
73 |
| 2031 |
0.763178572053998 |
0.53369130912867 |
0.400268481846502 |
86 |
IV. Investment Strategy Comparison: CKP vs TRX
Long-term vs Short-term Investment Strategies
- CKP: May be suitable for investors interested in exploring emerging DeFi yield optimization opportunities and veTokenomics models within the PancakeSwap ecosystem. The asset's relatively recent launch in 2025 and higher price volatility suggest it may appeal to those with higher risk tolerance seeking potential growth opportunities.
- TRX: May be suitable for investors seeking exposure to established blockchain infrastructure with demonstrated longevity since 2017. The asset's larger market capitalization and higher trading liquidity could appeal to those prioritizing market stability and transaction accessibility.
Risk Management and Asset Allocation
- Conservative Investors: CKP 10-20% vs TRX 80-90% - Conservative portfolios may favor the more established asset with greater liquidity and market history.
- Aggressive Investors: CKP 40-50% vs TRX 50-60% - Aggressive portfolios might allocate more substantially to both assets while maintaining diversification.
- Hedging Tools: Stablecoin allocation, options strategies, cross-asset portfolio combinations
V. Potential Risk Comparison
Market Risk
- CKP: The asset has demonstrated significant volatility, declining from $1.6626 in June 2025 to current levels around $0.507, representing substantial retracement within a relatively short period. Current 24-hour trading volume of $12,604.08 indicates lower liquidity compared to more established assets.
- TRX: While showing more moderate price adjustments from its December 2024 peak of $0.431288 to current levels around $0.28598, the asset remains subject to broader cryptocurrency market fluctuations. Current market sentiment shows extreme fear (index: 14), which may impact short-term price movements.
Technical Risk
- CKP: As a relatively new protocol launched in 2025, the asset's long-term technical stability and scalability remain to be demonstrated through extended market cycles.
- TRX: With operational history since 2017, the blockchain has accumulated technical track record, though network performance considerations may vary with ecosystem expansion.
Regulatory Risk
- Global regulatory approaches toward cryptocurrency assets continue to evolve, which may impact both CKP and TRX differently based on their respective use cases, market positioning, and jurisdictional presence. Investors should monitor regulatory developments in relevant markets.
VI. Conclusion: Which Is the Better Buy?
📌 Investment Value Summary:
- CKP Characteristics: Represents exposure to DeFi yield optimization sector with PancakeSwap ecosystem integration; demonstrates higher volatility profile with potential for significant price movements; relatively limited circulation (39.38% of total supply) and lower current liquidity.
- TRX Characteristics: Offers exposure to established blockchain infrastructure with extended operational history; demonstrates larger market capitalization ($27.087 billion) and substantially higher trading liquidity ($7.49 million 24-hour volume); near-complete token circulation (approximately 100% of total supply).
✅ Investment Considerations:
- Novice Investors: May consider starting with smaller position sizes in more established assets with higher liquidity, while thoroughly researching both projects' fundamentals, use cases, and risk profiles before making investment decisions.
- Experienced Investors: May evaluate diversification opportunities across different cryptocurrency sectors, considering factors such as market capitalization differences, liquidity profiles, historical performance patterns, and ecosystem development trajectories.
- Institutional Investors: May conduct comprehensive due diligence on regulatory compliance, liquidity depth, custody solutions, and risk management frameworks suitable for both emerging DeFi protocols and established blockchain infrastructure assets.
⚠️ Risk Disclosure: The cryptocurrency market exhibits significant volatility and uncertainty. This analysis does not constitute investment advice. Investors should conduct independent research, assess their own risk tolerance, and consider consulting with qualified financial advisors before making investment decisions.
VII. FAQ
Q1: What are the main differences between CKP and TRX in terms of market positioning?
CKP is a DeFi yield optimization protocol launched in 2025, while TRX is an established blockchain infrastructure platform operating since 2017. CKP focuses specifically on veTokenomics services for PancakeSwap with a market capitalization of approximately $1.997 million and 39.38% token circulation. In contrast, TRX represents a mature public blockchain with a substantially larger market presence at $27.087 billion market capitalization and near-complete token circulation (approximately 100%). The fundamental difference lies in their operational scope: CKP serves as a specialized DeFi application layer, whereas TRX functions as comprehensive blockchain infrastructure supporting diverse ecosystem applications.
Q2: Which asset demonstrates better liquidity for trading?
TRX exhibits significantly superior liquidity compared to CKP. As of February 1, 2026, TRX recorded 24-hour trading volume of $7,492,623.02, while CKP registered only $12,604.08 during the same period—representing approximately a 594x difference in trading volume. This substantial liquidity gap means TRX offers easier market entry and exit with potentially lower slippage, making it more accessible for investors requiring frequent trading flexibility or larger position sizes. The liquidity advantage reflects TRX's longer market establishment, broader exchange listings, and wider investor base accumulated since 2017.
Q3: How do the price volatility patterns differ between CKP and TRX?
CKP demonstrates substantially higher volatility than TRX. Since its 2025 launch, CKP experienced extreme price swings from its all-time high of $1.6626 (June 4, 2025) to an all-time low of $0.3043 (July 12, 2025)—a decline exceeding 80% within approximately one month. Currently trading around $0.507 with a 9.94% decline in 24 hours, CKP shows continued significant short-term fluctuations. By comparison, TRX exhibits relatively moderate price movements, with its all-time high of $0.431288 (December 2024) and current price around $0.28598 representing more gradual adjustments. The 24-hour decline of 2.27% for TRX further illustrates its comparatively stable price behavior, reflecting its established market position and larger liquidity base.
Q4: What are the projected price ranges for CKP and TRX through 2031?
For 2026, CKP conservative projections range from $0.259-$0.507, with optimistic scenarios reaching $0.507-$0.527. TRX conservative estimates span $0.255-$0.286, with optimistic projections at $0.286-$0.349. By 2031, CKP baseline scenarios project $0.421-$0.880, potentially extending to $0.880-$1.241 under optimistic conditions. TRX baseline projections for 2031 range from $0.258-$0.534, with optimistic scenarios reaching $0.534-$0.763. These projections suggest CKP may exhibit higher percentage growth potential from current levels, though accompanied by greater uncertainty given its shorter operational history. TRX projections reflect more measured growth expectations consistent with mature asset characteristics.
Q5: How should investors allocate between CKP and TRX based on risk tolerance?
Conservative investors may consider allocations favoring TRX at 80-90% versus CKP at 10-20%, prioritizing the established asset's demonstrated longevity, superior liquidity, and relatively stable price behavior. Aggressive investors with higher risk tolerance might adopt more balanced allocations such as CKP at 40-50% versus TRX at 50-60%, seeking exposure to potential growth opportunities while maintaining diversification. The allocation decision should account for CKP's emerging protocol characteristics with limited operational track record versus TRX's established infrastructure position with extensive market history. Additionally, investors should implement appropriate risk management tools including stablecoin reserves, position sizing discipline, and portfolio rebalancing strategies regardless of chosen allocation approach.
Q6: What regulatory considerations affect CKP and TRX investments?
Both CKP and TRX face evolving global cryptocurrency regulatory frameworks that may impact their operations and investor access differently. TRX's established presence since 2017 means it has navigated various regulatory environments across multiple jurisdictions, potentially providing more regulatory clarity for institutional participants. However, its classification as blockchain infrastructure may attract different regulatory scrutiny compared to application-layer protocols. CKP, as a newer DeFi yield protocol launched in 2025, operates in an actively evolving regulatory landscape for decentralized finance applications. Investors should monitor jurisdiction-specific regulations regarding cryptocurrency trading, taxation, reporting requirements, and potential restrictions on DeFi protocols. The regulatory risk assessment should consider both assets' geographic exposure, use case positioning, and compliance frameworks within relevant operating jurisdictions.
Q7: What factors should novice investors prioritize when choosing between CKP and TRX?
Novice investors should prioritize several fundamental considerations: First, assess liquidity requirements—TRX's substantially higher trading volume ($7.49 million versus $12,604 for CKP) provides easier market access and exit flexibility. Second, evaluate risk tolerance—CKP's extreme volatility (80%+ decline from peak within one month) requires capacity to withstand significant short-term losses, while TRX demonstrates comparatively moderate price movements. Third, consider investment timeframe—CKP's limited operational history since 2025 offers less historical reference for long-term performance assessment compared to TRX's track record since 2017. Fourth, start with smaller position sizes while conducting thorough research on each project's fundamentals, use cases, development teams, and ecosystem adoption. Finally, prioritize understanding the underlying technology and value proposition rather than focusing solely on price predictions, and consider consulting qualified financial advisors before making investment decisions.
Q8: How do current market conditions affect the CKP vs TRX investment decision?
Current market conditions as of February 1, 2026, show extreme fear sentiment (Fear & Greed Index: 14), which historically presents both risks and opportunities. In such environments, CKP's lower liquidity ($12,604 24-hour volume) may amplify downside volatility, as the current 9.94% daily decline demonstrates, while recovery periods might also exhibit sharp upward movements. TRX's more moderate 2.27% daily decline reflects its larger liquidity buffer's stabilizing effect during market stress. The extreme fear environment may favor established assets like TRX for risk-averse investors seeking relative stability, while presenting potential accumulation opportunities for risk-tolerant investors willing to navigate CKP's heightened volatility. Both assets' near-term price trajectories will likely correlate with broader market sentiment recovery, though CKP may demonstrate more pronounced reactions to sentiment shifts given its smaller market capitalization and emerging protocol status.
* The information is not intended to be and does not constitute financial advice or any other recommendation of any sort offered or endorsed by Gate.