This comprehensive guide explores Doji candlestick patterns as essential tools for crypto traders on Gate and other platforms seeking to identify market indecision and potential trend reversals. Covering five distinct Doji types—Neutral, Long-Legged, Four-Price, Dragonfly, and Gravestone—the article demonstrates how to recognize market psychology shifts that precede significant price movements. Key strategies include waiting for confirmation signals, utilizing Doji at support and resistance levels, combining indicators with volume analysis, and implementing strict stop-loss discipline. While Doji patterns alone carry limitations and false signal risks, their integration into a comprehensive technical analysis framework significantly enhances trading accuracy and risk management effectiveness for successful cryptocurrency trading.
What is a Doji Candle?
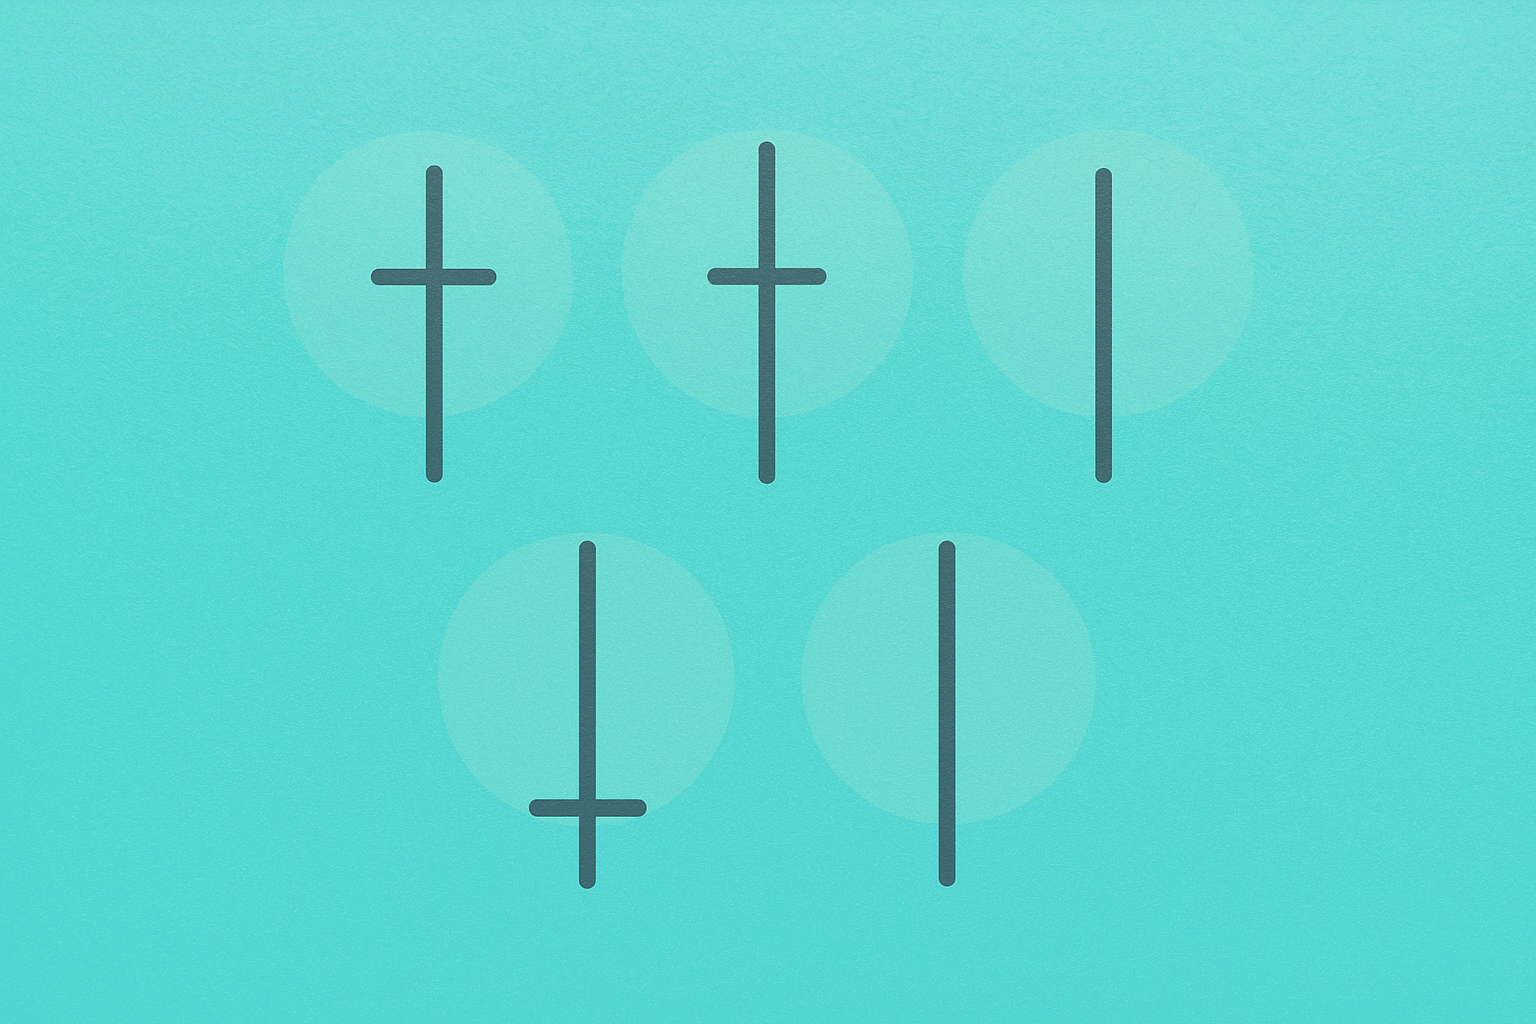
A Doji candle is a candlestick pattern that represents market neutrality and indecision. When the opening price and closing price are very similar or identical, the candle appears to have only wicks (shadows) with little to no body, creating a distinctive cross-like shape.
Every candlestick contains four essential pieces of price information that traders use to analyze market movements:
- The opening price for the given period
- The closing price for the given period
- The highest price reached during the period
- The lowest price reached during the period
The Doji pattern is particularly significant because it visually represents a moment when neither buyers nor sellers have gained control, suggesting a potential shift in market momentum or a continuation of consolidation.
History of the Doji Candle
The concept of candlestick patterns originated in Japan during the 18th century, where rice traders developed this visual method to track market psychology and price movements. These techniques were later introduced to modern Western trading through the groundbreaking work of Steve Nison, whose books brought Japanese candlestick charting to international attention.
In Japanese, the word "Doji" (同時) translates to "mistake" or "error," reflecting the notion that the pattern appears as if traders made an unintentional error, with the market closing at nearly the same level it opened. This naming captures the essence of market indecision that the pattern represents.
The historical significance of Doji patterns has been validated over centuries of trading, making them one of the most recognized and respected candlestick formations in technical analysis today.
Types of Doji Candles and Their Implications
Neutral Doji
The Neutral Doji, also known as the Standard Doji, features opening and closing prices that are identical or nearly identical, with upper and lower shadows of approximately equal length. This symmetrical appearance indicates that during the trading session, neither buyers nor sellers gained any significant advantage.
This pattern represents pure market indecision and often appears during consolidation phases. Traders interpret this as a "wait-and-see" signal, suggesting that the market is in a state of equilibrium and awaiting a catalyst to determine the next directional move.
Long-Legged Doji
The Long-Legged Doji resembles the Neutral Doji but features significantly longer upper and lower shadows extending from the opening/closing price point. These extended wicks indicate that during the trading period, prices moved substantially in both directions before ultimately closing near the opening level.
This pattern reveals heightened volatility and intense battle between bulls and bears. The longer shadows demonstrate that significant price discovery occurred during the session, with dramatic swings between the high and low prices, yet neither side could maintain control by the close.
Four-Price Doji
The Four-Price Doji is an extremely rare pattern that appears as a simple horizontal line with no shadows whatsoever. In this formation, the opening price, closing price, highest price, and lowest price are all identical, meaning absolutely no price movement occurred during the entire trading period.
This pattern is exceptionally uncommon in liquid markets with high trading volumes. When it does appear, it typically indicates an extremely quiet trading session with minimal market participation, often occurring during holiday periods or in very illiquid securities.
Dragonfly Doji
The Dragonfly Doji is characterized by opening, closing, and high prices that are all at the same level, with a long lower shadow extending downward. The pattern resembles a "T" shape and carries significant reversal implications.
When this pattern appears after a downtrend, it is frequently interpreted as a bullish reversal signal. The long lower shadow indicates that sellers pushed prices significantly lower during the session, but buyers stepped in with enough strength to drive prices back up to the opening level by the close, suggesting a potential shift in momentum from bearish to bullish.
Gravestone Doji
The Gravestone Doji features opening and closing prices near the low of the period, with a long upper shadow extending upward. This pattern appears as an inverted "T" shape and typically carries bearish implications.
When occurring after an uptrend, the Gravestone Doji is often considered a strong bearish reversal signal. The long upper shadow demonstrates that buyers attempted to push prices higher during the session, but sellers overwhelmed them, driving prices back down to close near the opening level, indicating potential exhaustion of bullish momentum.
How to Use Doji Candlesticks in Trading
-
Wait for Confirmation Signals: Since a Doji represents indecision rather than a definitive directional signal, avoid making immediate buy or sell decisions. Instead, wait for the subsequent candle to confirm the direction before entering a position. A bullish candle following a Dragonfly Doji, for example, strengthens the reversal signal.
-
Utilize Doji at Support and Resistance Levels: Doji patterns carry greater significance when they appear near key price levels such as major support or resistance zones, previous highs or lows, or important moving averages. These strategic locations amplify the pattern's predictive power.
-
Combine with Volume and Technical Indicators: Enhance the reliability of Doji signals by incorporating volume analysis and technical indicators. High trading volume accompanying a Doji suggests stronger conviction in the indecision, while oscillators like RSI or MACD can provide additional context about overbought or oversold conditions.
-
Trade Star Patterns: Doji candles often form the middle component of powerful three-candle patterns such as Morning Star (bullish reversal) or Evening Star (bearish reversal). These multi-candle formations provide more robust trading signals than a single Doji alone.
-
Short-Term Intraday Trading: Day traders can utilize Doji patterns on shorter timeframes as triggers for quick entry and exit decisions. The pattern's appearance on 5-minute or 15-minute charts can signal temporary pauses in momentum, offering scalping opportunities.
-
Set Stop-Loss Orders: Implement proper risk management by placing stop-loss orders just above the high or below the low of the Doji candle. This approach limits potential losses if the anticipated move fails to materialize.
-
Partial Position Entry and Trend Continuation: Recognize that Doji patterns within strong trends may represent temporary pauses rather than reversals. Consider entering partial positions and adding to them if the trend resumes, rather than committing full capital immediately.
Psychology Behind Doji Candlesticks
The true power of the Doji candle lies in its representation of psychological equilibrium in the market. When a Doji forms, it visually demonstrates that buyers and sellers have reached a temporary stalemate, with neither side able to gain control and push prices definitively in their favor.
This psychological balance reflects market uncertainty and hesitation among participants. Traders are reassessing their positions, waiting for new information, or simply uncertain about the next move. This collective indecision creates a critical inflection point where the market could break in either direction.
When a Doji appears after a sustained trend, it often signals that the psychological dynamics driving that trend are beginning to shift. Exhaustion may be setting in among the dominant side, while the opposing side gains confidence. This psychological transition frequently precedes significant trend reversals or consolidation periods.
Understanding this psychological component helps traders appreciate why Doji patterns are most powerful at key decision points in the market, where uncertainty naturally peaks and directional conviction must be re-established.
Limitations and Precautions of Doji Candles
-
Risk of Relying on Single Signals: A Doji alone does not guarantee a reversal or strong directional move. Many Doji patterns fail to produce the anticipated result, making confirmation essential before acting.
-
False Signals in Low Liquidity: In markets or timeframes with insufficient trading volume, Doji patterns may appear frequently but represent mere noise rather than meaningful signals. Always verify adequate liquidity before trading Doji patterns.
-
Excessive Formation in Ranging Markets: During sideways or consolidation phases, Doji candles tend to appear repeatedly as the market oscillates without clear direction. In these conditions, the patterns lose their predictive value and can lead to overtrading.
-
Timing Issues: Waiting for confirmation signals after a Doji may cause traders to miss optimal entry prices. By the time confirmation arrives, a significant portion of the anticipated move may have already occurred.
-
Pattern Misidentification: Doji patterns can be confused with similar candlestick formations such as spinning tops or small-bodied candles. Precise identification requires attention to the specific characteristics that define each Doji type.
-
Only Part of Comprehensive Analysis: Doji patterns should never be analyzed in isolation. They must always be interpreted within the broader context of trend analysis, momentum indicators, volume patterns, fundamental news, and overall market conditions.
-
Emotional Interpretation Bias: Traders may fall into the trap of projecting their wishes onto Doji patterns, seeing bullish signals when hoping for upward moves or bearish signals when positioned short. This confirmation bias can lead to poor trading decisions.
Conclusion
While Doji candlesticks are not the most powerful standalone trading signal, they serve as valuable tools when integrated into a comprehensive market analysis framework. These patterns excel at identifying potential trend changes, providing additional context for entry and exit timing decisions, and highlighting moments when market momentum has temporarily stalled.
The true value of Doji patterns lies in their ability to alert traders that previous momentum has paused, creating a critical juncture where new directional movement may emerge. By recognizing these moments of equilibrium and combining them with confirmation signals, volume analysis, technical indicators, and broader market context, traders can significantly enhance their ability to navigate market transitions and capitalize on emerging opportunities.
Successful trading with Doji patterns requires patience, discipline, and a commitment to waiting for proper confirmation before acting. When used correctly as part of a well-rounded trading strategy, these ancient Japanese candlestick formations continue to provide valuable insights into market psychology and potential price movements in modern financial markets.
FAQ
What is a Doji candlestick? What is its significance in technical analysis?
A Doji is a candlestick where opening and closing prices are nearly identical, creating a cross-like shape. It signals market indecision and potential trend reversal, making it a key indicator for traders analyzing price movements and momentum shifts.
How to identify and distinguish different types of Doji candlesticks (standard Doji, Dragonfly Doji, Gravestone Doji)?
Standard Doji has equal open and close prices, indicating market indecision. Gravestone Doji appears at uptrends' tops with long upper wicks, signaling bearish reversals. Dragonfly Doji forms at downtrends' bottoms with long lower wicks, suggesting bullish reversals.
What market signal does a Doji candlestick usually indicate? Buy or sell?
Doji candlesticks signal potential trend reversals. After downtrends, they suggest possible price increases; after uptrends, they indicate selling pressure and potential price declines. Confirmation from following candles is essential for trading decisions.
How to trade Doji candlesticks in different market trends (uptrend, downtrend, sideways market)?
In uptrends, Doji signals potential reversal at resistance levels, consider selling. In downtrends, Doji indicates reversal at support, consider buying. In sideways markets, Doji suggests consolidation, await breakout confirmation before trading.
How reliable are Doji candlesticks? Is it risky to trade using them alone?
Doji candlesticks indicate market hesitation but lack strong trend signals when used alone. Reliability improves significantly when combined with other technical indicators. Solo trading with Doji carries moderate risk due to limited directional confirmation.
How to combine other technical indicators (support/resistance, moving averages, etc.) to confirm Doji signals?
Combine Doji with support/resistance levels and moving averages to validate signals. Use volume confirmation and trend context to filter false signals during consolidation phases for higher accuracy.
How do professional traders use Doji candlesticks to develop risk management and stop-loss strategies?
Professional traders identify Doji candlesticks as reversal signals indicating market indecision, then place strategic stop-loss orders beyond key support or resistance levels to manage risk exposure and limit potential losses effectively.
* The information is not intended to be and does not constitute financial advice or any other recommendation of any sort offered or endorsed by Gate.